
Remember me

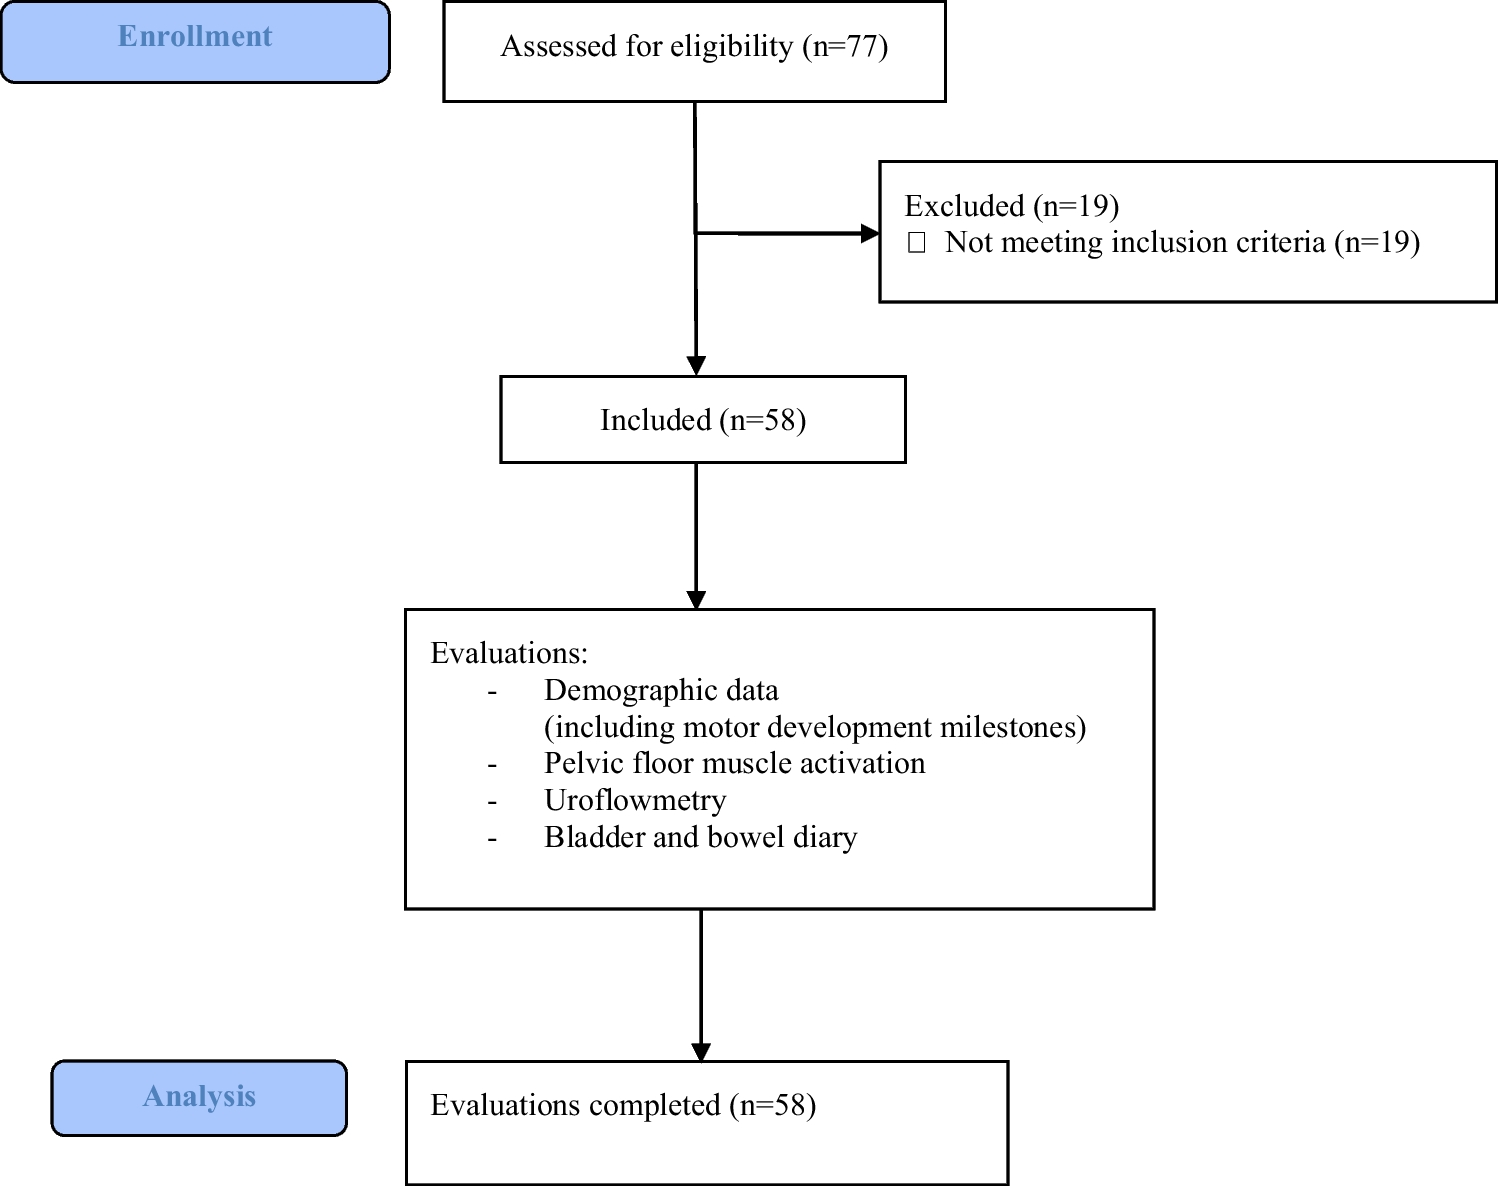
The search strategy identified 908 unique records, of which 74 were assessed based on full text, and 3 records (3 unique studies) were included (Fig. 1) [16,17,18]. The most frequent reasons for exclusion based on full-text assessment were wrong study design and wrong population (Table S3).
Fig. 1
PRISMA 2020 flow diagram [19]
Description of studiesTables 1 and S4 contain an overview of characteristics of included studies. All included studies were designed as parallel RCTs, comparing telemonitoring versus standard care in adolescents with IBD. The total number of randomized participants ranged between 53 and 170. The proportion of females across the studies ranged between 37 and 58%. Study populations included adolescents with an age range between 11.2 and 17 years. In the studies by Akobeng et al. and Heida et al., all participants were in clinical disease remission at baseline [16, 17]. In the study by Carlsen et al., 57% had active disease at baseline [18].
The telemonitoring intervention was phone-based [17] or web-based [16, 18]. Monitoring intervals were monthly [18], tailored to risk stratum [16], or not reported [17]. Monitoring in the control group mainly consisted of planned outpatient visits. The follow-up period was 12 [18] or 24 [16, 17] months.
All studies provided measurements of the primary outcome, disease activity (disease flares, treatment intensification), and all studies measured QoL with the IMPACT(-III) questionnaire [20,21,22]. Data was reported for all other outcomes, but not in all included studies. The characteristics of each study and the direction of effect per outcome are summarized in Table 1. More information on the reported study outcomes and results is available in Tables S5 and S6.
Table 1 Study characteristics and adapted effect direction plot based on Boon and Thomson [23]Regarding risk of bias, there were some concerns for two studies [16, 17] due to risk of bias in the measurement of the outcome. One study was at high risk of bias due to shortcomings in the measurement of the outcome and due to missing outcome data (Table S7) [18]. Assessments of the certainty of evidence are summarized in Table 2.
Table 2 Certainty of evidenceDisease activityAll three included studies reported a measure of disease activity [16,17,18].
Akobeng et al. found a non-significantly lower number of relapses, defined by Pediatric Ulcerative Colitis Activity Index (PUCAI) or abbreviated Pediatric Crohn’s Disease Activity Index (aPCDAI) score(s) > 15, in the telemonitoring group compared to standard care (1 per 44 patients (2%) versus 4 per 42 patients (10%), 1 study, some concerns of bias). RR for disease relapse was 0.24 (95% confidence interval [CI] 0.03 to 2.05, p = 0.20) [17].
Heida et al. found that the cumulative incidence of disease flares, defined as disease activity necessitating therapy intensification, was similar between telemonitoring and control (28 per 84 patients (33%) versus 29 per 86 patients (34%), 1 study, some concerns of bias). RR for disease flare was 0.99 (95% CI 0.65 to 1.51, p = 0.96). The study did not find a difference in time-to-flare between groups (p = 0.932) [16]. Carlsen et al. reported that the time to first step-up in treatment intensity (escalating dose or change/addition of a more potent drug) did not differ between groups (p = 0.53, 1 study, high risk of bias) [18].
Certainty of evidence for disease activity was low due to risk of bias (lack of blinding of outcome assessors and missing outcome data) and imprecision (low number of events and participants and wide confidence intervals around the reported effects that do not preclude inferiority of telemonitoring).
Quality of lifePediatric IBD health-related quality of life (QoL) was assessed by all three included studies [16,17,18] with the IMPACT-III QoL questionnaire [20,21,22]. Across the included studies, multiple score ranges were used (0 to 100 [16]; 0 to 140 [16]; 35 to 175 [18]).
All studies reported a non-inferior effect of telemonitoring versus standard care on QoL. Two out of three studies reported results in favor of telemonitoring [16, 17]. The effect estimate in Akobeng et al. was a MD of 8.7 (95% CI 1.1 to 16.3, p = 0.03, 1 study, some concerns of bias) in favor of telemonitoring. The MD was 5.7 (95% CI − 2.9 to 14.3, p = 0.19) when adjusted for baseline outcome and disease type [17].
Heida et al. reported a non-significant improvement in mean change QoL score from baseline in the telemonitoring group versus the control group (1.3 versus − 0.3 respectively, p = 0.27, 1 study, some concerns of bias) [16].
Carlsen et al. merely reported that there was no difference in QoL between groups (1 study, high risk of bias) [18].
Certainty of evidence for QoL was low, due to risk of bias (lack of blinding of outcome assessors and missing outcome data) and imprecision (low number of participants and wide confidence intervals around the reported effect that do not preclude inferiority).
CostsTwo out of three studies reported measures of cost [16, 17].
Akobeng et al. found lower mean consultation costs in the telemonitoring group than in the control group, 35.4 versus 51.1 British pounds respectively (MD − 15.7 pounds; 95% CI − 11.8 to − 19.6; p < 0.001; 86 participants (44 telemonitoring, 42 control group); 1 study; low risk of bias) [17].
Heida et al. reported in a trial-based cost-effectiveness analysis that the annual cost savings of telemonitoring, compared to standard care, was 89 euros per person. In participants compliant to the protocol (response to ≥ 80% of automated alerts in the telemonitoring group or sending in ≥ 2 stool samples for calprotectin measurement in the control group), these savings were 360 euros per person (170 included participants, of whom 120 compliant (48 telemonitoring group (57%), 72 control group (84%)); 1 study; low risk of bias). This cost-effectiveness analysis incorporated all direct and indirect medical and non-medical costs [16].
Certainty of evidence for costs was moderate due to imprecision (low number of participants and studies).
Patient satisfaction and adherence measuresSatisfaction and/or adherence measures were reported in all three included studies [16,17,18].
Two studies described measures of patient satisfaction [16, 17]. Heida et al. reported that 71% of 59 intervention group participants wished to continue with home telemonitoring care and that 96% considered home telemonitoring as timesaving [16]. Akobeng et al. reported no difference between groups regarding patient satisfaction with consultations, using the child-modified Consultation Satisfaction Questionnaire (CSQ-child) (MD 1.00; 95% CI − 1.25 to 3.25; p = 0.38). After adjusting for baseline outcome and disease type, the MD was 0.59 (95% CI − 2.05 to 3.2; p = 0.65) [17].
Certainty of evidence for patient satisfaction was low, due to risk of bias (lack of blinding of outcome assessors) and imprecision (low number of participants and studies).
All three studies reported on patient adherence measures [16, 18]. Carlsen et al. described no difference between groups regarding medication adherence (Medication Adherence Report Scale [MARS]), adjusting for age and time from diagnosis (53 participants, 27 telemonitoring, and 26 control group participants; 1 study; high risk of bias) [18]. Akobeng et al. reported results on consultation adherence. The proportion of attended consultations was 67% with telemonitoring (telephone consultations) and 71% in the control group (face-to-face consultations) (RR for attendance 1.06 (0.78 to 1.43); p = 0.71; 86 participants (44 telemonitoring, 42 control group); 1 study; low risk of bias) [17]. Heida et al. reported results on protocol compliance: 57% of 84 participants in the telemonitoring group was compliant to the study protocol (defined as responding to ≥ 80% of automated alerts), whereas in the standard care group, 84% of 86 participants was compliant (sending in ≥ 2 stool samples for calprotectin measurement) (RR of non-compliance 2.63; 95% CI 1.54 to 4.51; p = 0.0004; 170 participants; 1 study; some concerns of bias) [16].
Certainty of evidence for patient adherence was low, due to risk of bias (lack of blinding of outcome assessors) and inconsistency (variability in direction of effect).
Face-to-face outpatient contactsAll three included studies reported on face-to-face outpatient contacts. Two studies reported a non-inferior effect of telemonitoring versus standard care on this outcome domain, with results in favor of telemonitoring [16, 18].
Carlsen et al. reported fewer planned (38 per 15 patients versus 146 per 18 patients, p < 0.001) but slightly more on-demand outpatient visits (47 versus 39, p = 0.68) with telemonitoring compared to control. Overall, the telemonitoring group had less outpatient visits compared to the control group (85 versus 185, p < 0.0001, 1 study, high risk of bias) [18].
Heida et al. found that telemonitoring resulted in fewer face-to-face encounters with a healthcare provider compared to standard care (300 per 84 patients versus 328 per 86 patients (mean 3.6 versus 4.3 per patient, p < 0.001), 1 study, low risk of bias) [16].
Face-to-face outpatient contacts were only assessed for the control group in Akobeng et al. with a median per person of 3 [IQR 2 to 4] (30 per 42 patients, 1 study, low risk of bias) [17].
Certainty of evidence for face-to-face outpatient contacts was low, due to risk of bias (missing outcome data) and imprecision (low number of events and wide confidence intervals around the reported effect).
Unplanned ER visits, surgery, and hospitalizationsTwo studies reported results for unplanned ER visits and hospitalizations [16,17,18]. No results on unplanned surgery were reported.
Carlsen et al. found no difference in the median number of acute ER visits or hospitalizations between the telemonitoring and control groups, with a median of, respectively, 0 [IQR 0 to 0] and 0 [IQR 0 to 1] events (p = 0.13). However, the study reported overall fewer acute ER visits or hospitalizations in the telemonitoring group (3 visits per 15 patients versus 10 visits per 18 patients in total, 1 study, high risk of bias) [18].
Heida et al. reported a similar number of emergency consultations, e.g., rapid access to specialist care, between telemonitoring and control groups (respectively 4 per 84 patients and 5 per 86 patients, 1 study, low risk of bias) [16].
Certainty of evidence for unplanned ER visits, surgery, and hospitalizations was moderate, rated down for risk of bias (missing outcome data).
Comments (0)