
Remember me

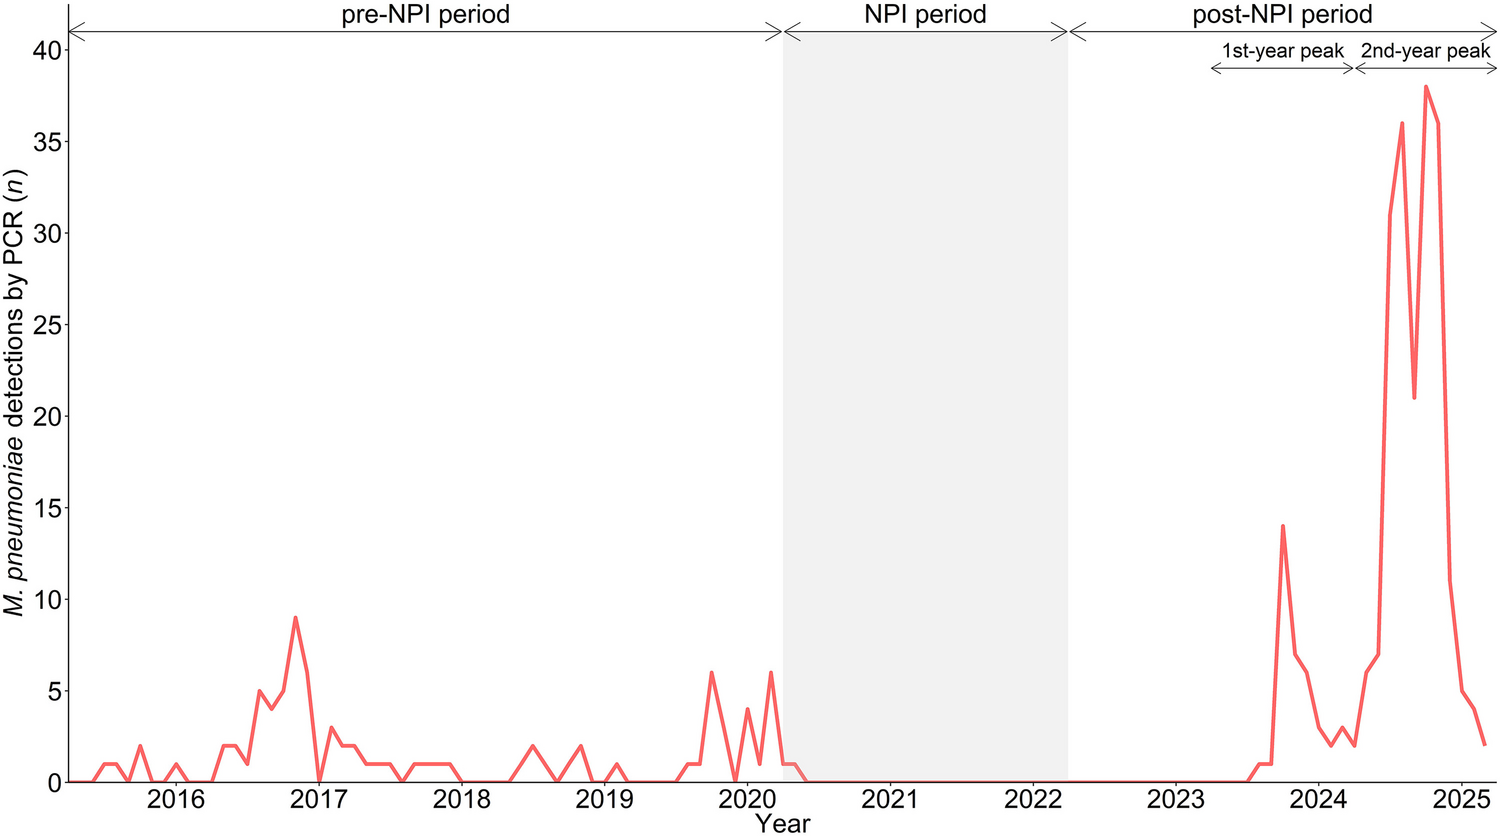

This prospective cohort study recruited a convenience sample from eight public kindergartens in the Pudong District of Shanghai. The implementation process is detailed in Fig. 1. At baseline (October 2020, T1) and at follow-up (December 2022, T2), all children from the junior classes and their parents were invited to participate, with questionnaires distributed to and collected from parents via the same teacher-mediated home‐return procedure at both time points. Of the 644 parent–child dyads initially recruited, the following exclusions were applied: (i) parents who were not the primary caregivers, (ii) children with nutrition-related conditions (e.g., fever or diarrhea), and (iii) questionnaires with more than 30% missing data. Written informed consent was obtained from all parents at each time point.
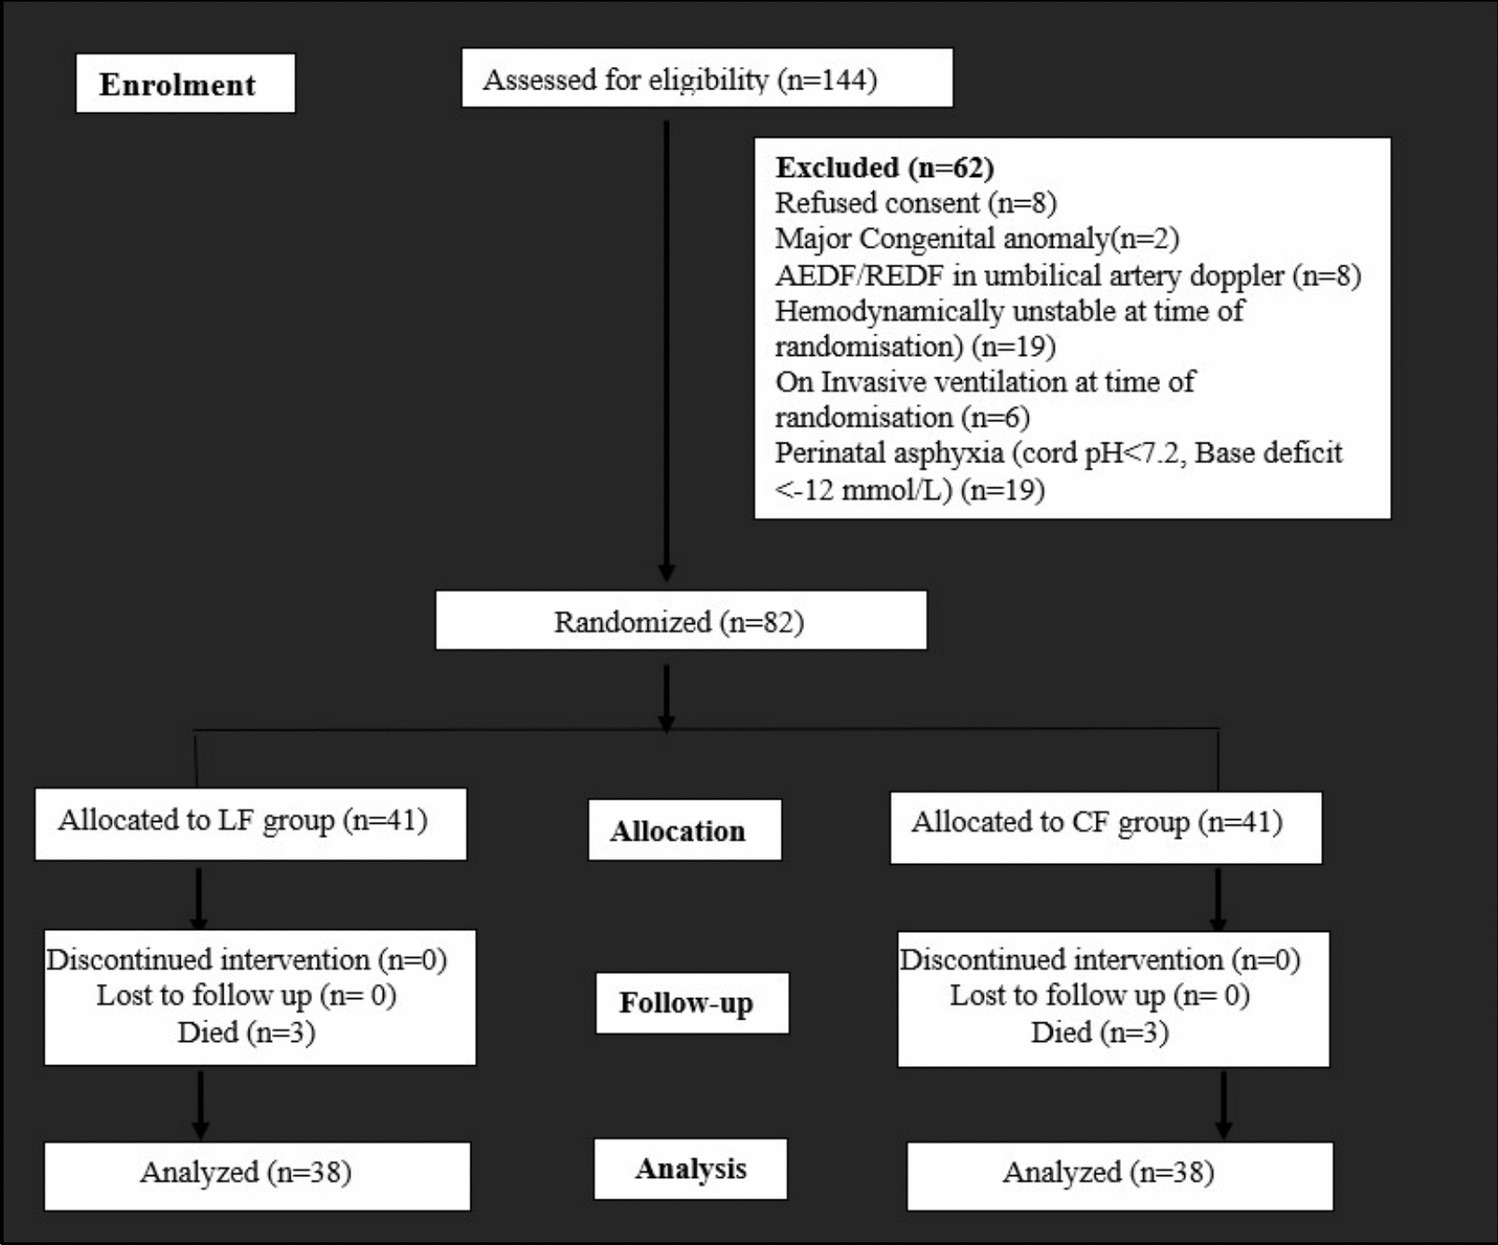
Fig. 1
Procedure of participant recruitment and implementation process
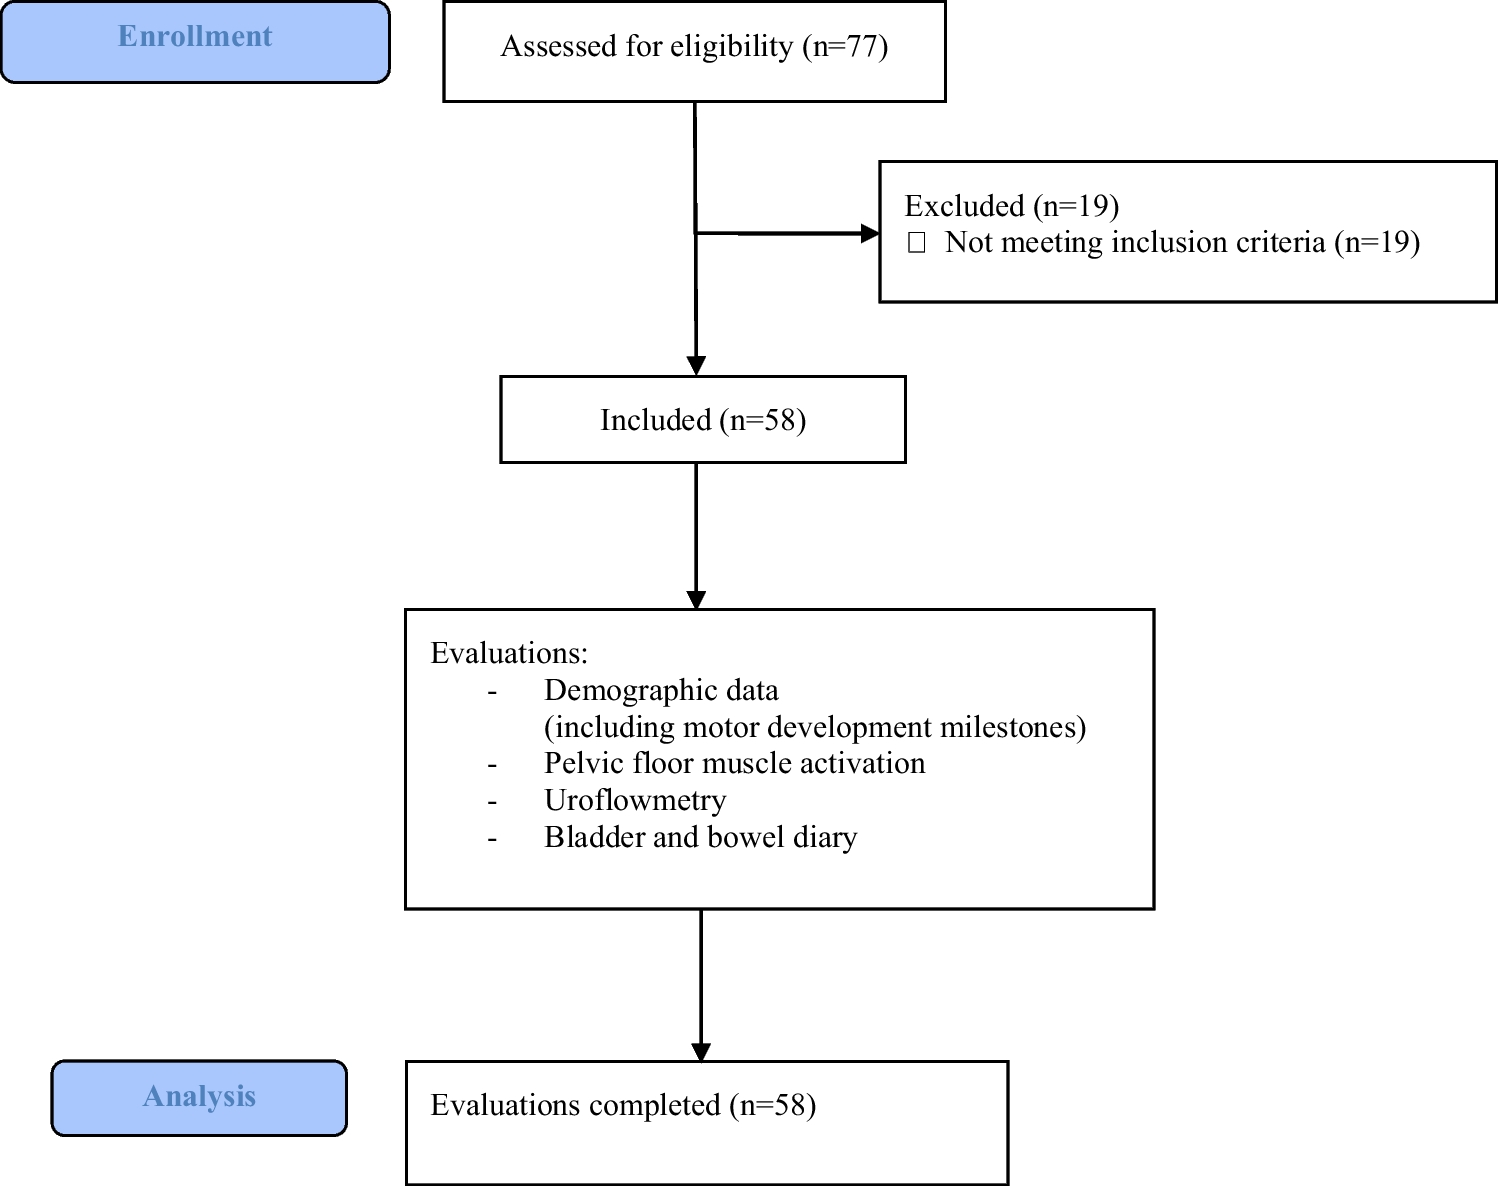
A total of 180 parent–child dyads were lost to follow-up due to the following reasons: absence, transfer schools, and decline to participate in the follow-up investigation. Supplementary Table 1 showed no significant differences in baseline demographic characteristics between parent–child dyads lost to follow-up and those retained in the study. Additionally, 7 dyads were excluded due to missing data > 30%. The analytic samples included 426 parent–child dyads at baseline and follow-up (Fig. 2). In this study, the follow-up rate was 70.6%, and the complete follow-up rate was 69.49%. Ethical approval for this study was obtained from the Ethics Committee of Shanghai Jiao Tong University School of Medicine (registration number: SJUPN-201908).
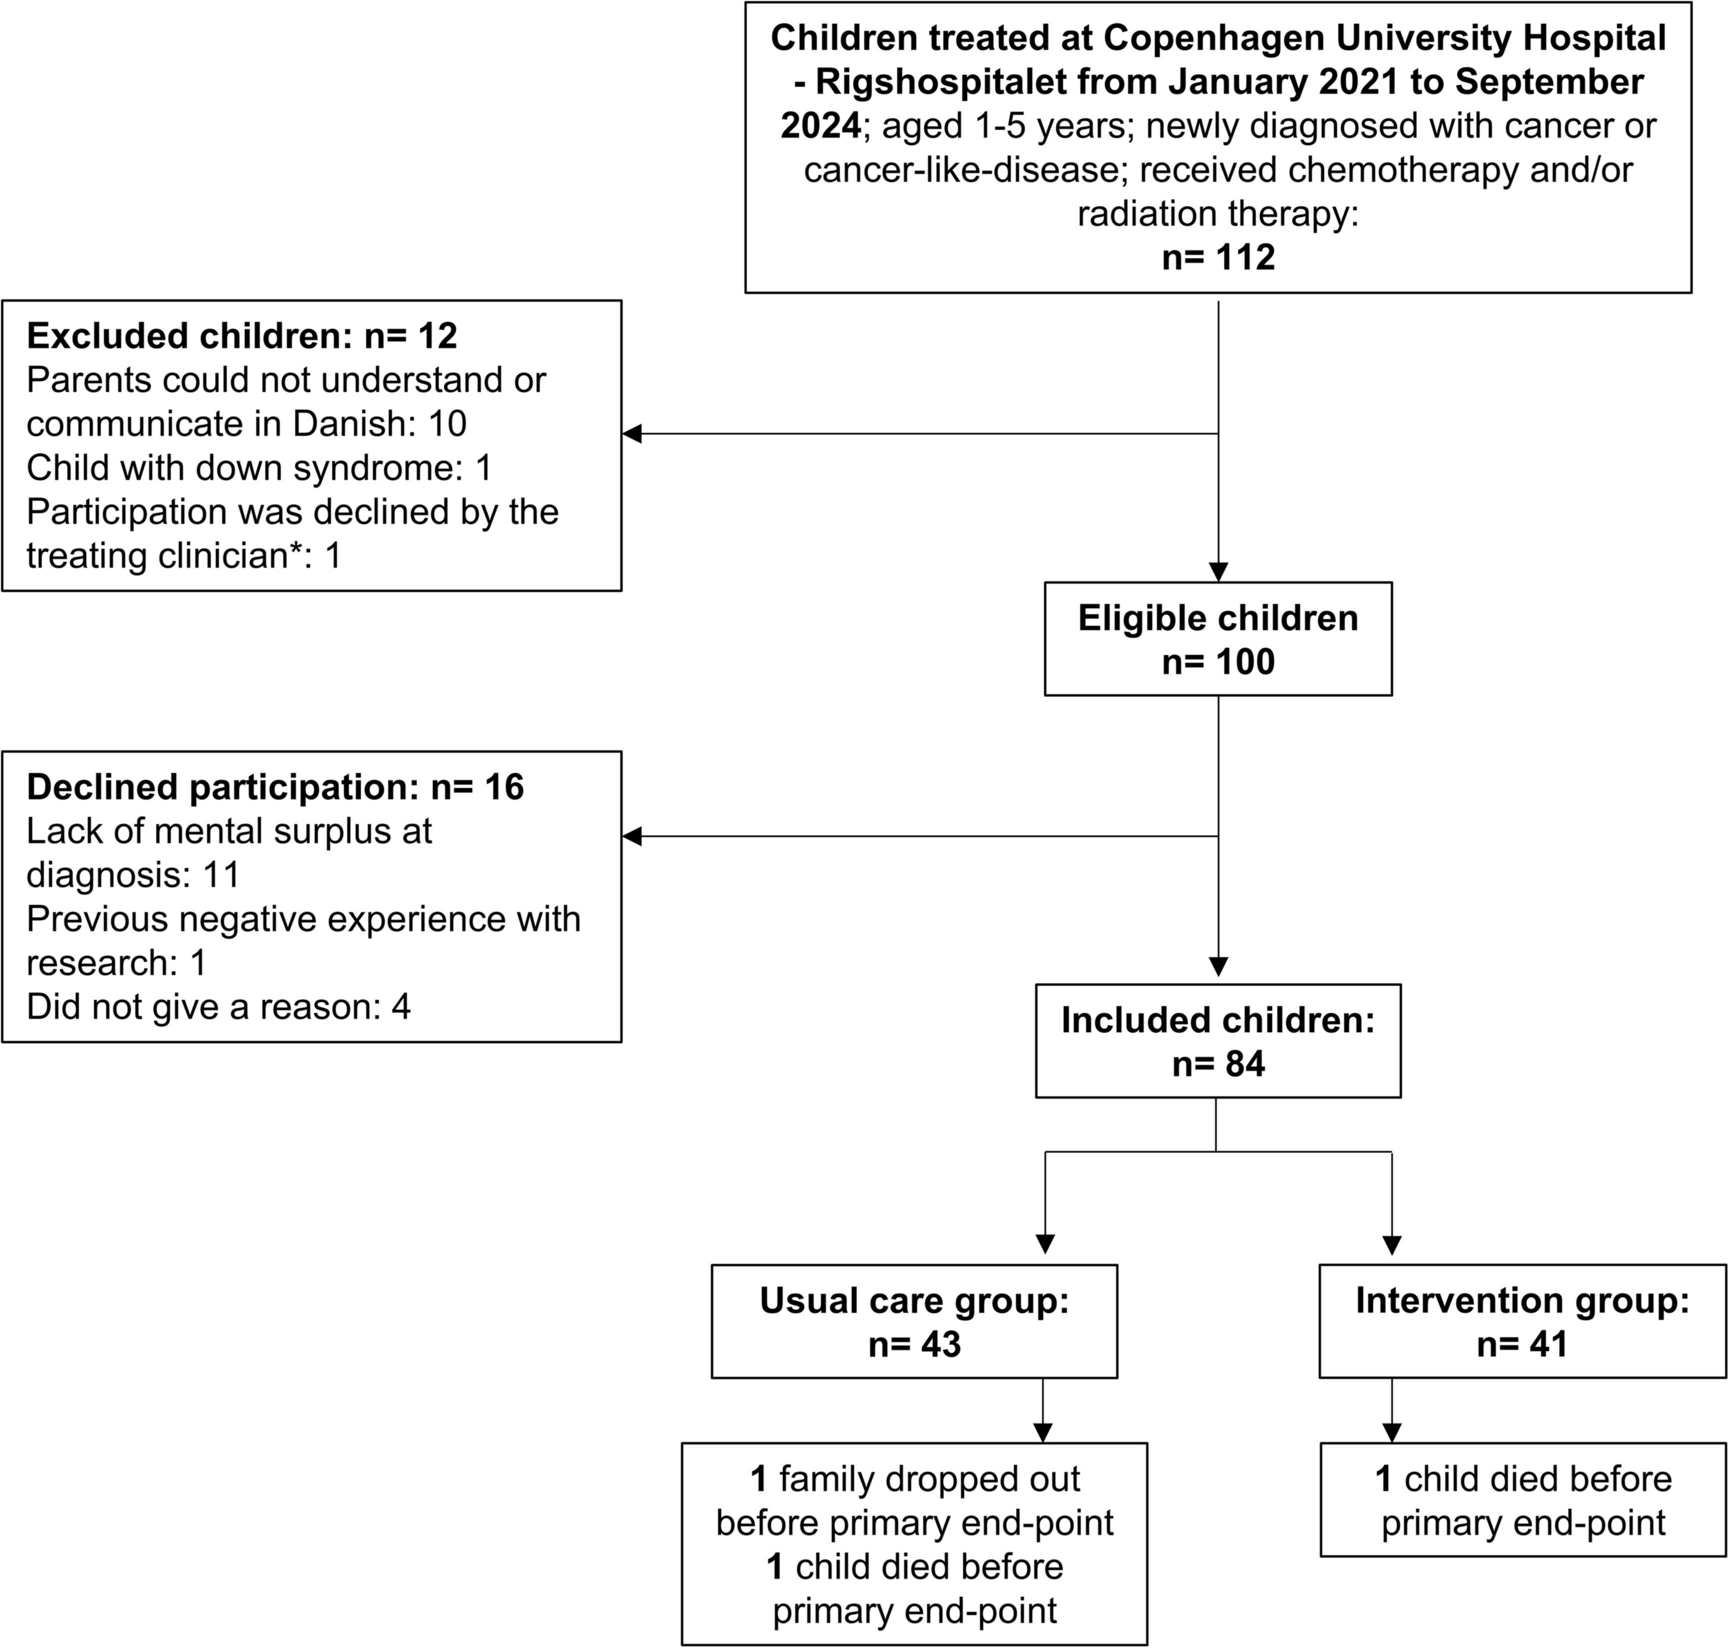
Fig. 2
Flow chart of the study participants
MeasurementParental perception of children’s weightParental weight perception was evaluated using the question [18], “How would you describe your child’s weight?” Responses were recorded on a 5-point Likert scale, ranging from 1 (very underweight) to 5 (very overweight). For analysis, the responses were recategorized into three groups: underweight (≤ 2), normal weight (= 3), and OWOB (≥ 4). This recoding was necessary due to the very small number of participants selecting the extreme options (e.g., “very underweight,” n = 10; “very overweight,” n = 0), which limited the feasibility of using all five original categories.
Parental non-responsive feeding practicesParental non-responsive feeding practices over the past month were evaluated using the Chinese Preschooler’s Caregivers’ Feeding Behavior Scale (CPCFBS) [19] and the Chinese version of the Child Feeding Questionnaire (C-CFQ) [20]. The two scales were utilized to evaluate three non-responsive feeding practices: restrictive feeding, food as a reward, and pressure to eat. Restrictive feeding was assessed using four items that measured strict limitations on children’s access to or consumption of unhealthy foods. Food as a reward was evaluated with two items addressing the use of desired foods to regulate children’s eating or behavior. Pressure to eat was captured by four items focusing on insistence, demands, or physical struggles to encourage children to consume more food. Each item was framed to reflect the frequency of the practice, with response options ranging from 1 (never) to 5 (always). Subscale scores were calculated as the mean of all items within each respective subscale. In this study, Cronbach’s alpha for restrictive feeding, food as a reward, and pressure to eat was 0.752, 0.628, and 0.727 at baseline (T1) and 0.807, 0.561, and 0.773 at follow-up (T2), respectively.
Children’s actual weightThe child’s weight (kg) and height (cm) were measured by trained healthcare professionals at the community hospital’s child health unit. Based on WHO guidelines [21], the BMI-for-age z-score (BAZ) was calculated using WHO Anthro software for children aged 2 to 5 years and the Young Growth Curve for those aged 5 to 6 years. BAZ values were classified into three categories: underweight (z-score < –2), normal weight (–2 ≤ z-score ≤ 1), and OWOB (z-score > 1).
Demographic and family-related variablesDemographic and family-related variables were collected through a self-reported questionnaire, which included the child’s birth date, sex, main caregiver identity, parental age, weight, height, education level, grandparent-parent parenting, number of children, and annual household income. Parental body mass index (BMI) was calculated as weight (kg) divided by height squared (m2).
Statistical methodAnalyses were conducted separately for boys and girls because previous research has found sex differences in parental weight perception and non-responsive feeding practices [7]. All statistical analyses were conducted using SPSS Statistical software version 24.0. Statistical significance was set at α = 0.05 (two-tailed).
The multiple imputation with chained equations (MICE) was used to impute missing values. The Harman single-factor test assessed common method bias, revealing six factors with eigenvalues greater than 1. The first factor accounted for 28.1% of the variance, below the 40% threshold, indicating no significant common method bias in the data.
Continuous variables were assessed for normality using histograms and Q-Q plots and were described using mean and standard deviation (SD). Categorical variables were summarized as counts and percentages. Independent samples t-tests and Chi-square tests were used to compare continuous and categorical variables, respectively, between boys and girls.
Generalized estimating equations (GEE) were used to examine the longitudinal associations between parental weight perception at baseline and non-responsive feeding practices at follow-up. Parental weight perception was included in the model as dummy variables, using “normal weight perception” as the reference category. Sex, parental weight perception, and their interaction terms (sex × parental weight perception) were simultaneously entered into the models to test whether child sex moderated the associations.
To test whether these associations varied by child sex, we created an interaction term between parental weight perception and sex and included it in the GEE models based on the total sample. Additionally, multicollinearity was assessed for all independent variables before model fitting. If the interaction term was not statistically significant, we also performed sex-stratified analyses to explore potential sex-specific trends.
Comments (0)