
Remember me

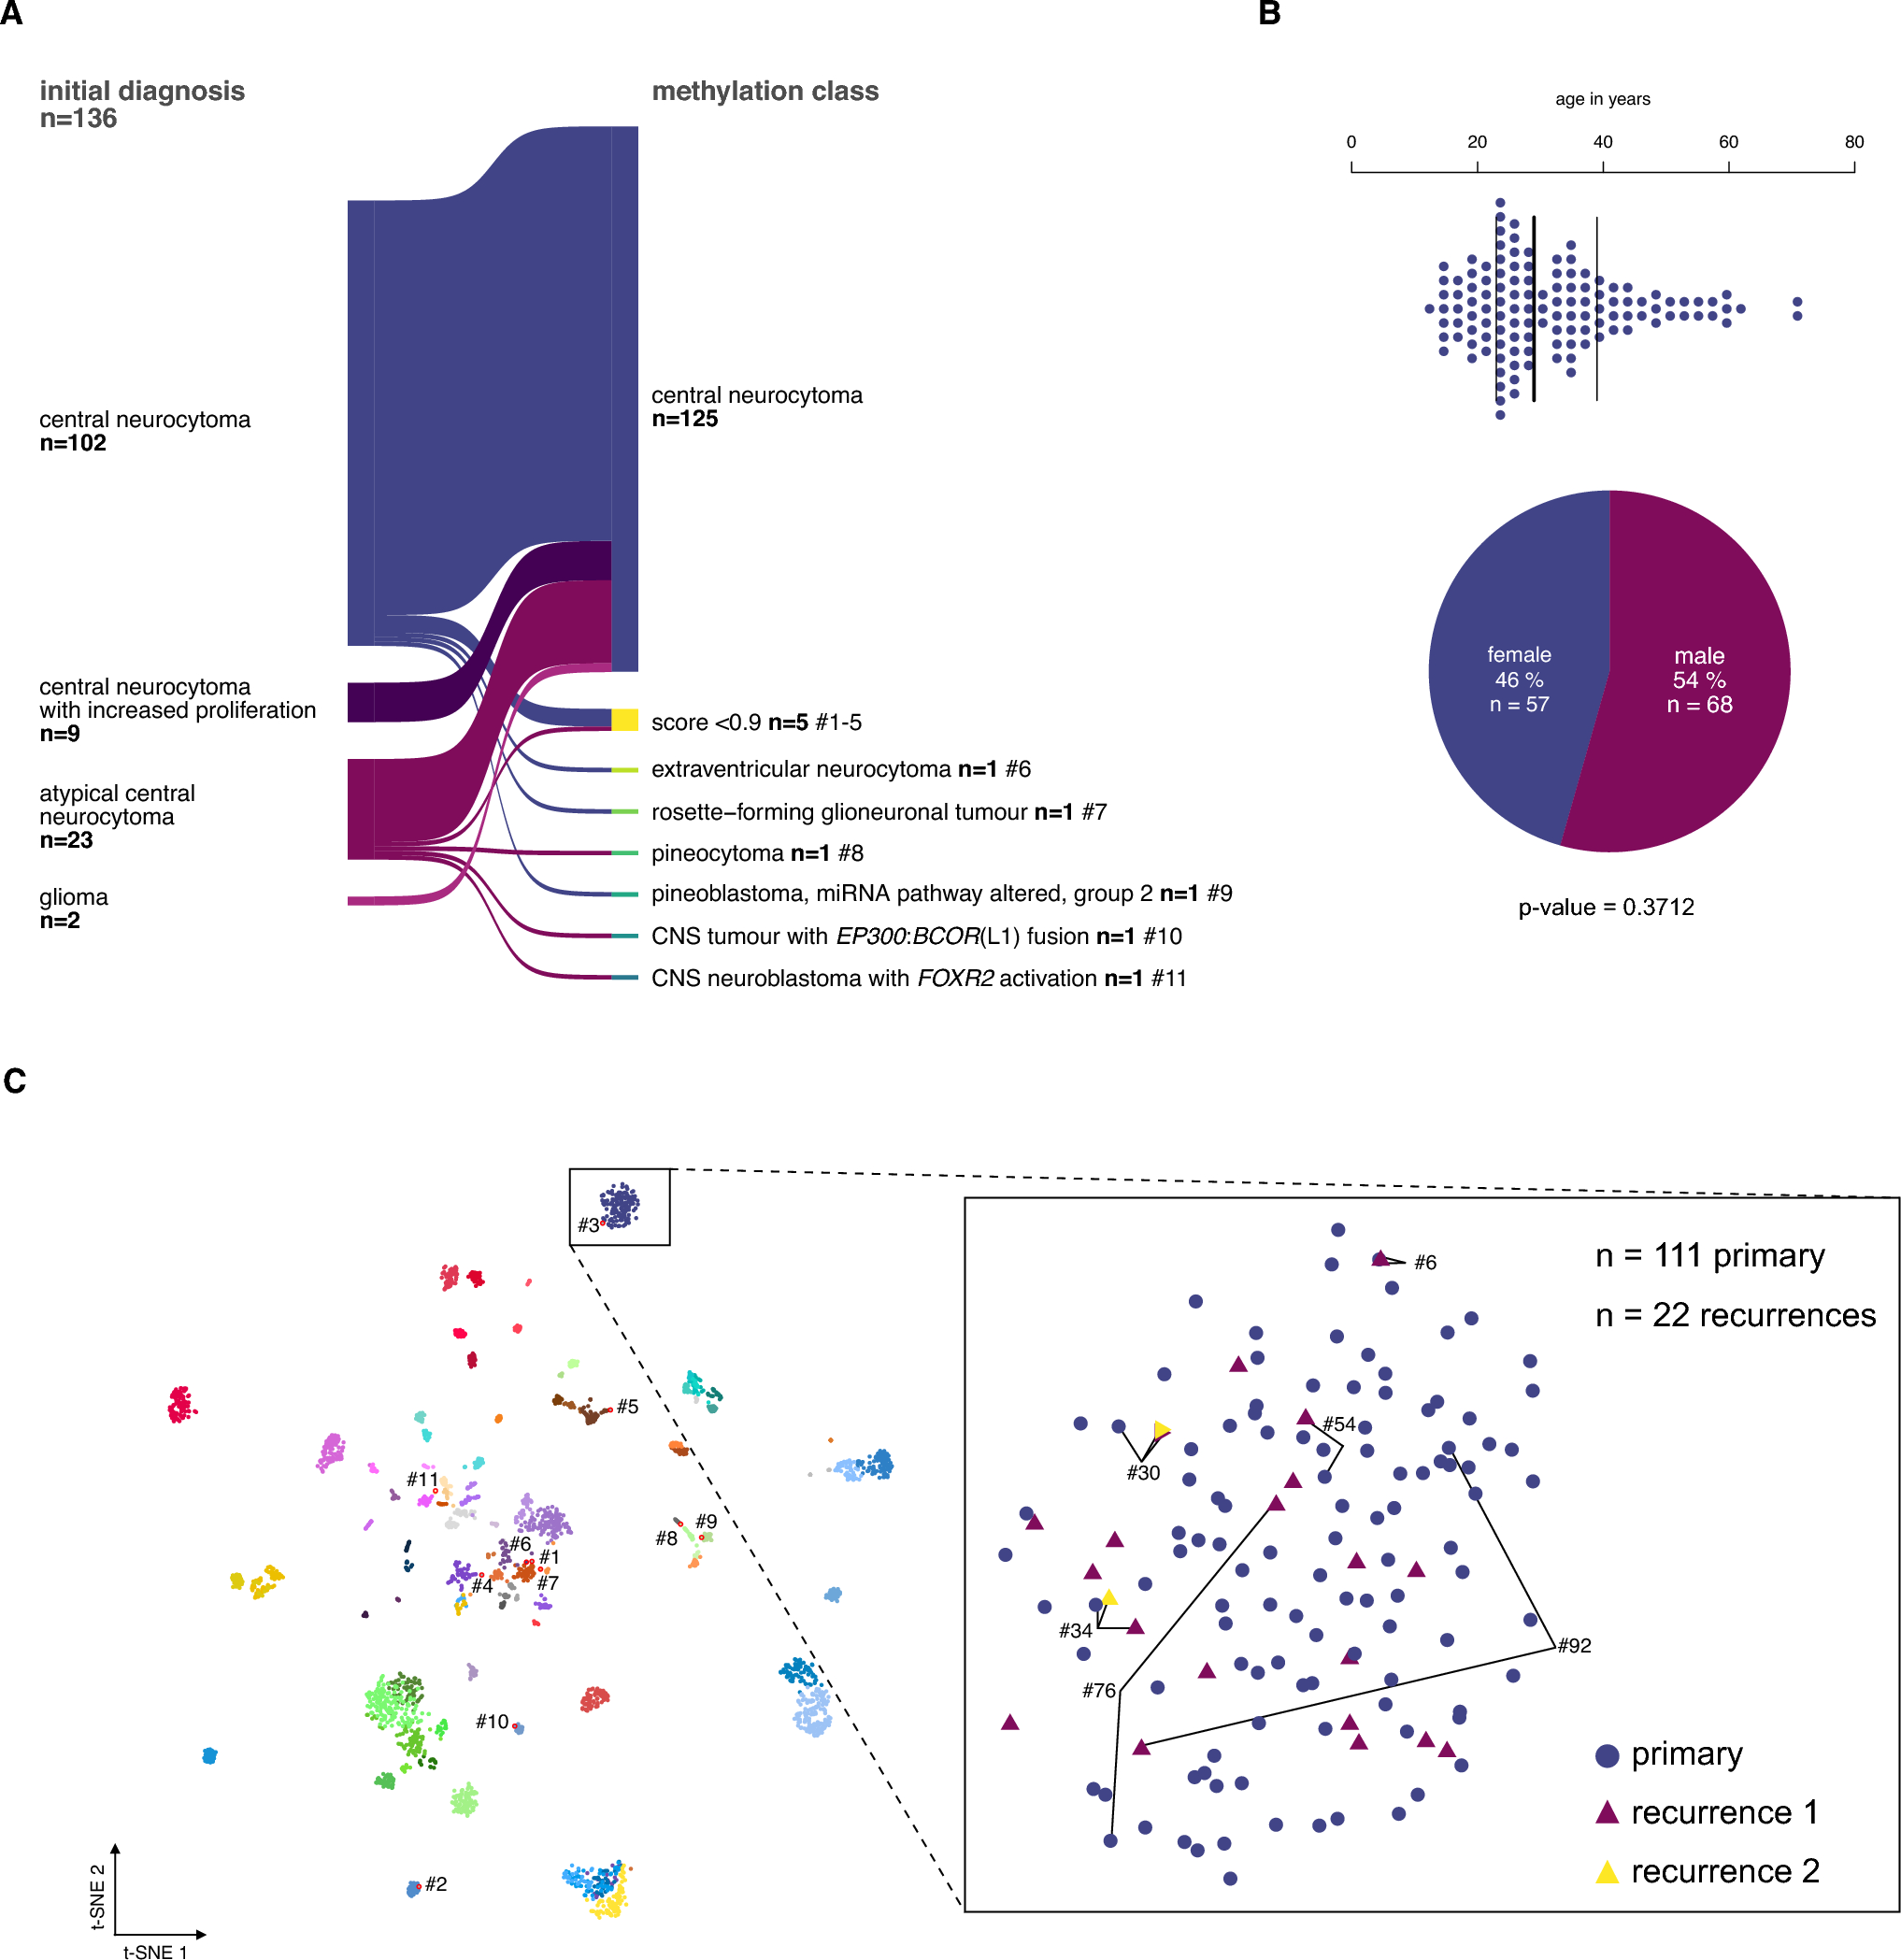


The study included 136 tumor samples, of which 134 were histologically diagnosed as CN (including the cohort from Capper et al. [5]) plus 2 samples initially classified as glioma but reclassified as CN after integrated diagnosis (Fig. 1A). Using the v12.8 Heidelberg Brain Tumor Classifier, CN diagnosis was confirmed in 125 of 136 cases (92%). Eleven samples were assigned to another methylation class with a high confidence score (extraventricular neurocytoma, rosette-forming glioneuronal tumor, pineocytoma, pineoblastoma, CNS tumor with EP300::BCOR(L1) fusion, and CNS neuroblastoma with FOXR2 activation) or yielded low prediction scores (n = 5; Fig. 3A, Supplementary Table 1).
Fig. 1
Study cohort selection of the central neurocytoma based on DNA methylation analysis. A The DNA methylation profiles of 134 patients with the histopathological diagnosis of CN and two gliomas were analyzed using the Heidelberg Brain Tumor Classifier v12.8 to exclude misdiagnoses. Six cases fell into other methylation classes, and 5 did not yield a sufficient classifier score (< 0.9). B The median age at diagnosis of the remaining cases was 29 years (n = 123, NA n = 3). The sex distribution was equal. C In the t-distributed stochastic neighbor embedding (t-SNE) representation, 111 primary and 22 recurrent CNs, including six matched pairs, formed a distinct group separate from other methylation classes of the reference data set from Capper et al. 2018. Cases that have been excluded based on the brain tumor classifier result (red outlines) mapped mostly to other groups, except for one case (#3), which had a prediction score < 0.9 and localized adjacent to the CN group (for consistency excluded from further analyses)
The epigenetically confirmed CN cohort (125 cases) comprised 111 primary and 22 recurrent samples (of which 8 were matched with primary samples in this series, including 2 samples from the second recurrence). Within this epigenetically validated cohort, the median patient age at initial diagnosis was 29 years (range: 12–72 years, Fig. 1B), and distribution among sexes was equal (female = 57, male = 68: p-value = 0.3712; Fig. 1B).
Upon t-distributed stochastic neighbor embedding (t-SNE) of all samples with reference data from Capper et al. 2018, primary and recurrent CN cases formed a distinct group (Fig. 1C). Cases excluded from the CN group mapped to other methylation classes, except for one low prediction score case (case #3) localized adjacent to the CN group. Notably, matched primary and recurrent CN samples maintained their methylation class assignment over time and clustered closely in t-SNE space (Fig. 1C, inlet).
Clinical characteristics of epigenetically validated CNsThe majority of tumors arose in one of the lateral ventricles (69/110, 63%) and involvement of more than one ventricle was observed in 25% (28/110) of cases (Table 1). Hydrocephalus was present in 38% of patients (24/64) at initial MRI, and one patient exhibited leptomeningeal tumor dissemination. Contrast enhancement was reported in 86% (43/50) of cases.
Table 1 Patient characteristicsGTR was achieved in 46/80 cases (58%), while in 34/80 cases only STR was feasible. aRT was administered in 24/77 patients (31%), predominantly following STR (17/24), though seven patients received aRT after GTR.
Tumor progression was observed in 35/96 patients (37%), with four patients experiencing multiple recurrences. Follow-up data was available for 93/125 patients (74%), and there were no significant differences regarding age, sex, tumor location, radiological characteristics, treatment regimens, and prognostic events between the entire cohort and the subset with available clinical outcome information (Table 1). The median time to tumor recurrence was 30 months (n = 32), with a median follow-up time of 69 months (range 1–357 months, n = 93). One patient died during the follow-up period, though the specific cause of death was not recorded.
Albeit this comparison does not consider observation time, patients experiencing recurrence had a significantly younger age at diagnosis (median age 23.5 years vs 34 years; Mann-Whitney-U-test: W = 1451.5, p-value = 0.0001). These patients were also less likely to have received aRT after initial resection (3/25 vs 21/50, p = 0.0093). Patients with recurrence did not differ from patients without recurrence concerning location, radiological characteristics, and EOR (Table 1).
Differentiation of CNs using atypia criteria lacks prognostic significanceWe centrally reviewed the histological features of 89 primary tumors and observed necrosis in 5/89, vascular proliferation in 9/89, and brisk mitotic activity (≥ 1.5 mitoses/mm2) in 19/89 cases (average 0.834 mitoses/mm2; range 0—4.202 mitoses/mm2). One-third of the cases showed intratumoral calcifications (30/89, NA = 35). Necrosis, vascular proliferation, and tumor calcifications individually were also not associated with outcome (Supplementary Table 2 and Supplementary Fig. 1A, C). We stratified the cohort based on the presence of at least one atypical feature cohort into 65 classical CN (cCN) and 24 atypical CN (aCN). However, there was no significant difference in progression-free survival (PFS) between cCN and aCN (Supplementary Fig. 1E, p = 0.46, Supplementary Table 2). We also tested whether stratification could be achieved based on the presence of two atypia criteria, which similarly yielded non-significant results (Supplementary Fig. 1F, Supplementary Table 2).
Centrally reviewed, continuously measured Ki67 index and mitotic count can stratify outcomeGiven that the current WHO classification highlights the ongoing debate regarding optimal cutoffs for Ki67 and mitotic counts, we evaluated thresholds of > 2–4% for both global and focal Ki67 within the centrally reviewed subcohort. Global and focal Ki67 values > 2%, as well as focal Ki67 > 3%, were significantly associated with differences in PFS (Supplementary Fig. 2A, Supplementary Table 2).
Similarly, we assessed various cutoffs for mitotic count and identified several thresholds associated with PFS differences in centrally reviewed cases (Supplementary Fig. 4A, B). As the dichotomization of continuous measurements is methodically questionable, we additionally analyzed global/focal Ki67 and mitotic count as continuous variables. All three continuous measures were significantly associated with PFS (Supplementary Figs. 2B, C, 4C). In contrast, neither necrosis nor vascular proliferation demonstrated a significant association with PFS (Supplementary Fig. 1B, D).
Histological stratification criteria suffer from low reproducibility and prognostic value across multiple raters and laboratoriesFollowingly, we investigated inter-rater reliability for histological features. Among eight neuropathologists assessing 30 CN cases, agreement was low for necrosis (α = 0.14, range: −0.2 – 0.65, Supplementary Fig. 1B) and vascular proliferation (α = 0.19, range −0.28–1, Supplementary Fig. 1D). Neither necrosis nor vascular proliferation exhibited PFS stratification potential (Supplementary Fig. 1B, D).
Reliability of the Ki67 index assessment by eight neuropathologists was moderate to poor. Total Ki67 showed an ICC3 of 0.55 (Supplementary Fig. 3C), while focal Ki67 had an ICC3 of 0.5 (Supplementary Fig. 3D). Individual raters largely disagreed when estimating the total and focal Ki67 (Krippendorff’s alpha (α) range: −0.3–0.77 and 0.16–0.81); surprisingly, even if raters agreed on a Ki67 hotspot area, their estimations often varied substantially (Supplementary Fig. 3E). Ki67 indices varied across cases, with overall Ki67 ranging from < 1% to 6% (median 2%) and focal Ki67 from < 1% to 12% (median 3%). Across multiple raters, no consistent cutoff for global or focal Ki67 was able to stratify PFS (Supplementary Fig. 3A). Continuous evaluation of global Ki67 stratified PFS in only one rater (rater 1–central reviewer), while focal Ki67 failed to stratify PFS across all raters (Supplementary Fig. 3B).
We assessed inter-laboratory variability in Ki67 staining protocols across six neuropathological centers using serial sections from seven cases. Staining intensity varied markedly between institutions (Supplementary Fig. 3F). To evaluate the diagnostic impact of this variability, we manually counted Ki67-positive cells in a standardized and matched region of 0.1 mm2 (Supplementary Fig. 3F, red inset) and applied 2% and 3% cutoffs (as these were significantly associated with PFS in central review) to classify patients into CN with increased proliferation index (iCN). Staining differences led to discordant classification into cCN and iCN in 4/7 cases for both cutoffs (Supplementary Fig. 3G).
Similarly, the range of mitotic counts was high among five raters (Supplementary Fig. 4D) with low inter-rater agreement (α range: −0.03 – 0.65, ICC3 = 0.38, Supplementary Fig. 4E). For mitotic count, two common cutoffs (≥ 1.5/mm2 and ≥ 1.9/mm2) were associated with PFS differences in only two out of five raters (Supplementary Fig. 4F). Similarly, continuous mitotic count measurements stratified PFS in two raters but not in the remaining three (Supplementary Fig. 4G).
As the histopathological stratification with Ki67, mitotic count, and other atypical features demonstrated poor reproducibility, we did not include them in further survival analysis.
Adjuvant radiation is associated with improved outcome in subtotally resected patientsUnivariate PFS analysis in epigenetically defined CNs confirmed that the EOR is significantly associated with outcome. Patients undergoing GTR had longer PFS than those with initial STR (NA vs 55 months, p = 0.049, Fig. 2A). Additionally, patients who received aRT showed improved PFS (Fig. 2B, p = 0.019).
Fig. 2
Adjuvant radiotherapy is assocatiated with lower recurrence risk in subtotally resected patients. A-B Gross total resection (GTR; p = 0.047) and adjuvant radiation therapy (aRT, p = 0.019) are significantly associated with better outcome in CN patients. C-D However, the advantage of adjuvant radiation was limited to patients with a subtotal resection (STR group, p = 0.0001), with no significant effect on PFS for GTR patients (p = 0.37)
Interestingly, aRT did not significantly prolong PFS in patients with GTR (Fig. 2C, p = 0.37), although only seven patients received aRT following GTR. In contrast, aRT was associated with longer PFS in STR patients (23.5 vs. NA months, no median survival as the survival function does not reach 0.5, p = 0.0001, Fig. 2D). Radiological characteristics such as tumor location (uni- vs. multilocular), contrast enhancement (yes vs. no), and the presence of hydrocephalus were not associated with prognosis in Kaplan–Meier or Cox proportional hazard analyses (Supplementary Table 2). The potential effect of primary and residual tumor size on recurrence and the therapy side effects were not evaluated due to absent clinical data.
No evidence of relevant epigenetic subgroups, chromosomal or genetic alterations associated with outcome in CNWe investigated the potential impact of DNA methylation patterns, chromosomal alterations, and genetic mutations on patient outcomes. Consensus clustering of DNA methylation data from n = 111 primary tumors with top 1 000, 2 000, 5 000 CpG sites revealed a stable partitioning (1-PAC 0.971, SD:mclust k = 2) with 2 subgroups (Supplementary Fig. 5A). However, one of the two groups consisted only of four cases (#19, #65, #96, #98) which did not show distinct clinical or molecular characteristics. Similarly, expanding to the top 10 000, 20 000, and 50 000 CpG sites, we did not find a partitioning with a 1-PAC > 0.9 (Supplementary Fig. 5B). Consensus clustering including recurrent cases only revealed small patient-specific subgroups, suggesting rather unspecific subclusters instead of robust epigenetic subtypes (Supplementary Fig. 5C, D). Thus, CN represent an epigenetically coherent molecular group of tumors, with no evidence of distinct epigenetic subgroups.
Most copy number profiles inferred from methylation data were balanced (119/133 samples), with 11 samples (11/133, 9%) showing individual chromosomal alterations. The most common alteration was gain of chromosome 5 (n = 4/125; 3%; Supplementary Fig. 6D, F, H, I). The 11 samples with chromosomal alterations were comprised of seven primary and four recurrent cases. DNA methylation data for both primary and recurrent tumors was available in six cases. One case developed a partial chromosome 17 gain in the recurrent tumor (Supplementary Fig. 6G), while no copy number changes occurred in the other pairs. We did not see a prognostic association of CNV-altered cases versus CN with balanced CNV profiles (p = 0.51; Supplementary Fig. 6M) or the total CNV load (Cox model p = 0.25, based on 75 cases, Supplementary Table 2) in CN. The MGMT promoter was unmethylated in nearly all primary (110/111; 99%) and recurrent tumors (21/22; 95%).
To identify pathogenic variants in CN, we performed whole-exome sequencing of 12 CN cases. Mean exome coverage was 109X (range 21–235X) and a median of 12 mutations (range 5—22) were detected per case (Supplementary Table 3). Only a fraction of these mutations was classified as “(likely) pathogenic” (median 3, range 1–5) according to ACMG criteria. In 3/12 cases, we found a “likely pathogenic” BCR frameshift mutation (present in both splice variants: NM_021574 exon 18: c.3146_3147 insCCGG, p.V1050Rfs*17 and NM_004327 exon 19: c.3278_3279 insCCGG, p.V1094Rfs*17; variant allele frequencies: 17%, 20%, and 35%). Two of the three cases (#6, #13) with a BCR mutation developed a recurrence, and case #24 had no evidence of recurrence after 34 months.
CN demonstrate global hypomethylation, age-dependent methylation and FGFR3 demethylationCN primary tumors exhibit significantly lower mean DNA methylation compared to pooled control samples as previously reported [9] (n = 30: white matter n = 9, cerebellum n = 8, hemisphere n = 13; t-test: t = 19.349, p-value ≤ 0.001), and hypomethylation affected methylated regions across the genome (Supplementary Fig. 7A). Overall, we found a drastic global methylation change with 108 790 differentially methylated sites (32% of all sites) in 16 251 genes (79% of all genes, Benjamini–Hochberg adj. p-value < 0.001). Around 18.5% of these sites showed higher methylation levels, while the majority of 81.5% showed decreased methylation (Supplementary Table 4). Among these sites, 35 663 sites (11% gain -, 89% loss of methylation, 45% of all genes) had a noticeable effect size (absolute log2 fold change > 0.2). Affected genes were enriched in RHO GTPase cycle, extracellular matrix organization, NTRK signaling, and PI3K/AKT pathways (over-representation analysis, supplementary Fig. 7B). Furthermore, we tested whether age influenced methylation, revealing 7 256 sites in 2 932 genes (adj. p-value < 0.1). To filter tumor-unrelated, age-dependent sites, these results were intersected with cortex data from Kozlenkov et al. [21] revealing that 4% sites and 35% genes were not specific for CN. The remaining 2 631 sites in 1 905 genes showed enrichment for neuronal system, extracellular matrix organization, and RAF/MAPK signaling (Supplementary Fig. 7C, Supplementary Table 5). Global methylation was not correlated with age (Supplementary Fig. 7D).
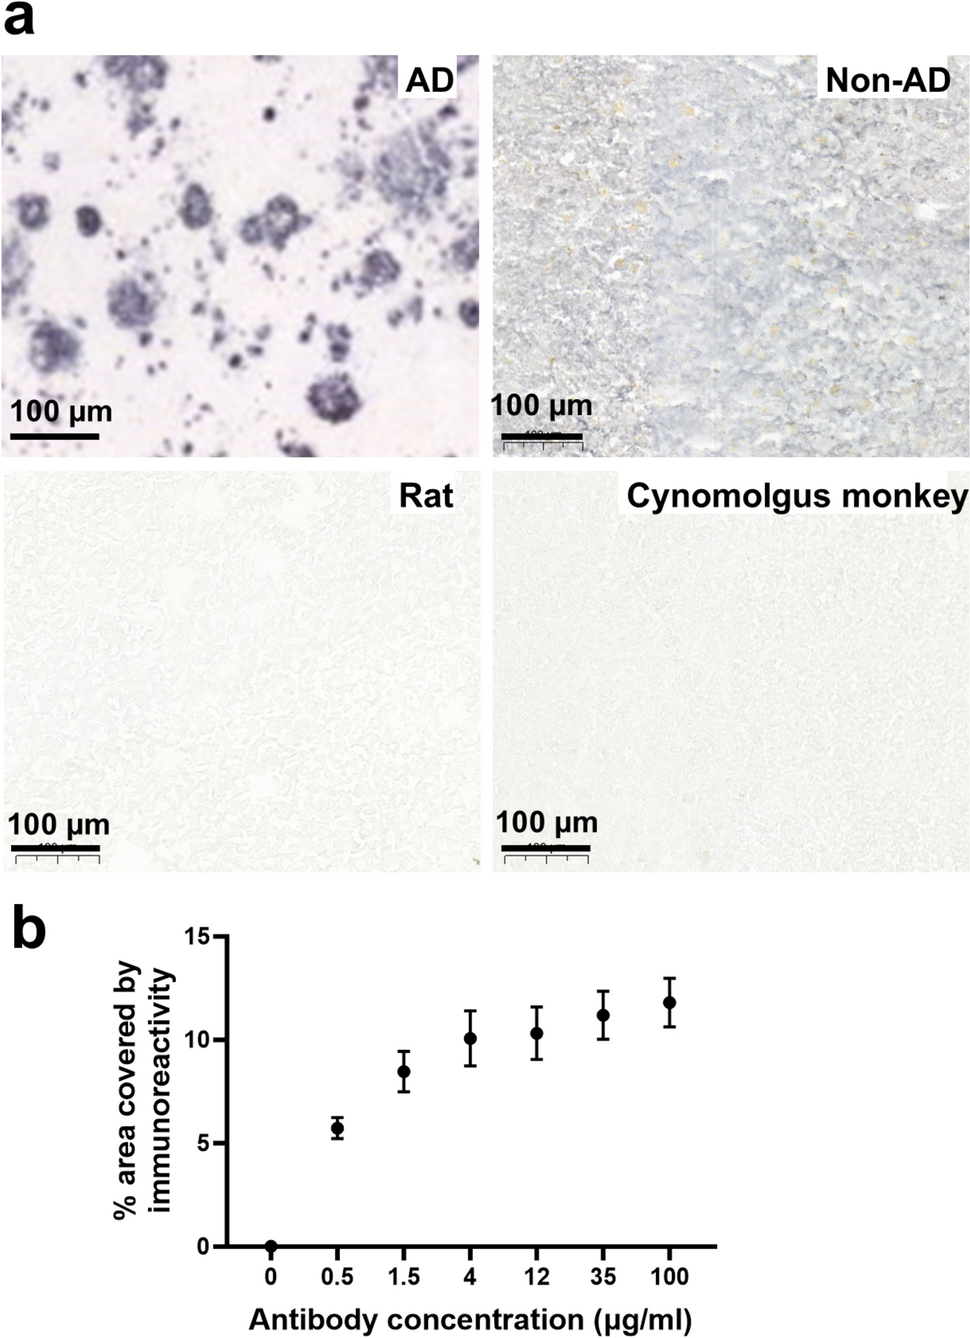
As recently described in a small pilot series based on methyl-seq data, FGFR3 was found to be among the most differentially methylated genes with 76% of the CpGs being hypomethylated in CN [22]. Compared to normal tissue, we noticed a significant DNA demethylation in 31/36 sites of FGFR3, mostly located in the gene body (Fig. 3A). However, individual sites described as CN-characteristic by Lee et al. [22] displayed high variance within our cohort. Hypomethylation of FGFR3 remained constant between primary and recurrent tumors (Fig. 3F). Immunohistochemical staining against FGFR3 was performed in 73 cases and, importantly, overexpression of FGFR3 could be verified in 97% (71/73) of cases compared to a negative staining in normal CNS tissue (n = 5) and in glioblastoma, IDH-wildtype, without FGFR3::TACC3 fusion (n = 24; data not shown). The staining intensity was moderate in 41/71 cases (58%; Fig. 3B) and strong in 30/71 cases (42%; Fig. 3C). We encountered common staining artifacts such as a lack of FGFR3 staining in thermally altered tissue areas as well as a gradual increase in staining intensity towards tissue edges, likely due to inadequate fixation (Supplementary Fig. 3D). We did not observe significant survival differences in cases with moderate or strong staining intensity (Fig. 3E).
Fig. 3
FGFR3 gene body hypomethylation and FGFR3 overexpression are characteristic for CN. A Clustering the methylation values of the FGFR3 locus of primary tumors and control tissue from Capper et al. 2018 revealed severe hypomethylation at the gene body as a distinct feature of CN. However, individual FGFR3 CpG sites, especially three sites denoted as CN specific in a previous study by Lee et al. 2024 showed high variance. FGFR3 methylation levels did not correspond to FGFR3 staining intensity. B-C FGFR3 staining intensity ranged from strong in 30/71 (42%) cases to intermediate in 41/71 (58%) cases. D FGFR3 immunohistochemistry often demonstrated a gradient effect with stronger staining intensity at the periphery with progressively weaker staining towards the center due to a fixation artifact. E Kaplan-Meier estimates did not show a significant PFS difference between cases with strong (+ +) and intermediate (+) staining intensity. F FGFR3 demethylation was consistent across primary and recurrent samples and did not show any association with sample material, the development of a recurrence, or age
Predicting recurrence in CN: risk group definitionTo identify factors that are associated with tumor recurrence, patients with primary tumors and available follow-up data were stratified into two risk groups. Patients who had experienced tumor recurrence were categorized as the high-risk group (Fig. 4A). Notably, most recurrences occurred around 24 months post-diagnosis. To define the low-risk group, patients with an observation period of less than 24 months were excluded to minimize bias from short follow-up durations. The resulting cohort of 64 cases had balanced observation times in the high-risk group (n = 21 with recurrence) and the low-risk group (n = 43 without recurrence; Supplementary Fig. 8A, Supplementary Table 6).
Fig. 4
Lower DNA methylation and younger age predict recurrence. A Definition of risk groups based on recurrence and observation time. B-C The high-risk group was characterized by a significantly younger mean age and young age increases progression risk (P.H. – proportional hazard). Dashed lines indicate PFS probability bounds at the study’s endpoint. D-E Mean methylation was significantly decreased across the genome in the high-risk group, and low DNA methylation is a predictor for progression. F From a non-interventionist perspective, we first model PFS using mean methylation, age, EOR, and aRT. G Followingly, we remove mean methylation as it is not a significant predictor and observe no drastic change in the estimation of coefficients. H Visualization of the reduced model in a nomogram with an example calculation
High-risk CNs are characterized by decreased global methylation and lower age at diagnosisJoint consensus partitioning of DNA methylation from both risk groups did yield two stable subgroups, albeit with only low sample numbers per class that did not reflect any risk group (Supplementary Table 7). While low-risk and high-risk tumors did not differ at any specific DNA methylation site (including the FGFR3 locus, Supplementary Fig. 8C), comparing mean methylation in both groups yielded a significantly reduced global methylation in the high-risk group (global beta value 0.4226 vs. 0.4302, t-test: p-value = 0.0097, Fig. 4D). Attempts to classify the groups using a Support Vector Machine failed to achieve separation (balanced accuracy: 0.5).
Age differences between risk groups were notable, with the low-risk group displaying a significantly higher mean age (29 vs. 27 years, W = 396, p = 0.0018, Fig. 4B, Supplementary Table 6). However, no correlation was observed between age and mean methylation levels (Supplementary Fig. 8B). Only one CpG site with age-dependent methylation was identified within the risk groups, and testing for an interactive effect of age and risk group yielded just two significant sites (Supplementary Table 8).
To further explore the relationship between (chronological) age and DNA methylation, we applied three epigenetic clocks [14, 15, 33] that estimate the DNA methylation-based age (DNAm age) using a linear combination of CpG sites. All clocks showed moderate accuracy in predicting chronological age (Supplementary Fig. 9A, D, G). Only the modified “Skin and Blood” Horvath Clock detected the age difference between risk groups (Supplementary Fig. 9B, E, H). Testing for DNAm age acceleration (residuals of predicted age vs. chronological age) revealed no significant differences between risk groups for any of the clocks (Supplementary Fig. 9C, F, I).
Integrated model to predict progressionGiven the observed differences in mean DNA methylation and age between risk groups, we employed univariate Cox regression analysis across the entire cohort of high- and low-risk cases (n = 64; Fig. 4A), identifying both factors as significant independent predictors of PFS (Fig. 4C, E). We then investigated whether age or mean DNA methylation could refine PFS predictions when the EOR was accounted for. In additive models with EOR, both age and mean DNA methylation individually showed borderline non-significant effects (Supplementary Fig. 8E, J). No interaction effect was observed between age and EOR or between DNA methylation and EOR (Supplementary Fig. 8F, K).
aRT was significantly more common in STR patients (11/23, aRT) than in GTR patients (5/31 aRT; p = 0.0167). Using GTR without aRT as the reference, we found age significantly predicted PFS across all treatment regimens. STR without aRT significantly increased the hazard compared to GTR without aRT (Supplementary Fig. 8M). However, no progression events occurred in the 5 cases that received aRT after GTR, precluding hazard ratio estimation. STR followed by aRT did not significantly differ from GTR without aRT (p-value = 0.231, HR = 0.28, SE 0.034–2.3). Mean DNA methylation values failed to show a significant effect when considering the entire treatment regimen (Supplementary Fig. 8H).
To provide patient-specific PFS estimates, we developed a multivariate model incorporating all covariates (full integrative model, Fig. 4F). In this model, DNA methylation was not predictive, while age, EOR, and aRT remained significant predictors. Removing mean methylation, which was not significant, did not alter coefficient estimates substantially (reduced integrative model, Fig. 4G). We found the model well-calibrated at 3 and 5 years and validated the predictors internally using repeated cross-validation (Supplementary Fig. 10). The reduced model was visualized in a nomogram with an example calculation (Fig. 4H). This model is not intended as a treatment recommendation, as our retrospective data cannot exclude confounding variables and only describes associations between PFS and clinical variables. Validation in prospective studies is required.
Comments (0)