Patient enrollment and plasma sample collection
In our study, a total of 21 female patients diagnosed with AIS (Type 1) and 20 healthy volunteers were recruited at Chinese People’s Liberation Army General Hospital from January 2020 to June 2021. Cobb angle was calculated based on the X-ray for enrolled AIS patients prior to medical intervention. Subsequently, AIS patients were categorized into two subgroups according to the severity of scoliosis measured by the Cobb's angle. Among them, 11 cases with a Cobb's angle < 40° were defined as follow-up AIS group (undergoing conservative treatment with braces), while the remaining 10 cases with a Cobb’s angle ≥ 40° were defined as surgery AIS group (requiring surgery due to the rapid progression of the scoliosis, larger scoliosis angle or evident deformity). Healthy controls consisted of teenagers visiting our hospital for healthy examinations and were matched in terms of age and sex with AIS patients.
Inclusion criteria: all AIS patients had undergone physical and radiological examination such as X-ray, CT and MRI. The diagnosis of AIS was confirmed by two senior surgeons based on the findings from these examinations. Exclusion criteria: Other types of scoliosis were excluded from our study. Fasting venous blood samples were collected preoperatively from both AIS patients and healthy subjects, followed by centrifugation to obtain plasma which was subsequently stored at −80 °C until further use.
This study was approved by the Ethics Committee of Chinese PLA General Hospital (approval identifier: S2021-003-01) and written informed consent was obtained from all subjects and their parents before participating in this study. The study was performed in accordance with the ethical standards as laid down in the 1964 Declaration of Helsinki and its later amendments or comparable ethical standards.
Isolation of exosome from plasma using TiO2 and identification of exosomeIsolation of exosome
A total of 800 μL plasma was filtered using 0.2 μm syringe filters with a GHP Membrane (PALL Life Sciences, USA) to remove cell debris, apoptotic bodies, and large vesicles. Then the serum sample was mixed with 10 mg TiO2 microspheres and incubated for 5 min at 4 °C on a thermos-shaker to ensure sufficient enrichment. Following three washes with PBS, exosomes were directly lysed from the surface of microspheres to extract the proteins [16].
Transmission electron microscopy
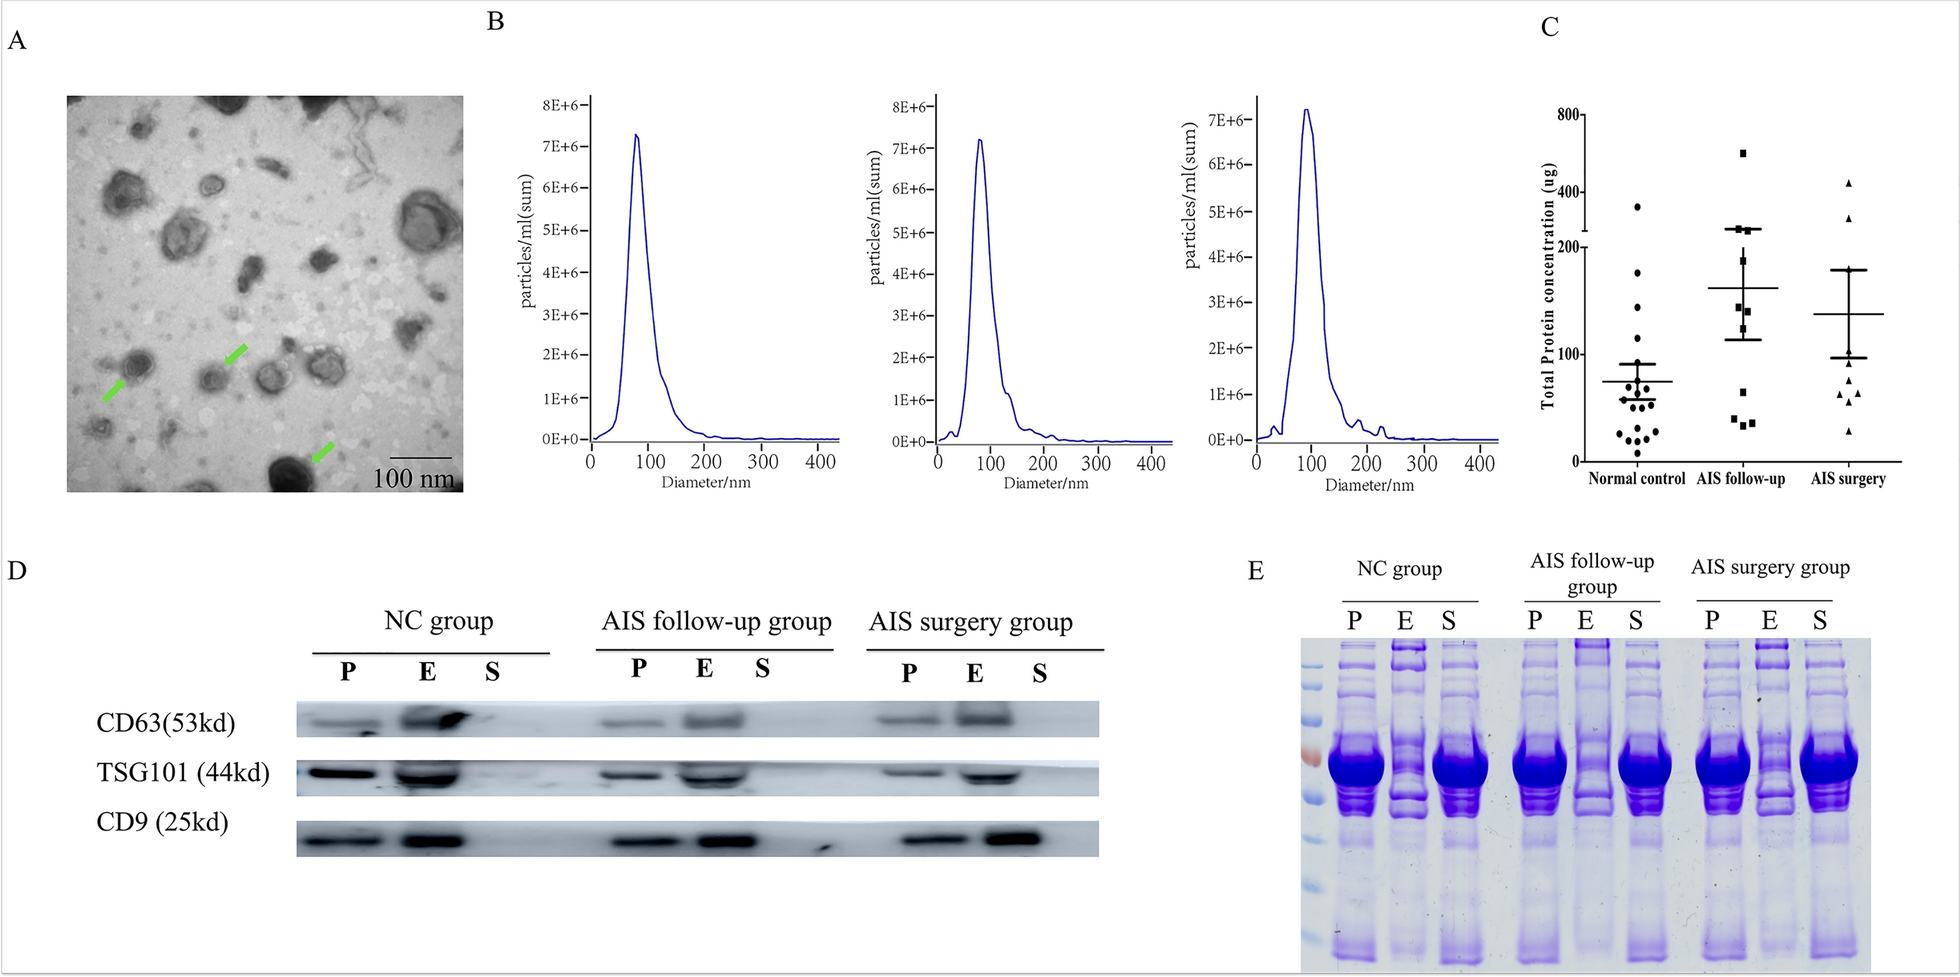
Exosomes in a PBS solution (20 mL) were added onto formvar carbon coated copper grids (200-mesh) and allowed to adsorb to the formvar for 10 min. The excess solution was removed by blotting the edge of each grid with filter paper. Then, the sample was negatively stained with saturated uranyl acetate solution and incubated at room temperature for 1 min. The unevaporated solution was absorbed using filter paper. The samples were examined using a Hitachi h-7650 transmission electron microscope at 80 kV.
ZetaView nanoparticle tracking analysis (NTA)
The size of exosomes was determined by nanoparticle tracking analysis (NTA) using a ZetaView (Particle Metrix, Meerbusch, Germany) and corresponding software ZetaView 8.03.04.01. The ZetaView system was calibrated using 100 nm polystyrene particles. Isolated exosome samples were appropriately diluted using PBS to measure the particle size and concentration. After automated data acquisition of all 11 positions and removal of any outlier positions, NTA measurements were recorded and analyzed.
Western blot analysis
Expression of exosome biomarkers was evaluated by Western blot. Firstly, the protein concentration was calculated with BCA protein assay kit (Beyotime, China) and then denatured by adding “sample buffer” before heat denaturation was performed. The exosome proteins were electrophoresed using 12% sodium dodecyl sulfate polyacrylamide gel electrophoresis (SDS-PAGE) and then electro-transferred to poly-vinylideneuoride (PVDF) membranes (BioRad, USA). The PVDF membranes were blocked for 1 h at room temperature in TBST containing 5% BSA and incubated overnight at 4 °C with the following primary antibodies: anti-CD81 mouse monoclonal antibody (1:2000) (Abcam, Cambridge, UK), anti-CD63 mouse monoclonal antibody (1:2000) (Abcam, Cambridge, UK), anti-TSG101 rabbit polyclonal antibody (1:500) (Proteintech Group, Chicago, USA) and anti-β-actin mouse monoclonal antibody (1:1000) (Solarbio, China). After incubation with appropriate HRP-conjugated secondary antibodies, blots were performed using ECL Western Blotting Substrate Kit (Solarbio, China).
Protein extraction from exosome
All samples were resuspended in “digestion buffer” containing 2% SDS and then vortexed and ultrasonicated on ice for 30 min, followed by centrifugation at 12,000×g at 4 °C for 3 min. The supernatant was collected and filter aided sample preparation (FASP) was performed for digestion. The detailed steps were performed mainly as previously reported [16]. The supernatant was transferred into a spin filter column (30 kDa) and SDS was removed by washing the sample three times with 8 M UA (Urea). After centrifugation at 14000×g at room temperature for 15 min, 200 μl DTT (10 mM) was added and incubated for 4 h. Then 200 μL IAA (50 mM) was added for alkylation at room temperature in the dark for 1 h. Then the buffer was exchanged with 50 mM NH4HCO3 by washing the membrane three times. Free trypsin was added into the protein solution at a ratio of 1:50 and incubated at 37 °C overnight. The tryptic digests were recovered by centrifugation and additional wash with 50 mM NH4HCO3. The obtained solution was vacuum-dried and then adjusted to 10 mL with 0.1% formic acid (FA) before LC–MS/MS analysis. The supernatants were collected, and protein concentration was determined by Nanodrop 2000 (Thermo Fisher Scientific, USA).
Mass spectrometry analysis
The samples were first separated by the nano-grade liquid phase and then analyzed. Data independent acquisition (DIA, Data independent acquisition) was applied as data acquisition method. DIA method firstly established a spectrum library through conventional Data dependent Acquisition (DDA) mass spectrometry detection technology, and then used the DIA method to collect the mass spectrum data of samples. After comparing the DIA data with the DDA spectrum library information, qualitative and quantitative analysis of proteins were acquired.
LC–MS/MS analysis was carried out using an easy nLC-1000 system coupled with a Q Exactive HF mass spectrometer (Thermo Fisher Scientific, USA). The details of the liquid system pre-column and analytical column were as follows: The precolumn was a C18 column, 100 μm × 200 mm, 3 μm (Dr. Maisch GmbH, Germany) and the analysis column was a C18 column, 150 μm × 300 mm, 1.9 μm (Dr. Maisch GmbH, Germany). Mobile phase A was 0.1% FA in water, and mobile phase B was prepared as 0.1% FA in acetonitrile. (ACN). The total flow rate was 600 nL/min and the gradient was performed as the following: 6 to 9% buffer B for 8 min; 9 to 14% buffer B for 16 min; 14 to 30% buffer B for 36 min; 30 to 40% buffer B for 15 min; and 40 to 95% buffer B for 3 min.
Establishment of spectral library used Data dependent Acquisition (DDA) mode with the following condition: With positive ion scanning mode as the scanning method, the scan was set at a resolution of 120,000 @ m/z 200 by orbitrap mass analyzer and maximum injection time of 80 ms. The scan scanning range was 400–1400. The secondary scanning was set at a resolution of 15,000 @ m/z 200, with the fixed first mass of 120 m/z and maximum injection time of 45 ms.
Plasma sample MS data collection used Data independent Acquisition (DIA) mode with the following condition: With positive ion scanning mode as the scanning method, the scan was set at a resolution of 60,000 @ m/z 200 by orbitrap mass analyzer and maximum injection time of 80 ms. The scan scanning range was 400–1200. The secondary scanning was set at a resolution of 30,000 @ m/z 200, with the fixed first mass of 120 m/z and maximum injection time of 45 ms.
Bioinformatics analysis
We used Spectronaut (14.5 200813.47784) as search engine for spectral library establishment and DIA data search for identification of proteins based on MS Data. The detailed parameters for data search through Spectronaut were set as the following. Establishment of library: Uniprot human database (downloaded on August 19, 2020, number of proteins in the database was 20385) was used for searching raw MS data. For identification of the peptides, the mass tolerances were 20 ppm for initial precursor ions and 0.5 Da for fragment ions. Enzyme specificity was set to trypsin/P. Two missed cleavages in tryptic digests were allowed. Oxidized methionine and protein N-term acetylation as variable modifications were searched as variable modifications, while carbamidomethyl cysteine as a fixed modification. Filtering for the peptide identification was set at a 1% false discovery rate (FDR).
Protein intensities were preprocessed with sum normalization using Proteome Discoverer (version 2.1, Thermo Fisher), then logarithmic transformation, normal distribution imputation for missing values with Perseus. Analysis steps were performed in the statistical analysis environment R. For quantitative analysis of the proteomics data, the iBAQ intensities of exosome proteins from healthy controls and AIS patients were extracted from the MaxQuant result files to represent the final expression of a particular protein across samples. Unsupervised principal component analysis (PCA) was used to determine whether the exosome proteins could effectively distinguish the two groups. Moderated t-statistics was implemented with R package to select exosome proteins that were differentially expressed between the healthy controls and AIS patients. Bioinformatics including gene ontology (GO) analysis and Kyoto encyclopedia of genes and genomes (KEGG) database were used to identify enriched proteins with R package.
Then we used R language to perform machine learning for screening biomarkers between AIS patients and healthy controls. Firstly, we established the physiological fluctuation range of normal serum proteins. We used machine-learning algorithms to determine the upper and lower limits of physiological range of proteins in control group based on the data characteristics of different protein abundances. As for identification of individual and group difference proteins, we used all proteins identified in one sample to compare with the physiological range of the protein one by one. If the abundance of a certain protein in the sample exceeds the upper limit of the physiological range or is lower than the lower limit of physiological range of the protein, then we define that the protein is abnormal. All abnormal proteins in the sample are detected through this method. Comparing with the physiological range of the protein, integrating the abnormal protein information of the samples, we constructed the association matrix of abnormal protein information of the population, and defined that more than 90% of the samples are abnormal as the standard for detecting abnormal proteins at the population level.
Acquisition of hounsfield units (HU) of paraspinal muscle in AIS patients
Spine CT scanner (Philips CT scanner iCT 256-detector rows) was applied for the acquisition of HU value of paraspinal muscle in AIS patients. The manufacturer’s engineers provide standard scanning procedures and daily calibration for standard phantoms to ensure comparable measurements and quality. Two experienced radiologists selected the region of interest (ROI) at the multifidus, erector spinae, and psoas major muscles on both sides of the vertebral body. The HU value of the muscle in the ROI was automatically measured by the software. The HU value of each position was measured twice by two clinicians and the average value was used for subsequent analysis.
CT image evaluation and measurement are performed through our hospital’s picture archiving and communication system (PACS) and UniSight DICOM application (EBM Technologies Incorporated, UniSight Version 4.2b). The muscle density (HU value) of the paravertebral muscles on the concave and convex sides of the spine in patients with AIS was measured, including the apical vertebra (Apex), the upper vertebral body (Apex+1), the lower vertebra body (Apex−1), scoliosis upper end vertebra (uppermost instrumented vertebra, UIV) and scoliosis lower end vertebra (lowest instrumented vertebra, LIV) and bilateral psoas. As for the control group, the HU value of paravertebral muscles was measured in the corresponding apical vertebral segment. In order to evaluate the reliability of HU value measured through CT, two clinicians measured the HU values of paravertebral muscles in CT images of AIS patients twice in consecutive 14 days. Clinicians were blind to the patients’ information and the intra-group correlation coefficient (ICC) was used to assess the consistency between clinicians. The Cobb's angle of scoliosis, the bending Cobb's angle in the supine position were measured and the flexibility index (FI) to assess the degree of scoliosis stiffness were calculated.
Cell culture and treatment
Mice myoblast C2 C12 cell line were purchased from National Collection of Authenticated Cell Cultures (Shanghai, China) and were cultured in Dulbecco’s Modified Eagle’s medium (DMEM, Sigma-Aldrich) with 10% fetal bovine serum (Gibco) and 1% penicillin/streptomycin (Sigma-Aldrich) as the growth medium. The cells were grown at 37 °C in controlled humidified air with 5% CO2. At confluence, differentiation into myotubes was induced by changing the medium to DMEM supplemented with 2% horse serum.
Cells were seeded in a 6-well plate at a density of 1 × 10⁵ cells/ml and placed in an incubator. After the cells adhered to the wall, they were cultured in serum-free medium for 24 h. To investigate the regulation and effects of CILP-1, the cells were divided into three groups: normal control group (treated with PBS), TGF-β1 group (treated with 1 ng/ml TGF-β1) and TGF-β1 + SIS3 group (pre-treated with 5 μM SIS3 1 h followed by treatment with 1 ng/ml TGF-β1, SIS3 serves as an inhibitor of Smad3 phosphorylation). All reagents used in this study were purchased from R&D system. After incubation for 24 h, protein or mRNA extraction was performed for subsequent experiments.
Paraspinal muscle sample collection and HE staining
Deep multifidus muscle tissue (1 cm × 1 cm × 1 cm) was collected bilaterally (convex side and concave side) from the scoliosis apex vertebrae during surgical procedures in AIS patients (n = 10). Then a portion of the muscle tissue was promptly fixed with 4% paraformaldehyde for 24 h to facilitate paraffin sections. The resulting sections were then stained with hematoxylin and eosin for subsequent histological analysis.
Protein extraction from tissue and cell and immunoblottingProtein extraction from tissue and cell
The remaining muscle tissues from AIS patients were immediately placed in liquid nitrogen and then transferred to −80 °C refrigerator for storage. Muscle tissue (50 mg) was continuously ground into powder. After treating C2 C12 cells under different conditions, culture medium was discarded and cells were washed with PBS before protein extraction. RIPA lysis buffer was prepared: 100 μL protease inhibitor was added to 1 mL to make the final concentration as 1 mM. RIPA lysis buffer was added to the grinding tissues or 6-well plate, pipetted 3 to 5 times and then incubated on ice for 30 min. The supernatant was obtained after centrifugation at 4 °C, 12,000×g for 15 min and stored at −20 °C.
Determination of protein concentration
PBS was used to dilute the standard substance. Then reagent A and B were prepared at the ratio of 50:1 before use. The samples were diluted 50 times with PBS to ensure that the concentration was within the linear range of the standard curve. Then 25 μl standard substance or diluted samples were added in the 96-well plate before 200 μl working solution was added to each well. Then the plate was incubated at 37 °C for 2 h and OD value was obtained at 562 nm. The standard curve was obtained and protein concentration of the samples was calculated based on the OD value.
Immunoblotting
The main procedures were the same as previously mentioned in exosome identification (2.2). The primary antibodies used included anti-CILP-1 (R&D, 1: 2000), anti-TGF-β1 (Abcam, 1: 1000), anti-Smad2 (Abcam, 1: 1000), anti-p-Smad2 (Abcam, 1: 5000), anti-Smad3 (Abcam, 1: 5000), anti-p-Smad3 (Abcam, 1: 2000), anti-Fibronectin (Abcam, 1: 5000), anti-Vimentin (Abcam, 1: 5000), anti-Tenascin (Abcam, 1: 5000), anti-α-smooth muscle actin (α-SMA) (Abcam, 1: 5000), anti-Collagen1 A1 (Abcam, 1: 2000) and anti-GAPDH (Abcam, 1:5000). The protein bands were scanned and quantified by densitometric analysis through image J software. The experiment was repeated at least three times.
Quantitative real-time PCR
Total RNA was extracted from muscle tissues using Trizol reagent (Tiangen, Beijing) according to the manufacturer’s protocol. NanoDrop 2000c UV–Vis Spectrophotometer (Thermo Fisher Scientific) was used to detect the concentration of extracted RNA. Then one-step RT-PCR kit (Tiangen, Beijing) was used to perform reverse transcription and subsequent amplification in triplicated reactions in BioRad PCR system. Primer sequences used were shown in Supplementary Table 1.
ELISA verification of screened biomarkers
We recruited another 35 AIS patients and 37 healthy individuals as validation cohort. Four DEPs, Actin, alpha cardiac muscle 1 (ACTC), Cartilage intermediate layer protein 1 (CILP-1), EGF-containing fibulin-like extracellular matrix protein 1 (FBLN3) and Voltage-dependent anion-selective channel protein 1 (VDAC1) were selected to validate the proteomic results. The concentration of these proteins in plasma were measured using ELISA. The ELISA kits for these proteins were purchased from Fine Test (Wuhan, China) and Abcam (USA) and utilized as per the manufacturer's instructions. Samples were added at specific dilution ratios and incubated for 90 min at 37 °C. Subsequently, the liquid was removed, and the wells were washed. Biotinylated antibody (1×) was then added to each well with an incubation period of 60 min at 37 °C. Following this, the liquid was removed again, and the wells were washed once more. Horse radish peroxidase (HRP)-antibody (1×) was added to each well with an incubation time of 30 min at 37 °C. TMB substrate was subsequently introduced and allowed to incubate for 10–20 min at 37 °C in a light-free environment. Finally, stop solution was added, and optical density measurements were immediately obtained using a microplate reader set to detect absorbance at a wavelength of 450 nm.
Statistical analysis
The statistical analyses were performed using GraphPad Prism 9 (GraphPad Software Inc.), and the results were presented graphically. The normality of all data was evaluated via the Kolmogorov–Smirnov test or Shapiro–Wilk test. One-way analysis of variance (ANOVA) procedures and T-test were employed to determine the distinct levels of parameters across different groups. Receiver operating characteristic (ROC) analysis, which generate parameters including area under the ROC (AUC), sensitivity, and specificity were performed to evaluate the predictive performance of proteins. All statistical analyses were performed using SPSS statistical software 26.0 and GraphPad Prism 9 software. p < 0.05 was considered statistically significant.


Comments (0)