
Remember me
All animal experiments were conducted with the approval of and in accordance with the Guide of the Care and Use of Laboratory Animals of the Government of Upper Bavaria, Germany. Mice were group-housed under standard lab conditions (22 ± 1 °C, 55 ± 5% humidity) and maintained under a 12-h light–dark cycle with food and water ad libitum. All experiments were conducted with adult male mice (age: 2–5 months).
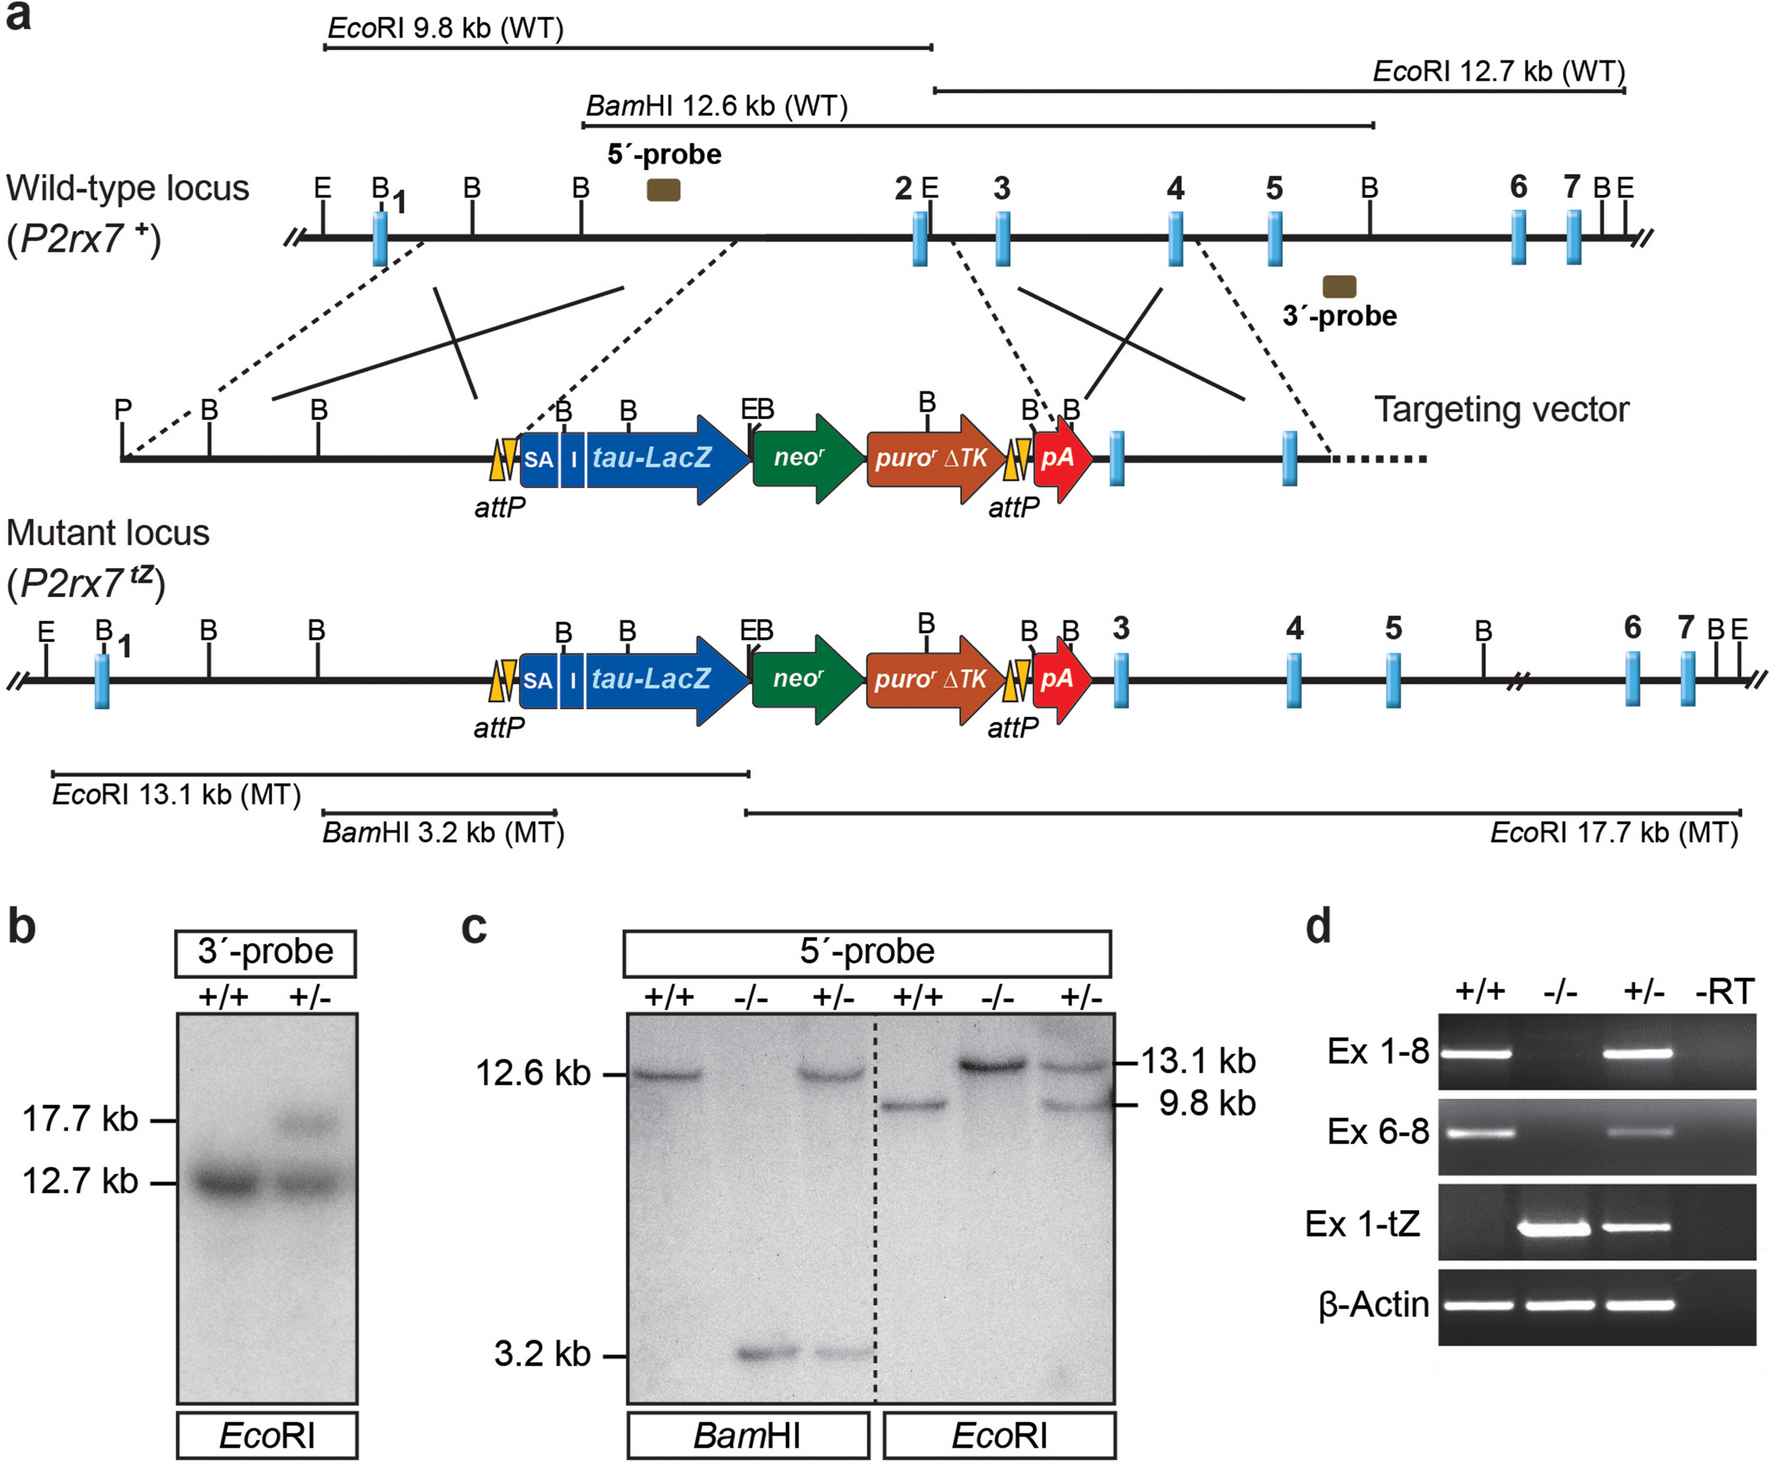
Generation of P2X7 KO miceFor disruption of the murine P2rx7 gene, a targeting vector was constructed, which allowed for subsequent recombinase mediated cassette exchange (RMCE) via phiC31 integrase and which contains a tau-LacZ reporter gene. Homology arms (HAs) were amplified by polymerase chain reaction (PCR) from genomic DNA of embryonic stem cells (ES) (TBV2, 129S2/SvPas) using Herculase (Stratagene, Heidelberg, Germany) and cloned via the TOPO TA cloning kit (Invitrogen, Karlsruhe, Germany). The 6.0-kb 5′-HA was amplified with primers 5′-PacI-GTC-ATG-TGA-CAA-CTG-CAT-GC-3′ and 5′-MfeI-GCT-GGA-TCA-TCA-GAC-TCT-GT-3′, the 4.0-kb 3′-HA was amplified with primers 5′-AscI-AGT-TTG-CAA-AGC-CGA-GAA-AA-3′ and 5′-EcoRI-GTC-TTT-TTG-CAA-GGC-TGA-GG-3′. Sequencing (Sequiserve, Vaterstetten, Germany) verified the HAs and confirmed that the 5′-HA was inserted into a previously cloned shuttle vector via PacI/MfeI and the 3′-HA via AscI/EcoRI. The HAs enframe a 9.5-kb reporter–selection cassette comprising the following components (from 5′ to 3′): adenovirus type 2 RNase gene splice acceptor (SA), encephalomyocarditis virus internal ribosome entry site (IRES), tau-LacZ reporter gene, bovine growth hormone polyadenylation sequence (bGHpA), PGK-Neo-bGHpA, PGK-PuroΔTK-bGHpA and 3 × pA (PGK pA, 2 × SV40 pA). The entire reporter-selection cassette is flanked by RMCE compatible attP sites. The vector was designed to substitute 2.3 kb including exon 2 of the P2rx7 gene that will result in a frameshift and complete loss of P2X7 receptor function (Fig. 1a). The SA-IRES-tau-LacZ-bGHpA and the 3 × pA were isolated and modified from a previously constructed ROSA26 targeting vector [60]. The PGK-PuroΔTK-bGHpA was isolated from pYtC37 [61]. Probes used for identification of homologous recombination events were amplified by PCR from genomic DNA and cloned using the TOPO TA cloning kit. 5′-probe: forward 5′-TAG-TCT-GGC-CCA-AGG-AAC-TG-3′ and reverse 5′-AGT-CCC-TGG-AGC-AAA-CAC-AG-3′ (633-bp); 3′-probe B: forward 5′-AGG-CTA-AGA-TGC-TGG-CAA-TGC-3′ and reverse 5′-CCC-ATG-GAC-ACT-CCT-CAC-AC-3′ (499-bp) (Fig. 1a). The linearized (via PacI) targeting vector bearing 10.0-kb homology to the murine P2rx7 locus was electroporated into TBV2 (129S2/SvPas background) ES cells. Mutant ES cell clones were identified by Southern blot analysis of genomic ES cell DNA digested with EcoRI using the 3′ external probe (Fig. 1b). Mutant ES cells were used to generate chimeric mice by blastocyst injection. Germline transmission of the modified P2rx7 allele was confirmed in offspring from male chimeras bred to wild-type C57BL/6 J females. Subsequently, mice were maintained on a mixed 129S2/SvPas × C57BL/6 J background. Wild-type (WT) and knockout (KO) littermates derived from heterozygous breeding were used in all experiments. Genotyping was performed by PCR using primers: 5′-GCA-GTC-TCT-CTT-TGC-CTC-GT-3′, 5′-GAC-CGA-AGG-CAA-GAA-CTG-AC-3′ and 5′-GGA-AAG-ACC-GCG-AAG-AGT-TTG-3′. Standard PCR conditions resulted in a 484-bp wild-type and a 317-bp mutant PCR product.
Fig. 1
Generation of P2X7 knockout mice. a Targeting strategy with partial restriction maps of the wild-type P2rx7 locus, targeting vector and mutant locus following homologous recombination. b Southern blot analysis of wild-type and targeted ES cell clones. The 3′-probe was hybridized to EcoRI-digested genomic ES cell DNA. The targeted allele is indicated by the presence of an additional 17.7-kb fragment. c Southern blot analysis of F2 mice. The 5′-probe was hybridized to BamHI and EcoRI-digested genomic DNA. The targeted allele is indicated by the presence of a 3.2-kb BamHI fragment and a 13.1-kb EcoRI fragment, respectively. d RT-PCR analysis using brain-derived cDNA as template, demonstrates the replacement of P2rx7 wild-type mRNA by a fusion transcript of exon 1 with the tau-LacZ reporter. Abbreviations: B, BamHI; E, EcoRI; Ex, Exon; I, internal-ribosomal entry site; pA, polyadenylation signal; SA, splice acceptor
Reverse transcription (RT)-PCR analysisExpression of P2rx7 mRNA in brain and in peripheral tissues was analyzed by RT-PCR. First-strand cDNA synthesis from 1 μg total RNA was performed with SuperScript™ II reverse transcriptase (Invitrogen) according to the manufacturer’s protocol using an oligo (dT) primer. The PCRs were conducted using primers: mP2rx7_E1-8_for 5′-TGC-ACA-TGA-TCG-TCT-TTT-CC-3′, mP2rx7_E1-8_rev 5′-ACC-AGC-TGT-CTA-GGT-TGC-3; mP2rx7_E6-8_for 5′-GCC-GAA-AAC-TTC-ACC-GTA-CT-3′, mP2rx7_E6-8_rev 5′-ACC-AGC-TGT-CTA-GGT-TGC-3′; mP2rx7_E1-tau-lacZ_for 5′-TGC-ACA-TGA-TCG-TCT-TTT-CC-3′, mP2rx7_E1-tau-lacZ_rev 5′-GTT-TTC-CCA-GTC-ACG-ACG-TT-3′; mP2rx7_E1-4_for 5′-CAC-ATG-ATC-GTC-TTT-TCC-TAC-3′, mP2rx7_E1′−4_for 5′-GCC-CGT-GAG-CCA-CTT-ATG-C-3′, mP2rx7_E1-4_rev 5′-GGT-CAG-AAG-AGC-ACT-GTG-C-3′; β-actin_for 5′-ATC-GTG-CGT-GAC-ATC-AAA-GA-3′, β-actin_rev 5′-ACA-TCT-GCT-GGA-AGG-TGG-AC-3′. PCR products were analyzed by agarose gel electrophoresis together with a DNA marker (Smart Ladder, Eurogentec, Brussels, Belgium).
In situ hybridizationMice (2–3 months old) were sacrificed by an overdose of isoflurane. The brains were carefully removed and immediately shock frozen on dry ice. Frozen brains were cut on a cryostat in 20-μm-thick sections. The P2rx7-specific probe comprises nucleotides 1373–1794 of GenBank accession no. NM_011027. A riboprobe was generated by PCR, labelled and hybridized as described before [62]. The hybridized slides were dipped in autoradiographic emulsion (type NTB2; Eastman Kodak, Rochester, NY, USA), developed after 6 weeks, and counterstained with cresyl violet.
X-Gal stainingStaining for tau-LacZ report gene activity was performed as previously described [63].
Western blotFor detection of P2X7 via Western blot, fresh cortex tissue was homogenized, lysed and subsequently analyzed by SDS-PAGE followed by immunoblotting using a polyclonal rabbit antibody directed against the C-terminal domain of P2X7 (Synaptic Systems, Cat no #177,003; 1:1000). A polyclonal rabbit antibody against βactin (Cell SignallingTechnoloct Cat no # 4967; 1:2000) was used as a loading control.
Interleukin-1β assayMice (2–3 months old) were euthanized by an overdose of isoflurane and peritoneal macrophages were collected immediately by lavage of the peritoneal cavity with Dulbecco’s Modified Eagle’s Medium (DMEM) containing 5% of foetal calf serum and penicillin/streptomycin (100 units/ml and 100 μg/ml, respectively). Lavage fluid from 3 to 5 animals was pooled and cells were collected by centrifugation. Cells were re-suspended, counted and 0.5 × 10⁶ cells/well were plated in 24-well plates. The cells were allowed to attach to the well overnight. The next day, 3 μg/ml LPS were added to each well and cells were primed for 2 h. Cells were then challenged for 30 min with 1 mM of 2′,3′-O-(benzoyl-4-benzoyl)-adenosine 5′-triphosphate (BzATP). Finally, supernatants were collected and analysed for IL-1β with an ELISA kit following the manufacturer’s instructions (Endogen, Pierce Technology, Rockford, IL, USA).
Calcium imagingPeritoneal macrophages were obtained as described above. Conventional, wide-field fluorescence imaging was performed using a variable scan digital imaging system (TILL Photonics, Martinsried, Germany) attached to an upright microscope (Axioskop, Zeiss, Jena, Germany; 60 × water immersion objective, N.A. 0.90, Olympus Europe, Hamburg, Germany) and a CCD camera as a sensor (Retiga 2000RV, QImaging, Surrey, Canada). Cells were dye-loaded with the Ca2+ -selective dye Fluo-4 (Fluo-4-AM, 1 μM; Excitation 485 nm, Emission > 510 nm) by addition to the cultured cells. Macrophages were incubated at 37 °C in a dark incubator for 1 h. For wide-field imaging, background-corrected fluorescence signals were obtained from defined regions of interest after excitation at 485 nm and images were acquired at 2 Hz. After background subtraction, the fluorescence emission was calculated using TillVision software (TILL Photonics, Martinsried, Germany) and data were analyzed off-line using “IGOR Pro”-Software (WaveMetrics, Inc., Lake Oswego, OR). BzATP or KCl (stock concentrations: 100 mM BzATP, 3 mM KCl) were bolus-applied to the bath containing 2 ml HEPES Ringer (140 mM NaCl, 3 mM KCl, 10 mM glucose, 10 mM HEPES, 1 mM CaCl2 and 4.5 mM sucrose, pH 7.35).
Chronic social defeat stress (CSDS)The chronic social defeat was performed as previously described [64]. Food and water were provided ad libitum. In brief, wild-type (WT) and KO littermates were subjected to chronic social defeat stress for 21 consecutive days. They were introduced into the home cage of a dominant CD1 for no longer than 5 min and were subsequently defeated. Mice were closely monitored during the procedure to prevent any significant injuries which might result in inflammatory reactions potentially interfering with the intended psychosocial nature of the stressor. Once the test animals showed defeat, they spent 24 h in the same cage as the resident mouse, separated by a perforated partition that enabled sensory but not physical contact. Every day, experimental mice were exposed to a new unfamiliar resident. Control animals were single-housed in their home cages over the course of the experiment. All animals were handled daily, weight and fur status were assessed every 3–4 days. Behavioural testing was conducted during the last week of the CSDS paradigm in the following order: open field test, dark–light box, social avoidance test, forced swim test. All behavioural tests were performed between 08:00 am and 12:00 pm in a room adjacent to the animal housing room. Recording, tracking and scoring of animal behaviours were carried out using the automated video tracking system ANY-maze (ANY-maze; Stoelting Co, Wood Dale, IL, USA). All tests were performed by an experienced, blinded researcher and according to established protocols. At the end of the experiment, adrenal glands and thymus were collected and weighed.
Open field test (OFT)The OFT was conducted in an evenly illuminated and box, open at the top (< 15 lx, 50 × 50 × 60 cm). Mice were placed in a corner of the box and left undisturbed for 15 min. Parameters analysed were total distance travelled and total time in the inner zone (3 × 3 inner squares) and outer zone (16 squares along the box walls).
Elevated plus maze (EPM)The EPM consisted of a plus-shaped platform, which is elevated 37 cm above the floor. Two opposing open (30 × 5 cm) and closed (30 × 5 × 15 cm) arms were connected by a central zone (5 × 5 cm). Animals were placed in the centre of the apparatus facing the closed arm and left undisturbed for 5 min. Open arm time (OAT) was calculated as a percentage of time in seconds: open arm time (%) = open arm time/(open arm time + closed arm time).
Dark–Light Box (DLB)The DLB test was performed in an apparatus consisting of a secure black compartment (< 5 lx, 15 × 20 × 25 cm) and an aversive, brightly illuminated white compartment (700 lx, 30 × 20 × 25 cm). The compartments are connected by a tunnel (4 × 7 × 10 cm), which allows animals to travel unobstructed between the compartments. To start the experiment, mice were placed in the dark compartment and were left unobstructed for 5 min. Entries in the bright zone were counted if the front paws and half of the animal body were inside.
Forced swim test (FST)To assess active and passive stress-coping behaviours, mice were placed in a cylindric glass beaker (24 × 12 cm) filled with water (23 ± 1 °C). Behaviour was videotaped for 6 min. Scoring was performed manually for mobility and immobility by a trained observer.
Social avoidance test (SAT)The social avoidance test was conducted as previously described [65]. In brief, mice were placed in an OFT arena for 2.5 min containing an empty wire mesh cage on one side, which is called the interaction zone. During the second 2.5 min, animals were confronted with an unfamiliar male CD1 mouse inside the wire mesh cage. Following this, the ratio between the time in the interaction zone in absence and presence of the CD1 mouse was calculated.
Corticosterone measurementsTo determine plasma corticosterone levels, blood draw was performed at baseline (tail cut) and after CSDS (trunk blood decapitation). Concentrations were measured with a radioimmune assay according to the manufacturers protocol (MP Biomedicals Inc.) and as previously described [65].
Statistical analysisData are expressed as mean with standard error of the mean (S.E.M.) or percentage. Statistical analysis was performed using GraphPad Prism (Version 9.3.1). Statistical significance was defined as p < 0.05 and is indexed as follows: *p < 0.05, **p < 0.01, ***p < 0.001 and **** p < 0.0001 for group comparisons in figures. Analysis was performed by use of one-way, two-way (main factors: genotype, stress) or repeated-measures ANOVA to identify the sample’s source of variation, followed by Sidak’s multiple comparisons. In case of missing data for repeated measures, a mixed-effects model with post hoc correction with Sidak’s multiple comparison test was performed. Outliers were not removed but discussed post analysis to avoid selection bias. For the main ANOVA factors, the F-value is reported.
Comments (0)