Mice
All the animal experiments were approved by the local authorities and performed in accordance with the German animal protection laws. The mice were bred under specific pathogen-free conditions in the DRFZ animal facility at the Federal Institute for Risk Assessment, Berlin, and the central animal facility of the University Hospital Schleswig-Holstein in Kiel or bought from Charles River Laboratories (Sulzfeld, Germany). C57BL/6NCrl and CD28 knockout mice (Jax stock 002666) were used as recipients for adoptive transfer experiments. The advantage of CD28 knockout recipients is that they cannot mount an endogenous T cell response, i.e., the T-cell help comes only from the transferred Smarta cells. However, this does not result in any differences for this model. Smarta T-cell receptor transgenic mice [43] were additionally backcrossed to congenic B6PL mice (Jax stock 000406; Thy-1.1+) to track cells after adoptive transfer. To analyze IL-21 production directly ex vivo, the strains were also crossed with an IL-21-FP635 reporter strain [44]. For the transfer of antigen-specific B cells, nitrophenol (NP)-specific BCR knock-in B1-8i mice [45] were crossed with κ-L chain knockout mice [46] to ensure the NP specificity of all B cells, and with Ly-5.1 mice (Jax stock 002014; CD45.1+) to track cells in vivo. Both sexes of the mice were used at an age between 8 and 20 weeks.
Basic adoptive transfer lung inflammation model
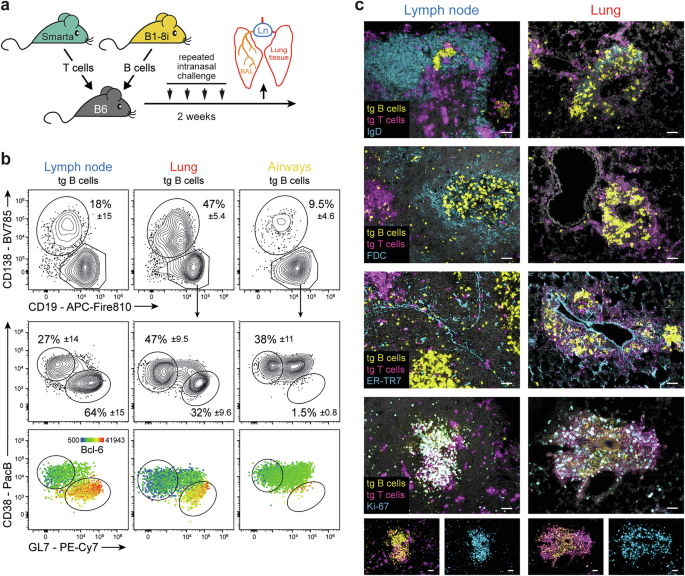
A total of 1.25 × 10⁵ Smarta T cells were cotransferred with 5 × 10⁵ follicular B1-8i B cells into recipient mice via intravenous injection. To induce lung inflammation, the mice were repeatedly challenged intranasally with 10 µg of cognate antigen (Smarta peptide and iodinated nitrophenol (NIP) coupled to mouse serum albumin as a nonimmunogenic carrier [16]) and 5 µg of LPS (Sigma‒Aldrich, St. Louis, MO, USA) as an adjuvant on days 0, 1, 10, and 13.
Analysis of antigen-presenting cells
To visualize the antigen via flow cytometry and histology, in some experiments, the mice received a NIP and Smarta peptide conjugate with phycoerythrin as the carrier on day 13 or 24 hours before sacrifice (10 µg for flow cytometry and 100 µg for immunohistology).
Analysis of early B-cell activation in the lung
To increase the number of endogenous B cells in the lung, the recipient mice received 5 µg of LPS intranasally three days prior to immunization (day -3). Adoptive transfer of transgenic T and B cells was performed on day -1; B1-8i B cells were sorted for naive CD62Lhigh cells via magnetic sorting (Miltenyi Biotec, Gladbach, Germany), and the number of transferred cells was increased to 2 x 10⁶ B cells and 5 × 10⁵ Smarta T cells. One day later (day 0), the mice were intranasally immunized with the cognate antigen as described above. One group was additionally injected i.p. with 20 µg of FTY720 (Sigma‒Aldrich). This injection was repeated 12 h later. Analysis was performed 24 h after immunization. For the 72-hour analysis, the mice were not pretreated with LPS, and the FTY injection was repeated after 24 and 48 h.
Depletion of macrophages
To deplete alveolar macrophages, C57BL/6NCrl mice received 200 µg of clodronate liposomes (Liposoma BV, Amsterdam, Netherlands) intranasally on days -3, -1, and 9 according to the adoptive transfer lung inflammation model described above. To deplete interstitial macrophages, the mice were additionally treated with 750 µg of clodronate liposomes intravenously on days -8, -5, -1, 3, and 9. PBS liposomes were used as controls.
Cell isolation
Mice were either perfused with PBS to remove blood leukocytes from the lung or received 3 µg of fluorophore-coupled antibodies against CD3 and B220 (and CD11b for some experiments) shortly before sacrifice to discriminate vascular and extravascular T and B cells [47] (or APCs for some experiments). For analysis of airway cells, bronchoalveolar lavage was performed by flushing the lungs twice via the trachea with 1 ml of PBS. The lungs were removed, and bronchial lymph nodes were dissected from the lung tissue under a stereomicroscope. Single-cell suspensions from lung tissue were prepared via a gentleMACS Dissociator (Miltenyi Biotec) and digested with 0.5 mg/ml collagenase D and 33 µg/ml DNase I (both from Roche) for 25 min at 37 °C [13]. The lymph nodes were passed through a 70 µm sieve, except for the experiments comprising APC analysis, where they were digested similarly to the lungs. The cells were counted with ViaCount solution via either a Guava Muse capillary flow cytometer or an Aurora flow cytometer (all from Cytek Biosciences, Fremont, CA, USA).
Flow cytometry
Single-cell suspensions of the lymph nodes or lungs were stained with different combinations of fluorophore-conjugated antibodies (Supplementary Table S1). All the antibodies were tested and titrated before use. After blocking Fcγ receptors with 20 µg/ml anti-CD16/32, the cells were stained for 30–40 min on ice. Staining with biotinylated antibodies required an additional step with fluorophore-labeled streptavidin for 5 min. Dead cells were excluded by either adding DAPI immediately before analysis or using a fixable live/dead stain (Pacific Orange, Alexa Fluor 350, or Alexa Fluor 700 succinimidyl ester; Thermo Fisher Scientific, Waltham, MA, USA) prior to the staining procedure [48]. For the intracellular staining of Bcl-6 or Ki-67, the Transcription Factor Staining Buffer Set from eBioscience (San Diego, CA, USA) was used. For detection of EdU incorporation, the EdU Cell Proliferation Kit from Thermo Fisher was used. The mice received 1.5 mg of EdU by i.p. injection two hours before sacrifice. Flow cytometry analysis was performed on an LSR Fortessa (Becton Dickinson, Franklin Lakes, NJ, USA) or Cytek Aurora (Cytek Biosciences) flow cytometer, and the data were analyzed with FlowJo v10 software (Tree Star Inc., Ashland, OR, USA). In all figures, antigen-specific T cells were identified as live CD19- CD4+ Thy-1.1+ and antigen-specific B cells as live CD4- CD19+ CD45.2- CD45.1+ cells.
Immunohistology
The lungs were filled with 50% TissueTek OCT compound (Sakura Finetek, Tokyo, Japan) in PBS via the trachea and snap frozen in ice-cold isopentane. Cryostat sections (8 µm) were cut and fixed with acetone. After peroxidase inactivation and blocking with casein solution (Vector Laboratories, Burlingame, CA, USA), the sections were stained with the antibodies listed in Supplementary Table S2. Tyramide signal amplification was performed via peroxidase-coupled anti-FITC or anti-digoxigenin antibodies and Alexa Fluor 488-, 555-, or 647-coupled tyramide (Thermo Fisher Scientific). Nuclei were counterstained with DAPI, and slides were mounted with Fluoromount (Sigma‒Aldrich). Images were captured on a Carl Zeiss (Oberkochen, Germany) LSM 880 laser scanning microscope with ZEN 2.3 software.
Macrophage/B-cell coculture
The macrophages were isolated from the lung inflammation mouse model on day 6. The mice received additional cognate (Smarta peptide + NIP coupled to mouse serum albumin) or noncognate (Smarta peptide coupled to only mouse serum albumin) antigen 24 h and two hours before sacrifice. The alveolar and interstitial macrophages were sorted on an ARIA Fusion cell sorter according to the gating scheme shown in Supplementary Fig. S5. Naive antigen-specific B cells were isolated from the spleens of B1-8i mice via CD43 depletion, followed by selection of CD62Lhigh cells via magnetic cell sorting. The macrophages and B cells were cocultured at a 1:3 ratio in 96-well round-bottom plates in complete RPMI 1640 medium at 37 °C and 5.2% CO2. As a positive control, 10 µg/ml cognate antigen complexed with anti-NP-IgM (clone 267.7 µ, kind gift from Klaus Rajewsky, Berlin) was added. Cultures were analyzed by flow cytometry after 24 and 48 h.
Single-cell RNA sequencing
Antigen-specific B cells from the adoptive transfer system were isolated from the lung and lung-draining lymph nodes on day 17 and enriched for CD45.1-expressing cells via magnetic sorting. For higher purity, cells were sorted on an ARIA II or ARIA Fusion cell sorter (Becton Dickinson, Franklin Lakes, NJ, USA) as CD4- CD8- CD19+ CD45.1+ CD45.2- total B cells for the transcriptome and further as CD138- CD38low GL7+ for the BCR experiment. The cells were separated on a 10x Genomics (Pleasanton, CA, USA) Chromium Controller, and libraries were prepared via the Chromium Next GEM Single Cell 3’ v2 Kit or the Chromium Next GEM Single Cell 5’ v2 Kit in combination with the Single-cell Mouse BCR Amplification Kit. Sequencing was performed on an Illumina (San Diego, CA, USA) NextSeq 500 or NextSeq 2000 system using a high-output v2 flow cell.
Single-cell RNA data analysis
The raw sequence reads from the experiment depicted in Fig. 2 were processed via Cell Ranger (version 5.0.0; 10x Genomics). Demultiplexing, mapping, detection of intact cells and quantification of gene expression were performed via Cell Ranger’s count pipeline with default parameter settings, with an expected number of 3000 cells per sample and a reference-cellranger-mm10-1.2.0 as a reference. This led to 2565 cells (1440 median genes per cell, 56,303 mean reads per cell) for the lung sample and 3788 cells (1311 median genes per cell and 48,723 mean reads per cell) for the lymph node sample. Next, Cell Ranger aggr was used to merge the libraries without size normalization. The samples were further analyzed in R (version 4.1.2) via the Seurat package (version 4.0.5) [49]. In particular, samples were read via Read10x and CreateSeuratObject and normalized by NormalizeData with LogNormalization as normalization.method and a scale factor of 10,000. A uniform manifold approximation and projection (UMAP) was computed via FindVariableFeatures with 2000 variable genes and vst as selection.method, ScaleData, RunPCA to compute 50 principle components and RunUMAP with dimensions of 1:30. Transcriptionally similar clusters were identified via shared nearest neighbor (SNN) modularity optimization via FindNeighbors with pca as the reduction and 1:30 dimensions and FindCluster with resolutions ranging from 0.1--1.0 in 0.1 increments. The optimal resolution was chosen by visual inspection of the percentage of mitochondrial genes, UMI counts, number of identified genes and expression of typical marker genes for GC B cells and plasmablasts projected on the UMAP. Clustering with a resolution of 0.1 was judged to best separate the B-cell subsets and define low-quality cells. Cells in cluster 0 (GC-like B cells) were extracted and reanalyzed separately as described above. By visual inspection, resolutions of 0.4 and 0.2 were considered to best reflect their transcriptional community structure.
Similarly, the raw sequence reads from the experiment depicted in Fig. 7e were processed via Cell Ranger (version 7.1.0; 10x Genomics) with the default parameter settings, and refdata-gex-mm10-2020-A was used as a reference. This led to 1471 cells (2818 median genes per cell, 159,367 mean reads per cell) for the lung and 4048 cells (2741 median genes per cell and 64,047 mean reads per cell) for the lymph node sample. Next, Cell Ranger aggr was used to merge the libraries without size normalization. UMI counts for immunoglobulin genes and pseudogenes as defined by the gene_biotype were removed for further analysis in R. A UMAP was computed as described above.
Analysis of differentially expressed genes and pathway analysis
FindAllMarkers with the default parameter settings were used to define DEGs between clusters. Bubble plots are based on z-transformed median expression values of the top differentially expressed genes as determined by the fold change and a Bonferroni corrected p value (Wilcoxon rank sum test) below 0.01. Gene set enrichment analysis (GSEA) was performed as previously described [50]. In particular, a pseudo bulk GSEA was performed for each cell on the basis of the difference from the mean of log normalized expression values of all cells in the analyzed set as a preranked list and 1000 randomizations. Significant up- or downregulation was defined by an FDR ≤ 0.25 and a normalized p value < 0.05, as recommended [51]. For visualization, the NESs for significant cells were plotted. GSEA was performed for cluster 0, GC-like B cells and BCR cells via hallmark gene sets, REACTOME, and KEGG, which were obtained from the MSigDB collection [52]. Pathway enrichment is defined by the ratio of significant cells in the lung and lymph nodes.
Single-cell BCR analysis
The raw sequence reads were processed via CellRanger (version 7.1.0). Vdj was used with the default parameter settings for demultiplexing and assembly of the B-cell receptor sequences via refdata-cellranger-vdj_GRCm38_alts_ensembl-mouse-2.2.0 as a reference. In the case of multiple contigs, the most abundant, productive and fully sequenced contig for the heavy and light BCR chain was used. This led to the detection of 681 cells with 639 IGHV1-72 heavy chain annotations in the lungs and 2305 cells with 2124 IGHV1-72 heavy chain annotations in the lymph nodes. Overlap statistics were performed as described for bulk BCR sequencing.
Bulk BCR sequencing
Antigen-specific B cells from a day 18 immune response were isolated from the lymph nodes and lungs and magnetically enriched as described above. Plasmablasts were sorted as DAPI- CD4- CD8- CD45.1+ CD45.2- CD19low CD138+ and GC B cells as DAPI- CD4- CD8- CD45.1+ CD45.2- CD19+ CD38low GL7+ on an ARIA II cell sorter directly into TRIzol LS reagent (Invitrogen, Waltham, MA, USA). RNA was isolated via the Qiagen (Hilden, Germany) RNeasy Micro Kit. Heavy chain immunoglobulin BCR libraries were prepared according to the protocol of Chudakov [53] and sequenced on an Illumina MiSeq system (600 cycle v3 kit).
Bulk BCR data analysis
The raw sequence reads were demultiplexed with MIGEC-1.2.4a Checkout -cute and assembled with AssembleBatch --force-collision-filter and --force-overseq of 3 [54]. The resulting BCR heavy chains were classified according to the presence of isotype-specific sequences: CAAATGTCTTCCCCC for IgM, CCATCTACCCACTGA for IgA and N1ACAN2CCCCATCN3GTCTATCC for IgG, allowing for one mismatch. The IgG sequences were further subdivided into IgG1 when G, C and T were present at positions N1, N2 and N3; A, G and G into IgG2a; A, C and A for IgG2b; and A, G and T for IgG3. For the annotation of the framework (FR) and complementarity determining regions (CDR) and the determination of mutations, sequences were aligned pairwise to the Vh186.2-IgG1 sequence via the Needleman‒Wunsch algorithm. The FR and CDR of the Vh186.2-IgG1 sequence were determined via the IMGT Immunoglobulin Web Portal [55]. Silent mutations and replacement mutations were defined on the basis of the alteration of the corresponding amino acid. Mutations were normalized to the corresponding sequence length.
Lineage trees were computed with GLaMST [56] using the FR1 to FR4 sequences and the Vh186.2 sequence as the root input. Statistics on the overlap of repertoires between different samples were based on the presence of identical clonal sequences in different samples. A clonal sequence was defined by the FR1-FR4 sequence. To assess the likelihood of the observed overlap, the overlap was compared to 1000 randomly generated overlaps by shuffling all BCR sequences among the samples. Repertoire overlap statistics show the proportion of the FR1--FR4 sequences in each sample that were identified in the rowwise sample. Sequence logos of the CDR were computed as described by Schneider et al. [57] while considering the UMI counts.
Analysis of cytokines and survival factors by qRT‒PCR
Total lung RNA was isolated via the Zymo Research (Orange, CA, USA) Quick-RNA Miniprep Kit. Organs were directly homogenized in lysis buffer supplemented with 0.5% Antifoam Y-30 (Sigma‒Aldrich) via a gentleMACS dissociator and M-tubes (Miltenyi Biotec). Alveolar and interstitial macrophages were sorted directly into TRIzol LS (Thermo Fisher Scientific) on an ARIA Fusion cell sorter according to the gating scheme shown in Supplementary Fig. S5. RNA was isolated via the Qiagen miRNeasy Micro Kit. cDNA was synthesized via a Roche (Penzberg, Germany) high-capacity cDNA synthesis kit. qPCR analysis was performed in duplicate on an Applied Biosystems (Carlsbad, CA, USA) QuantStudio 5 system via TaqMan Gene Expression Assays (Applied Biosystems, Supplementary Table S3).
In silico model for BCR affinity maturation
We described BCR affinity maturation as a stochastic birth–death mutation process by adapting and extending a mathematical model [58]. In brief, both cell proliferation and cell death are controlled by a cell-intrinsic fitness score, which is subject to stochastic modification in every new generation, and we developed specific lymph node and lung scenarios on the basis of experimental data. The model is implemented in a straightforward stochastic simulation scheme in MATLAB, and the parameters were adopted from [58] and modified to reflect the shorter selection time period observed in our experiments (Supplementary Table S4).
In the model, each clone is initialized with a single cell of moderate fitness, described by a scalar weight or fitness score \(_\in (}})\). Clones can expand via cell division or become extinct when their last member undergoes apoptosis. Both cell division and cell death follow a Poisson process. At each cell division, the fitness evolves via random mutation according to a diffusion process, \(_=_}+(0,\sqrt)\). The birth and death rates λi and δi of each cell \(i\in [1,\ldots ,M]\) depend on \(}\) as follows:
$$_=\frac_}_\left(_\right)}_}$$
(1)
$$_=\frac__\left(_\right)}_}}+\left(_-_\right) \frac$$
(2)
Here,\(\quad _}=__(_)/M\) and \(_}=__(_)/M\) are the population-averaged growth and death rate modulations, respectively. The above definitions ensure that population averages are conserved, that is, \(\left\langle _\right\rangle =_,\,\left\langle _\right\rangle =_+\left(_-_\right)M/C\), independent of the form of the weighting functions fλ and fδ. The death rate is further modulated by a term proportional to the ratio of the total cell number M and an assumed maximal capacity C of the GC to ensure that cells cannot grow without bounds even at very high affinity.
As an extension and generalization of the model by Amitai et al. [58], we define the functions \(_\) and \(_\), which represent birth and death selection, respectively, in the following form of Hill-type equations:
$$_\left(_\right)=1+\left(_-1\right)\frac_}^}_}^}$$
(3)
$$_\left(_\right)=\frac_}^}_\quad _}^}$$
(4)
This definition ensures that \(_\left(0\right)=_\left(0\right)=1\) so that cells with small fitness values evolve with unchanged growth and death rates \(_,\,_\). At \(_\gg 1\), the growth rate tends toward \(_\), and the death rate tends toward \(1/_\). Thus, the parameters \(_\) and \(_\) are the maximal fold changes due to the fitness advantages of the growth and death rates, respectively.
To analyze our experimental results and specifically compare clonal selection in lymph nodes versus secondary lymphoid organs, we considered three different simulation scenarios as follows:
Growth phase
In line with [58], we assume that for an initial time period Tg, the number of responsive cells is too small for competition among them; therefore, all the cells are able to grow independently of their individual weights. That is, instead of Eqs. 3, 4 above, we set \(_\left(_\right)=_\left(_\right)=1\) for all \(_\).
Lung
After the growth phase, the cells enter the competition phase for a time period Tc. Both birth and death selection occur for all cells, according to Eqs. 1–4.
Growth decay in the lung
In addition to the processes of scenario (ii), a decay of the average growth rate \(_\) is considered after time \(_}.\) Specifically, we use a new value \(}_\) in Eq. 3 above, and we set \(}_=\left\\left(_-_\right)^_}\right)}+_\,,\,t > _}\\ _\,,\end\right.\). This form of the decay function ensures that the average growth rate does not become smaller than the average death rate \(_\). The decay rate \(\kappa\) is determined on the basis of the experiment shown in Fig. 6c–e.
Lymph node
In contrast to the lung, the lymph node is divided into the dark zone (DZ) and the light zone (LZ). In our model, cells stochastically transit from the DZ to the LZ and from the LZ to the DZ according to a Poisson process with rates \(_}\) and \(_}\), respectively (Supplementary Table S4). Only DZ cells can divide. Therefore, to attain comparable average growth rates, we modified the growth rate by a factor of \(_}=2\), which accounts for the observed fraction of time that each cell spends in the DZ on average (50%, which is in agreement with the experimental data). Specifically, we use a new value \(}_\) in the formalism below, and we set \(}_=_}_\). Apart from proliferation in the DZ, we account for processes in the LZ that include receiving T cell help, both boosting their growth capacity and reducing their death rate. Together, these processes are described as follows:
Cells in the DZ: λi = const; δi = δ0.
DZ-to-LZ transition: Update δi according to Eqs. 2 and 4.
Cells in LZ: λi = 0; δi = const.
LZ-to-DZ transition: Update λi according to Eqs. 1 and 3.
Notably, the growth rate is only updated upon re-entry into the DZ, not at each cell division, as in the lung scenario, because T-cell help is indispensable for LZ cells to exploit their fitness advantage.
Statistical analysis
The data were analyzed via GraphPad Prism 10. No data exclusion criteria were used. After checking for a normal distribution (Shapiro‒Wilk test), significant differences were determined via ordinary one-way ANOVA, the Kruskal‒Wallis test, unpaired t test, or the Mann‒Whitney U test.


Comments (0)