
Remember me


Clinical data were obtained from Chiba University Hospital (Chiba, Japan). An ultrasound scanner (Aplio a550; Canon Medical Systems, Otawara, Japan) equipped with a convex array probe (PVT-475BT; Canon Medical Systems) was used to acquire the ultrasound images. The center frequency of the transmitted ultrasound was 3 MHz. For image acquisition, the focal length and maximum depth were fixed at 78 mm and 120 mm, respectively.
The background diseases in all the cases included liver steatosis (LS), MAFLD, metabolic dysfunction-associated steatohepatitis (MASH), primary biliary cholangitis (PBC), autoimmune hepatitis (AH), compensated liver cirrhosis (CLC), and others. The hepatic fat deposition and liver stiffness were investigated at Chiba University Hospital. The hepatic fat deposition measured using MRI-PDFF ranged from 1.9 to 23.8%. According to a previous study, the fatty liver grades can be categorized into four groups: grade 0, normal (< 5.2%); grade 1, mild (5.2–11.3%); grade 2, moderate (11.3–17.1%); and grade 3, severe (> 17.1%)[15]. The cut-off area under the receiver operating characteristic (AUROC) values for detecting MRI-PDFF grades ≥ 1, grades ≥ 2, and grade 3 were 0.96, 0.90, and 0.79, respectively. Thus, the classification based on MRI-PDFF is considered reliable. In this study, we defined three fatty liver grades: G0 as normal, G1 as mild, and G2-3 as moderate and severe. This is because the number of moderate and severe cases was insufficient. There were 10 cases of each grade, totaling 30 cases, with four to ten images per case. In the present study, transfer learning of the typical CNNs was performed. Therefore, the number of cases and the number of input images per case were deliberately matched to remove the risk by imbalanced data. The liver stiffness and CAP measured using the FibroScan device ranged from 3.4 kPa to 46.1 kPa and from 142 to 358 dB/m, respectively. The ATI measured using the ultrasound scanner ranged from 0.36 to 1.21 dB/cm/MHz. The image findings related to liver steatosis that can be confirmed in an ultrasound image were verified by physicians. The six image findings are as follows: (1) bright liver, (2) liver-kidney contrast, (3) liver-spleen contrast, deep attenuation, (4) deep attenuation, (5) hepatic and portal vein blurring, and (6) flag sign. Table 1 presents the MRI-PDFF and six image findings of all cases.
Table 1 MRI-PDFF and six image findings: (1) bright liver, (2) liver-kidney contrast, (3) liver-spleen contrast, deep attenuation, (4) deep attenuation, (5) hepatic and portal veins blurring, (6) flag sign of all casesNormalization of ultrasound images and formation of moment mapEcho envelopes along the scan line of a convex probe with log compression were used. The ultrasound images were reconstructed through the scan conversion of envelopes that were transformed linearly. The lateral and depth pixel spacing of the image was set to 50 μm. Only the liver region was segmented from the images.
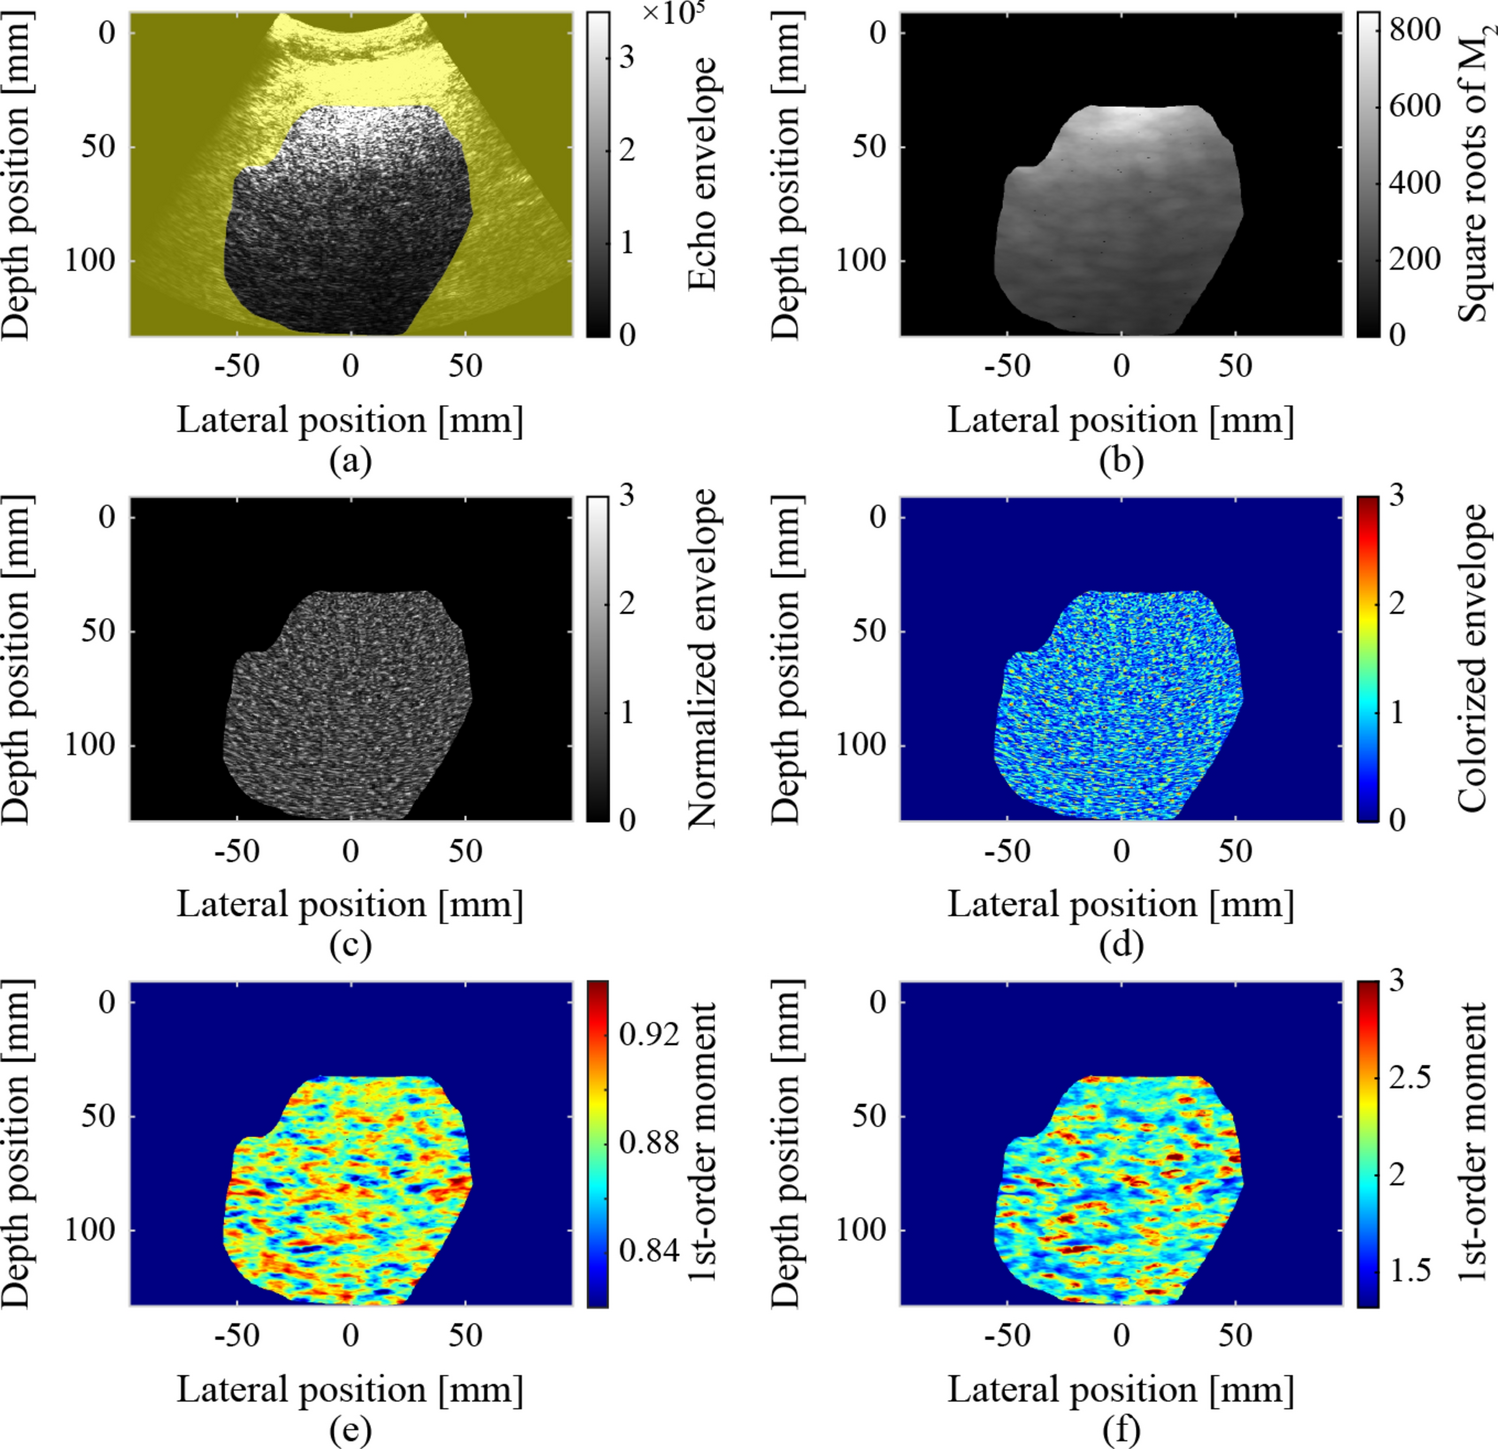
The ultrasound images were normalized using the square roots of the second-order moments to remove the effects of focus, gain, and attenuation during transmission and reception, as shown in Fig. 1. Simultaneously, non-speckle signals (pixels) that were significantly brighter than the surrounding pixels were removed. The removal threshold was set to three times the square root of the second-order moment. The sizes of the elliptical regions were set to 4.6 mm and 10.8 mm in the depth and lateral directions, respectively, for calculating the second-order moments. The size of this elliptical region corresponds to 6 × 8 times the resolution (0.76 mm × 1.35 mm). The second-order moment in the elliptical region centered on each target pixel was calculated as follows:
Fig. 1
Normalization of ultrasound images and formed moment maps: a segmented liver region, b square roots of the second-order moments, c, d normalized and colorized ultrasound images, e first-order moment map, and f fourth-order moment map
$$\:\begin\begin_=E\left[_^\right],\#\left(1\right)\end\#\end$$
where \(\:n\) is the order of the moment, \(\:i\) and \(\:j\) are the coordinates of the target pixel, and \(\:E\left[_\right]\) is the expected value of \(\:_\), which is the echo envelope of each pixel in the elliptical region. If the echo envelope of the target pixel exceeded the threshold, the target pixel was excluded as a non-speckle signal. The process of calculating the second-order moments and pixel exclusion was repeated until there were no longer any pixels to exclude. The normalized ultrasound and colorized images inputted to the CNN are also shown Fig. 1. The colorization involved converting from a gray-scale color palette (conventional B-mode style) to a jet color palette. In a previous study, the accuracy of CNN classification of ultrasound image slightly increased as a result of the colorization [22].
The first- and fourth-order moments around each pixel were calculated using Eq. (1) (\(\:n=1,\:4\)) within an elliptical region centered on the pixel, as shown in Fig. 1. The sizes of the elliptical region were set to 3.0 mm and 8.1 mm in the depth and lateral directions, respectively. The ES can be reliably calculated in regions where the sizes in both the depth and lateral directions are eight times greater than the resolution of the ultrasound image [30]. However, tissue information may be blurred by calculations in such regions. Therefore, the size of the elliptical region used to form the parametric images was reduced to 4 × 6 times the resolution.
Extraction of region of interest and formation of moment heat mapThe region of interest (ROI) was extracted as an input image for the CNN. The size of the ROI was 20 mm (400 pixels) in the lateral and depth directions. The sliding interval was at least 4 mm. In the extracted ROIs, pixels outside the liver region and pixels excluded by normalization accounted for less than 1%. The ROIs were extracted from the same locations in the colorized ultrasound images, first- and fourth-order moment maps, as shown in Fig. 2.
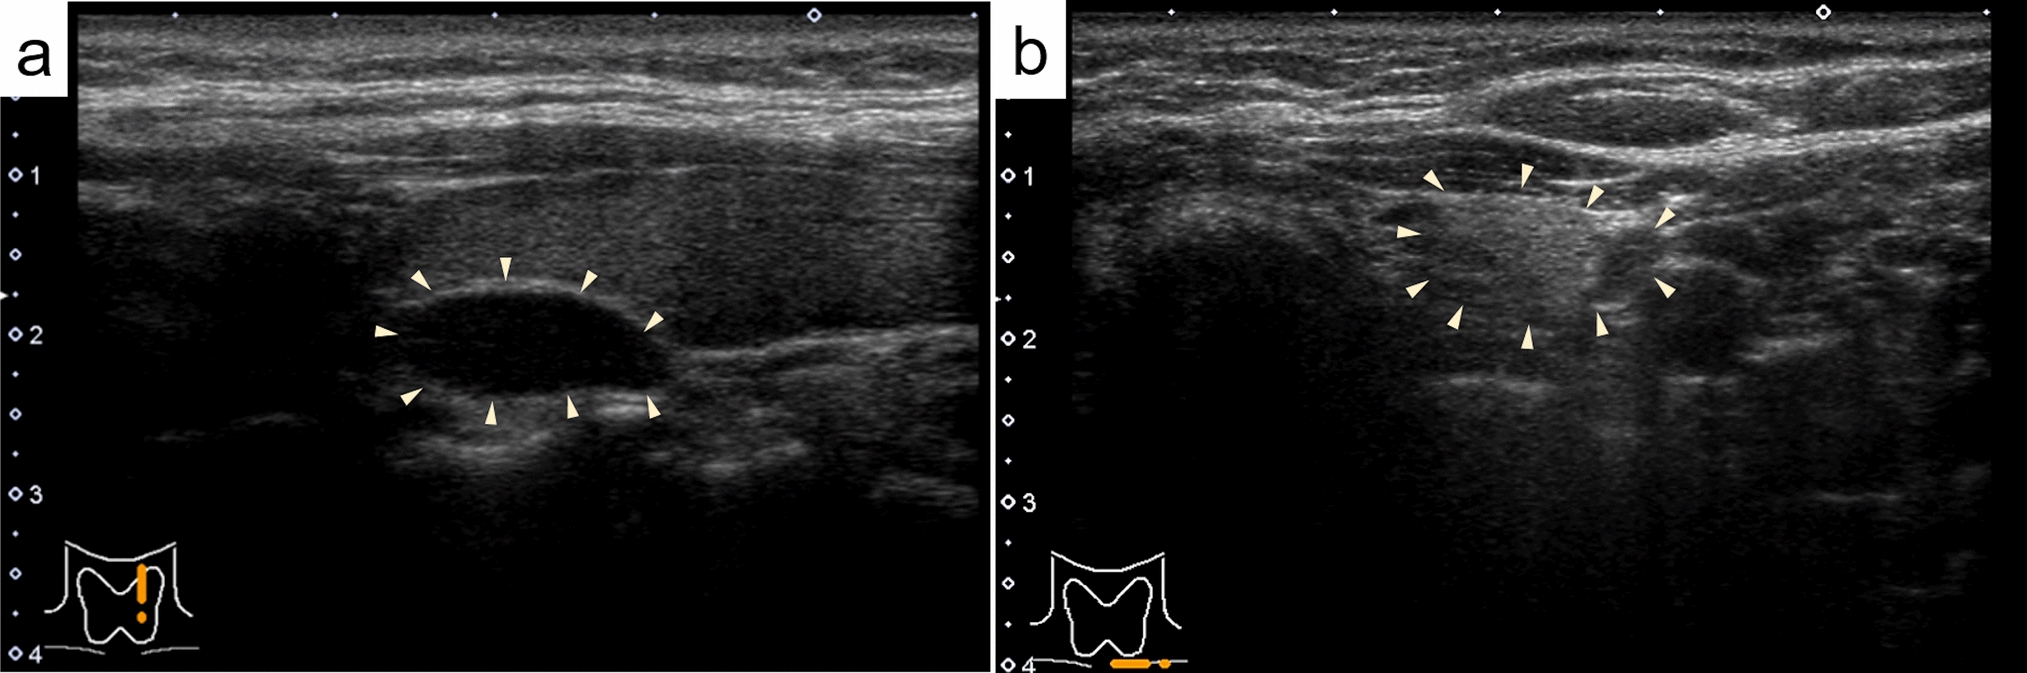
Fig. 2
Examples of ROIs as input images at the same locations: a case of G0 (No. 4 in Table 1), b case of G1 (No. 13 in Table 1), c case of G2-3 (No. 26 in Table 1)
A moment heat map corresponding to the ROIs in the first- and fourth-order moment maps was also created to show the distribution and relationship of each moment. In the heat map, the 2D coordinates were prepared with the fourth-order moment as the vertical axis and the first-order moment as the horizontal axis. The values of the first- and fourth-order moments for each pixel were then plotted in 2D coordinates. Finally, the number of plotted pixels in each grid was indicated in color. Figure 2 shows examples of the heat maps. The distribution and relationship between the first- and fourth-order moments can be evaluated simultaneously and visually using a heat map.
Learning and validation of CNNThe ultrasound images, moment maps, and moment heat maps within the ROIs were classified using a CNN. On average, 256 ROIs per case (7680 ROIs) were randomly selected and used for learning, validating, and testing the network. The pretrained VGG-16 in the Deep Learning Toolbox of MATLAB (The MathWorks, Inc., Natick, USA) was employed for the CNN classification of ROIs based on fatty liver grades. For transfer learning, the last fully connected layer of VGG-16 was replaced for the classification of fatty liver grades G0, G1, and G2-3 (input: 4096, output: 3). The weights of the replaced layers were initialized using random numbers.
In transfer learning, only two fully connected layers and two convolutional layers from the output layer were trained using stochastic gradient descent with a mini-batch processing of 64 data points. The dropout rate between the fully connected layers was set at 75%, and the learning rate was 7.5 × 10⁻⁵\(\:.\) For the four-fold cross-validation, 30 cases were divided into four groups, as shown in Table 2. In the four-fold cross-validation, VGG-16 was trained using the ROIs in Groups 1 and 2. Subsequently, the ROIs in Group 3 were classified for validation using the trained VGG-16 at every epoch. Finally, the ROIs in Group 4 were classified for testing using the trained VGG-16 with a minimum validation loss. All the ROIs were classified for testing by rotating the process. The number of epochs was determined based on the validation losses, and it ranged from 7 to 18. In the proposed method, 87 to 425 ROIs were extracted and classified for each case. Therefore, the fatty liver grade for each case was determined through hard voting of the classified ROIs within the case.
Table 2 Numbers of utilized cases and ROIs for four-fold cross validation
Comments (0)