
Remember me


This cross-sectional study recruited 12 unilateral or bilateral knee OA patients (OA group: mean age 65.0 ± 8.8 years, males n = 7), and 12 young and 12 elderly asymptomatic volunteers as the control groups (elderly group: mean age 59.8 ± 8.0 years, males n = 5; young group: mean age 23.0 ± 1.0 years, males n = 4). All the participants were able to perform daily activities and walk smoothly without support. The exclusion criteria included traumatic knee injuries, surgical treatment for knee problems, and a history of neuromuscular disorders. This study was approved by the Ethical Committee for Epidemiology of Hiroshima University (E-2498-2), and all participants provided appropriate informed consent.
Radiological assessmentsA radiographic examination was performed in all patients with knee OA to assess the severity and varus alignment. Kellgren-Laurence grade (KL) was used to assess severity, and femorotibial angle (FTA) was used to measure varus knee alignment. All evaluations were performed by a single orthopedic surgeon. If the patient had bilateral medial knee OA, the more severe and painful knee was considered the affected side in this study.
Gait analysesA three-dimensional motion analysis system (Vicon Motion Systems, Oxford, UK) and 16 cameras (Vicon Motion Systems, Oxford, UK) were used to obtain kinematical data. Eight force platforms (AMTI, Watertown, Mass) were systematically synchronized with cameras, and kinetic data were measured. The cameras and force platforms had sampling rates of 100 and 1000 Hz, respectively. Before initiating the measurements, the cameras were masked and calibrated to reduce tracking errors and identify the axes of each joint in spatial coordinates. Subsequently, the examiner attached 16 reflective markers to the participant’s bodies at their anatomical landmarks, adopting the standard Plug-in-Gait lower body model (Vicon® Peak, Vicon Motion Systems).
For three trials, the participants were required to walk 5 m straight at a comfortable, self-selected speed. Raw data were filtered with a Butterworth 4th-order filter, with a cutoff frequency of 6 Hz based on the Plug-in-Gait software (Vicon® Peak, Vicon Motion Systems). The stance phase, which is the period from initial contact to toe-off on the ipsilateral leg, was the subject of the analysis section, and normalized to 100 data points. These gait events were recognized using a threshold of vertical ground reaction force (GRF) 20 N. The knee flexion range of motion and its moment were obtained from the spatial coordinates and GRF signal using Nexus 2.14.0 (Vicon Motion Systems). The knee flexion angle range was calculated from the difference in the angle at heel contact and the first peak in the early stance phase. Biomechanical data, including maximum and impulse of knee flexion moment and GRF peaks, were calculated, and knee flexion moment parameters were normalized to body weight. In addition, spatiotemporal parameters such as gait speed were collected by calculating the information from their heel markers.
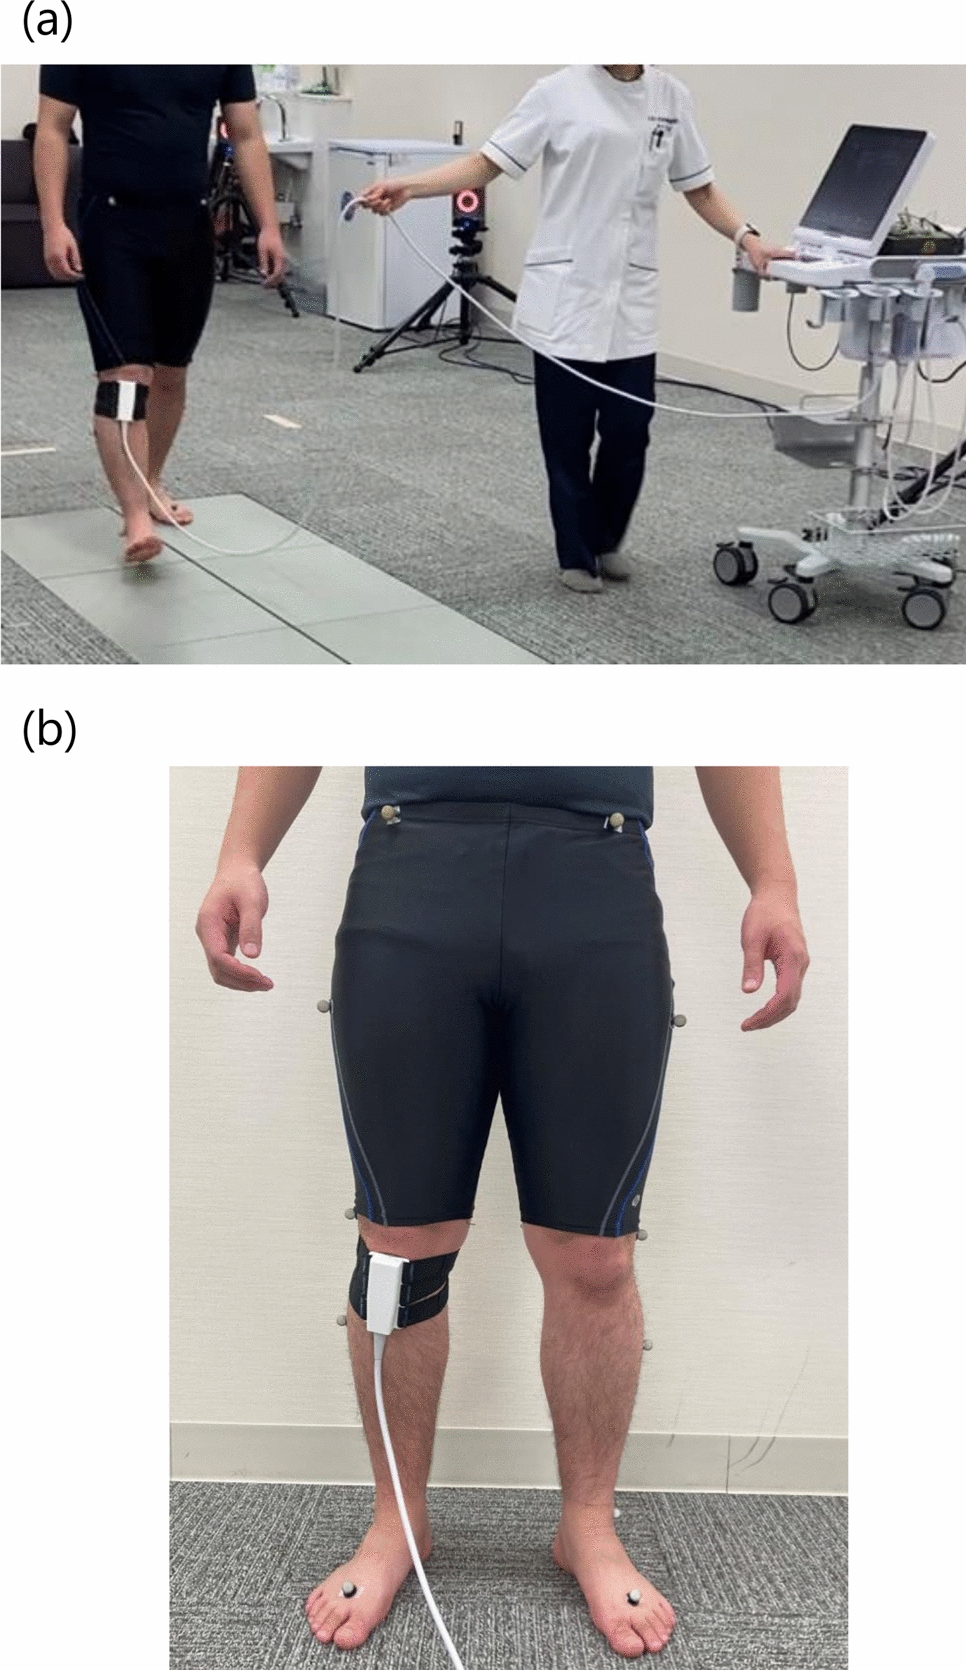
Evaluation of IFP behaviorIFP data during comfortable 5-m walks were obtained using ultrasonography (SNiBLE; KONICA MINOLTA, Japan) with a new prototype linear-array transducer (3–11 MHz) (KONICA MINOLTA, Japan) (Fig. 1a). According to previous studies on the IFP [22], the transducer was placed at the frontal knee surface between tibial tuberosity and under the patella using a flexible belt that can adopt several knee flexion angles (Fig. 1b). In terms of technical aspects, the examiner first confirmed whether the IFP was located between the patellar tendon (PT) and proximal tibia. The participants were then asked to contract their quadricep muscles to observe a straight PT. Through these processes, a clear ultrasound image was obtained (Fig. 2).
Fig. 1
Snapshot of motion analysis during walking (a) and a transducer placed at the frontal knee surface between tibial tuberosity and under the patella (b)
Fig. 2
Representative image of the IFP. Two dotted lines show the undersurface of the PT and tibia cortex. The arrow shows the thickness of the IFP indicated by a perpendicular line drawn from the tendon to the cortex point, 10 mm proximal to the tendon insertion. IFP, infrapatellar fat pad; PT, patella tendon; T, Tibia
Ultrasonography was synchronized with a motion analysis system, and the IFP, kinematics, and kinetic data were simultaneously obtained. The IFP was evaluated in the stance phase on the single gait cycle and recorded in the video mode with a 30 Hz sample rate. Approximately 20 ultrasound images were obtained in a single step. Following a previous study [22], the IFP thickness was defined as a vertical line to the undersurface of the PT from the tibial cortex point, which was located 10 mm proximal to the PT insertion. It was calculated for each image using the Kinovea software (v0.827, Kinovea open-source project), and the IFP waveform was composed of sequential IFP values (Fig. 3). Moreover, the waveform was normalized to 100 data points to compare different numbers of images. The difference between the IFP thickness at initial contact and maximum in the stance phase was calculated as morphological changes in IFP defined as ΔIFP. Eventually, the representative value, which was determined by averaging three random steps, was used in statistical analyses. We also calculated the thickness of the IFP in the supine and standing positions.
Fig. 3
Representative images of IFP dynamics during the stance phase of the single gait cycle (a). The yellow lines show the region of the IFP. The waveform of IFP thickness during the stance phase (b); dashed lines indicate the maximum value and the value at initial contact. ∆ is indicated by arrow between dashed lines. IFP, infrapatellar fat pad
To demonstrate the reliability of the IFP thickness, a preliminary study was conducted by two examiners and included repeated retest trials using eight knees of eight healthy volunteers. The intraclass correlation coefficient (ICC) was used to analyze the intra- and inter-rater reliabilities. Regarding the maximum IFP thickness during walking, ICC (1,3) and ICC (2,3) were 0.942 and 0.890, respectively. Regarding the minimum IFP thickness during walking, ICC (1,3) and ICC (2,3) were 0.930 and 0.737, respectively. Regarding ΔIFP during walking, ICC (1,3) and ICC (2,3) were 0.857 and 0.602, respectively [21].
Statistical analysesDemographic, IFP, and kinematic and kinetic parameters were analyzed using SPSS Version 23 (Released 2015; IBM Corp., Armonk, NY, USA). For each data point, normality was confirmed using the Shapiro–Wilk assay. To compare groups, one-way analysis of variance or the Kruskal–Wallis test was performed, and the Tukey test or Steel–Dwass test was used for multiple comparisons. In addition, correlation analysis using Pearson or Spearman were conducted to investigate the relationship between ΔIFP and gait parameters, including the knee angle and moment. The significance level was set at p < 0.05.
The pos-hoc analyses demonstrated using G*power 3.1.9.7 calculated the significant power to detect the ΔIFP difference between patients with knee OA and healthy elderly volunteers. Effect size and power were 0.86 and 99%, respectively.
Comments (0)