Bioinformatic StudyDatasets
Expression data from the Gene Expression Omnibus (GEO) database of whole human genome arrays [24] and the ArrayExpress Archive of Functional Genomics Data (ArrayExpress) [25], generated using the Affymetrix Human Genome U133 Plus 2.0 platform, were downloaded and processed through the Genevestigator V3 suite (NEBION AG, Zurich, Switzerland) [26]. The microarray data in Genevestigator were normalized at two levels: robust multi-array average within experiments (using the Bioconductor package "affy" and a customized version of the package "affyExtensions") and trimmed mean adjustment to a target for normalization between datasets. For the latter, the trimmed mean is determined by calculating the mean of all the expression values in an experiment (across all samples) after excluding the top 5% and the bottom 5%. The combination of these two levels of normalization makes the data highly comparable across different experiments, thus allowing data pooling without further normalization.
The Genevestigator database was queried in December 2021. We included in the analysis only the arrays for mRNA samples that (1) were not obtained by laser capture microdissection of single cells and (2) were not subjected to in vitro experimental treatments. We extracted and considered data from 1194 arrays of healthy and cancer tissues. The gene expression profile included data of TLR family members in the lung of healthy subjects (HSs) (n = 120 from datasets HS-00017, HS-00217, HS-00554, HS-00571, HS-00576, HS-00649, HS-00826, HS-01187, HS-01269, and HS-01525), in LUAD (n = 813 from datasets HS-00002, HS-00546, HS-00554, HS-00560, HS-00649, HS-00863, HS-01015, HS-01062, HS-01126, HS-01192, HS-01193, and HS-01196), and in LUSC (n = 261 from datasets HS-00002, HS-00546, HS-00560, HS-00649, HS-00863, HS-01062, and HS-01126).
In Silico Gene Expression Analysis
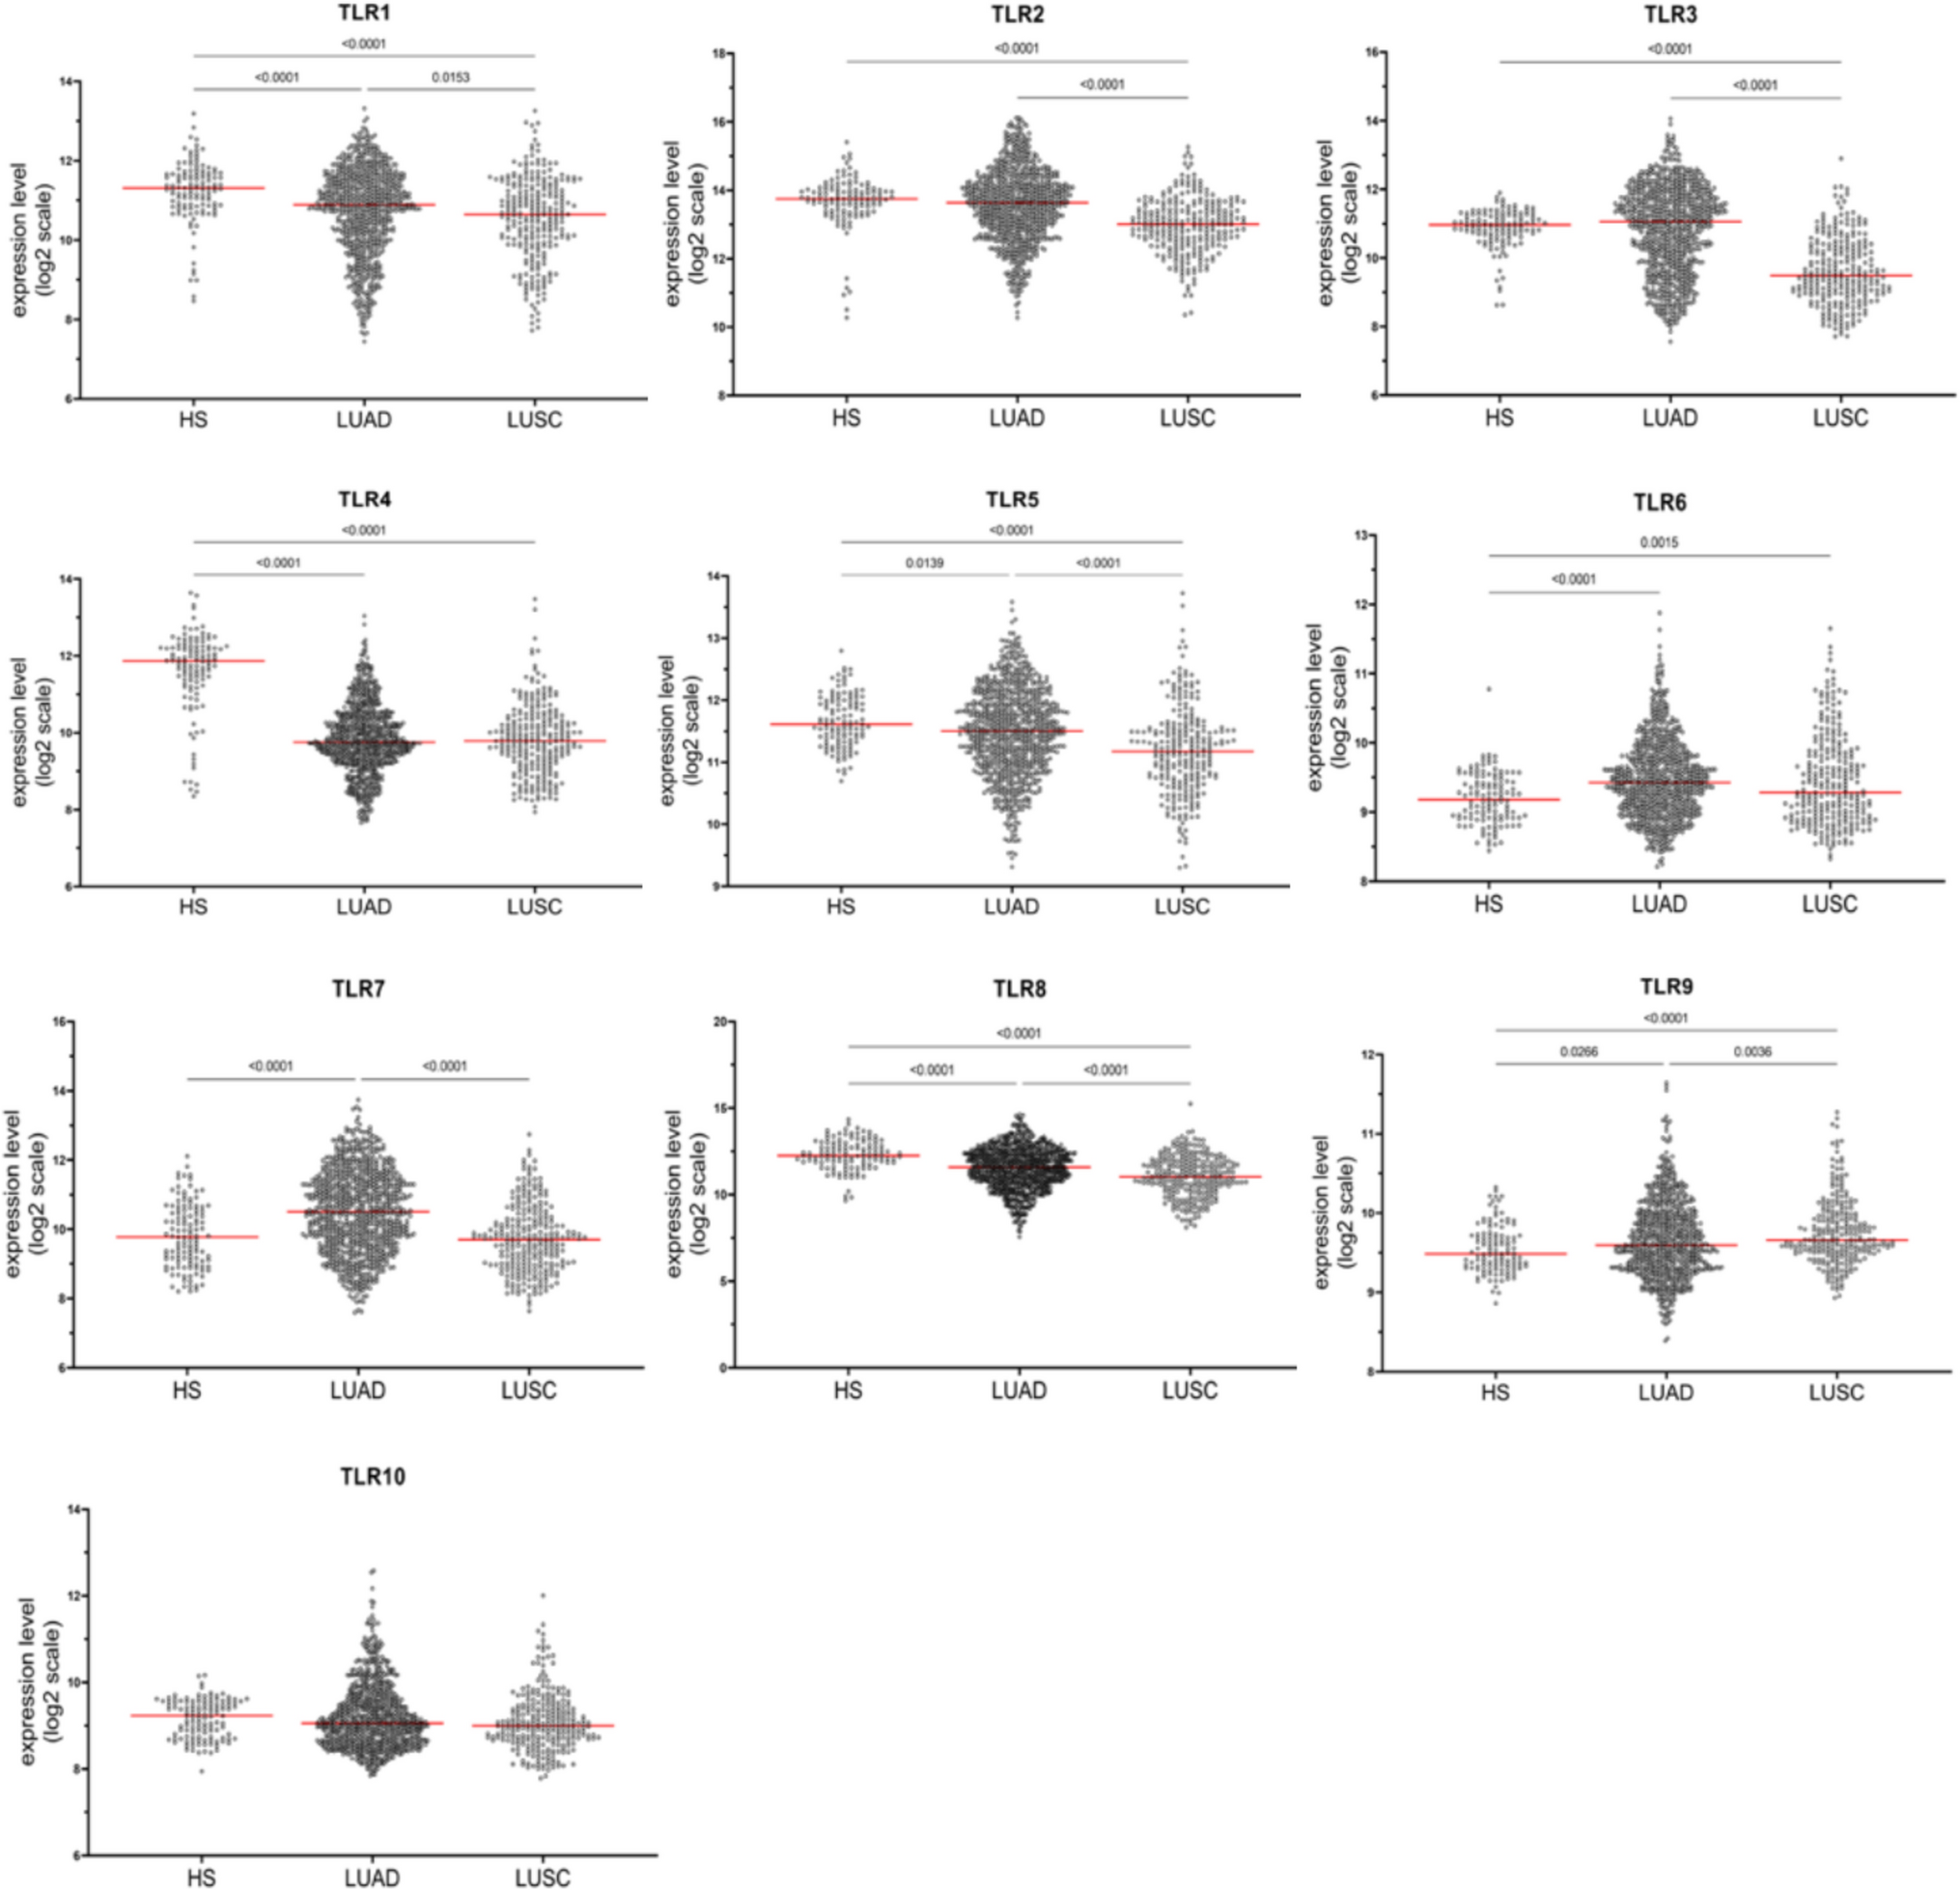
Normalized gene expression data (expressed as log2 values) were downloaded from the Genevestigator V3 suite (NEBION AG, Zurich, Switzerland). TLR family (TLR1, TLR2, TLR3, TLR4, TLR5, TLR6, TLR7, TLR8, TLR9, and TLR10) gene expression was analyzed in lung samples from HSs and in tumor tissue samples from LUAD and LUSC patients.
Survival Analysis
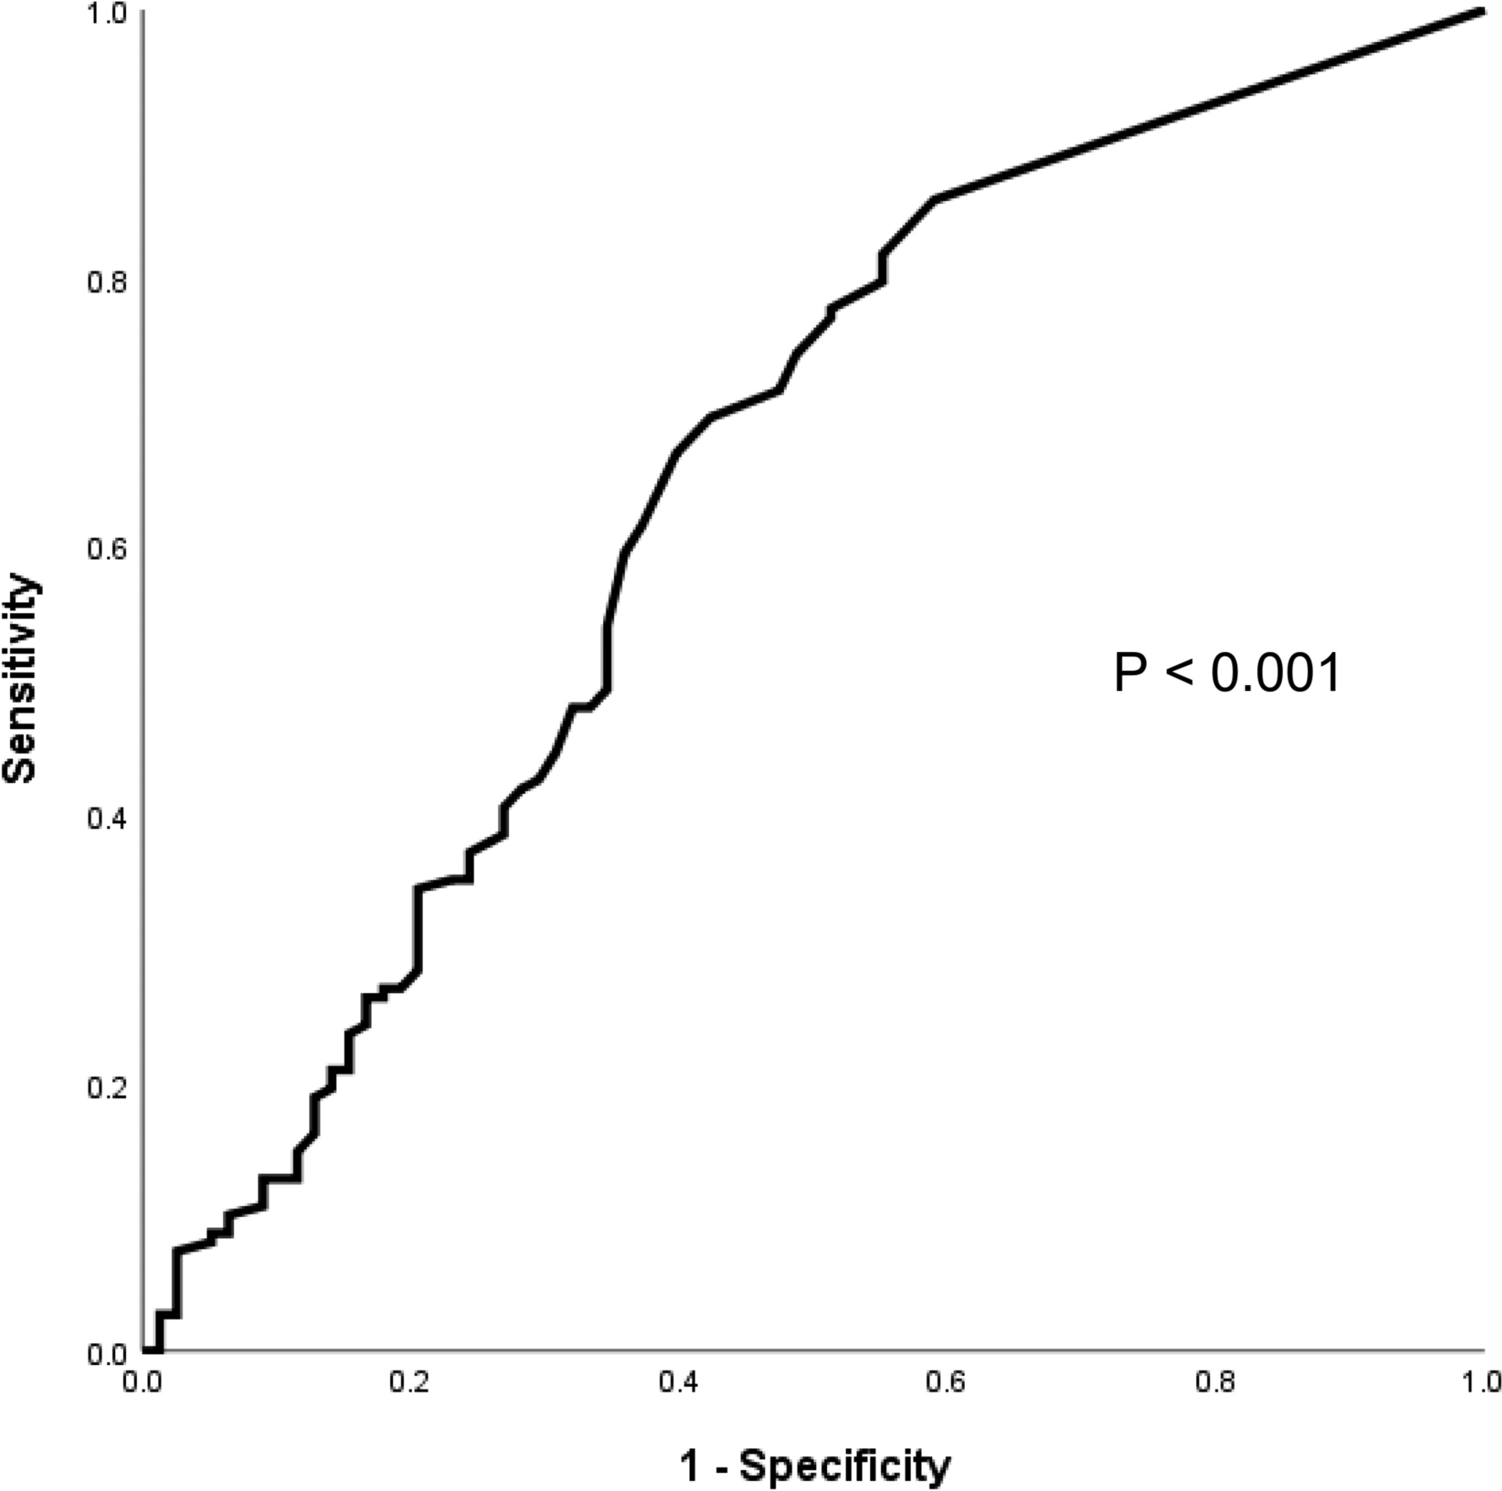
The Gene Expression Profiling Interactive Analysis (GEPIA2) server [27] was employed to investigate the association between TLR gene expression and survival outcomes using gene expression data and corresponding survival information from the TCGA-LUAD (n = 478) and TGCA-LUSC (n = 482) series. Kaplan–Meier curves of overall survival of NSCLC patients were generated with the quartile group cutoff option.
Patient Cohort
In the present study, subjects from the Thoracic Surgery Unit, Department of Surgical Sciences, Santa Maria della Misericordia Hospital, University of Perugia Medical School were enrolled. Written informed consent for the use of blood and tissues along with clinical information for research purposes had been obtained from the donor in compliance with ethical and legal guidelines.
We enrolled patients surgically treated for NSCLC with anatomical resections, and patients with benign non-inflammatory disease as control cases. This is a consecutive series of patients, prospectively enrolled between October 2021 and October 2022. Each patient underwent thorough pre-operative functional evaluation with spirometry, ECG, echocardiography, and emogasanalysis. Clinical staging was performed with total-body CT, PET-CT, brain CT and EBUS when indicated. Pre-operative diagnosis was obtained with endobronchial or transparietal biopsy. Patients with adequate functional condition and clinical stage I-IIIA tumor, according to the VIII TNM staging system, were submitted to anatomical lung resection (lobectomy/bi-lobectomy). None of the patients received neoadjuvant treatment. Patients with recurrent pneumothorax, or pneumothorax with persistent air leak, were treated with lung resection when areas of pulmonary alterations (blebs) were identified.
mRNA Analysis of TLR 4 and 8
TLR4 and 8 were chosen based on significance conducted in previous bioinformatic study.
A total of 40 samples were analyzed by qPCR: 31 cases and 9 control donors. 5 mL of peripheral whole blood were collected via venipuncture into PAXgene Blood RNA Tubes (Qiagen, Valencia, CA, cat. No. 762165) for simultaneous lyses of the blood cells and immediate stabilization of intracellular RNA. Total RNA was isolated and purified by PAXgene Blood RNA commercial kit (Qiagen, Valencia, CAcat. No. 762174). This protocol allowed to immobilize and prevent possible changes to the transcripts in order to obtain reliable gene expression data. RNA concentration and purity were determined using a Nanodrop spectrophotometer (Eppendorf, Amburg—Germany). All RNA samples were immediately stored at − 80 °C until use. The High Capacity cDNA Reverse Transcription Kit (catalogue n. 4368814, ThermoFisher, USA) was used for the cDNA synthesis, according to the manufacturer’s instructions. Per sample, 0.5 µg or 1.0 µg of RNA was used. All cDNA samples were immediately stored at − 80 °C until use. The final volume of RT reaction was 50 µL. TaqMan real-time PCR assays for TLR4 and 8 genes and two reference genes (β-actin and 18S) were selected from the Thermo Fisher Scientific catalogue (Hs01060206_m1 for TLR4; Hs07292888_s1 for TLR8; Hs 01060665_g1 for β-actin; Hs99999901_m1 for 18S). The reference genes were selected for their consistent expression levels in previous experiments conducted with human blood. All reactions were prepared using TaqMan™Gene Expression master mix (catalogue n. 4369016, Thermo Fisher Scientific, USA) and were run with an Applied Biosystem 7500 Real-Time PCR System. Per each reaction, 50 ng of cDNA was used, in a total volume of 20 µL. All samples were run in triplicate. A pre-cycling step (20 at 50 °C + 100 at 95 °C) followed by 40 amplification cycles (15″ at 95 °C + 10 at 60 °C + 10 at 65 °C), were used for all genes. A negative control and a standard curve were included in each plate. Efficiency was calculated generating a standard curve for each assay. Gene expression levels were calculated by using delta-delta Cq method. Data were statistically analyzed with a Mann–Whitney U test and a p value < 0.05 was considered significant.
Immunohistochemical Analysis
A consecutive series of 29 patients with primary operable non–small cell lung cancer was investigated. Histological subtype was assigned based on H&E slides, according to 2021 World Health Organization (WHO) classification for lung tumors.
Nine patients, which underwent a surgical resection for non-neoplastic lung pathology, were recruited as controls. Surgical specimens were formalin-fixed (10% buffered formalin) and paraffin-embedded (FFPE). Sections of 4 µm were taken and placed on slides with a permanent positive charged surface, both to obtain the Hematoxylin and Eosin (H&E) stain and the Immunohistochemical (IHC) stains. The H&E stain was carried out using a Leica ST5020 Multistainer (Leica Microsystems), employing the kit ST Infinity H&E Staining System (Leica Biosystems). All the IHC stains (peroxidase immunoenzymatic reaction with development in diaminobenzinidine) were obtained by employing the BOND-III fully automated immunohistochemistry stainer (Leica Biosystems). For TLR4 immunohistochemical slides were carried out using a heat-induced antigen retrieval with the ready to use BondTM Epitope Retrieval Solution 2 (Leica Biosystems) for 20 min, followed by primary antibody incubation for 30’ with the TLR4 Monoclonal Antibody 76B357.1 (dilution 1:300, Invitrogen-ThermoFisher Scientific). For TLR-8, immunohistochemical slides were carried out using a heat-induced antigen retrieval with the ready to use BondTM Epitope Retrieval Solution 1 (Leica Biosystems, Catalog No: AR9961) for 20 min, followed by primary antibody incubation for 30’ with the TLR8 Monoclonal Antibody 44C143 (dilution 1:2000, Invitrogen-ThermoFisher Scientific).
Appropriate negative and positive control slides were processed concurrently. The immunohistochemical stains for TLR-4 and TLR-8 were evaluated on neoplastic cells as intensity of the stain (evaluated as 0: absent; 1 + : mild; 2 + : moderate; 3 + : intense) and the percentage of the tumor cells labeled. The study protocol received the necessary approval from the Bioethics Committee at the Comitato Etico Aziende Sanitarie (CEAS), Umbria, code TREG001.
Statistical Analysis
Statistical analysis was conducted using Prism v.9.4.1 (GraphPad, San Diego, CA, USA). The Kolmogorov–Smirnov normality test was performed to analyze the distribution of data. p values were calculated using the ordinary one-way ANOVA (Tukey) test for normally distributed data and the Kruskal–Wallis (Dunn) test for data with skewed distributions. p values < 0.05 were considered statistically significant. Descriptive analysis for gene expression experiments were performed for all analyzed genes (TLR4, TLR8, and β-actin) showing main distribution parameters (mean, standard deviation, IQR). The expression levels of TLR4 and8 genes were normalized to the reference gene β-actin using the comparative Ct method. The Delta Ct (ΔCt) values were calculated by the difference between TLR data and corresponding β-actin data for both cases and controls. Subsequently, the Delta Delta Ct (ΔΔCt) values were determined to compare the expression levels between cases and controls and finally the fold change in gene expression was calculated using the formula 2−ΔΔCT for both TLR4 and TLR8 genes. Then a two-sample t-test was conducted to compare the mean fold changes between TLR4 and TLR8. This test determines if there is a statistically significant difference between the two groups for both cases and controls. The Pearson correlation coefficient was calculated to assess the strength and direction of the linear relationship between the fold changes of TLR4 and TLR8. Finally, K-means clustering was applied to the fold change data of TLR4 and TLR8 to identify potential subgroups within the data. The number of clusters was set to 2, and the clustering was performed using the KMeans class from the sklearn.cluster module in python. The results were visualized using a scatter plot, where each point represents a sample, and the color indicates the cluster assignment. Analysis was performed with Rstudio (R version 4.3.2) (R Core Team (2023). _R: A Language and Environment for Statistical Computing_. R Foundation for Statistical Computing, Vienna, Austria. <https://www.R-project.org/> .) and Python 3 (Scikit-learn: Machine Learning in Python, Pedregosa et al., JMLR 12, pp. 2825–2830, 2011.).


Comments (0)