
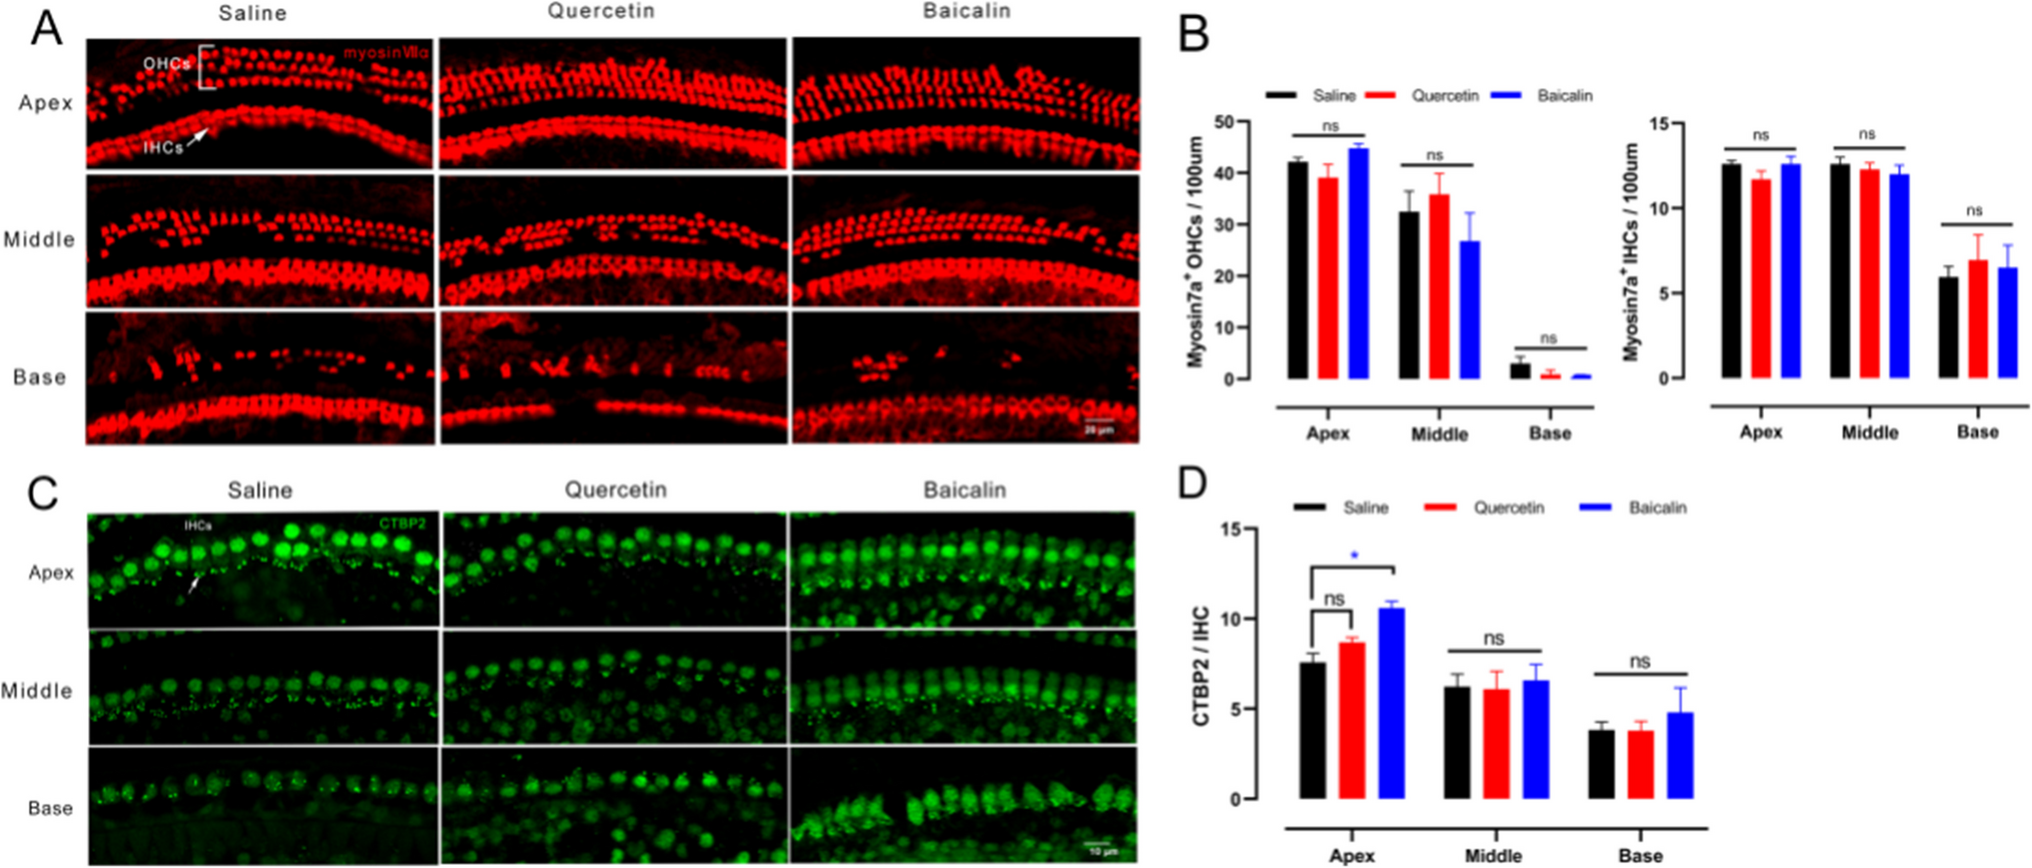
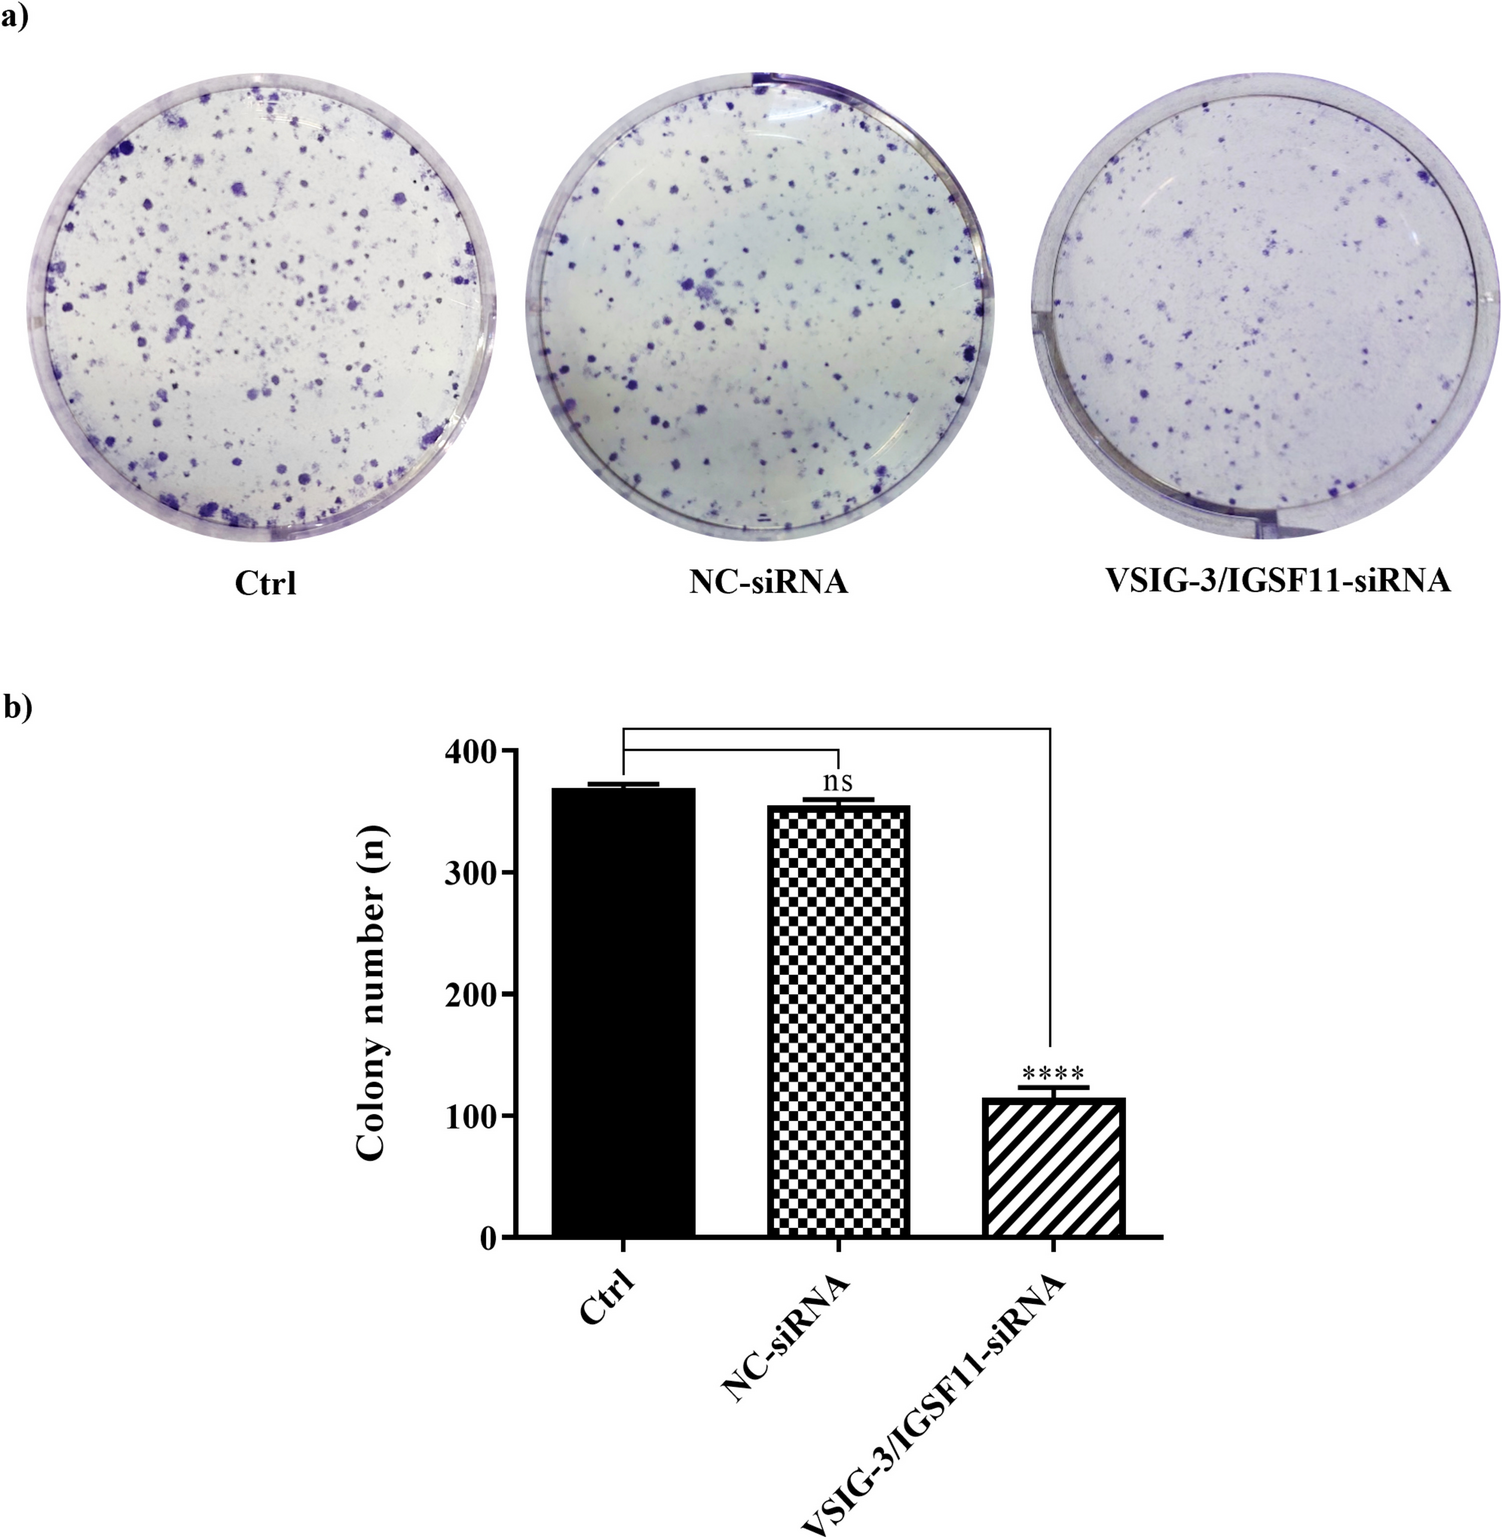
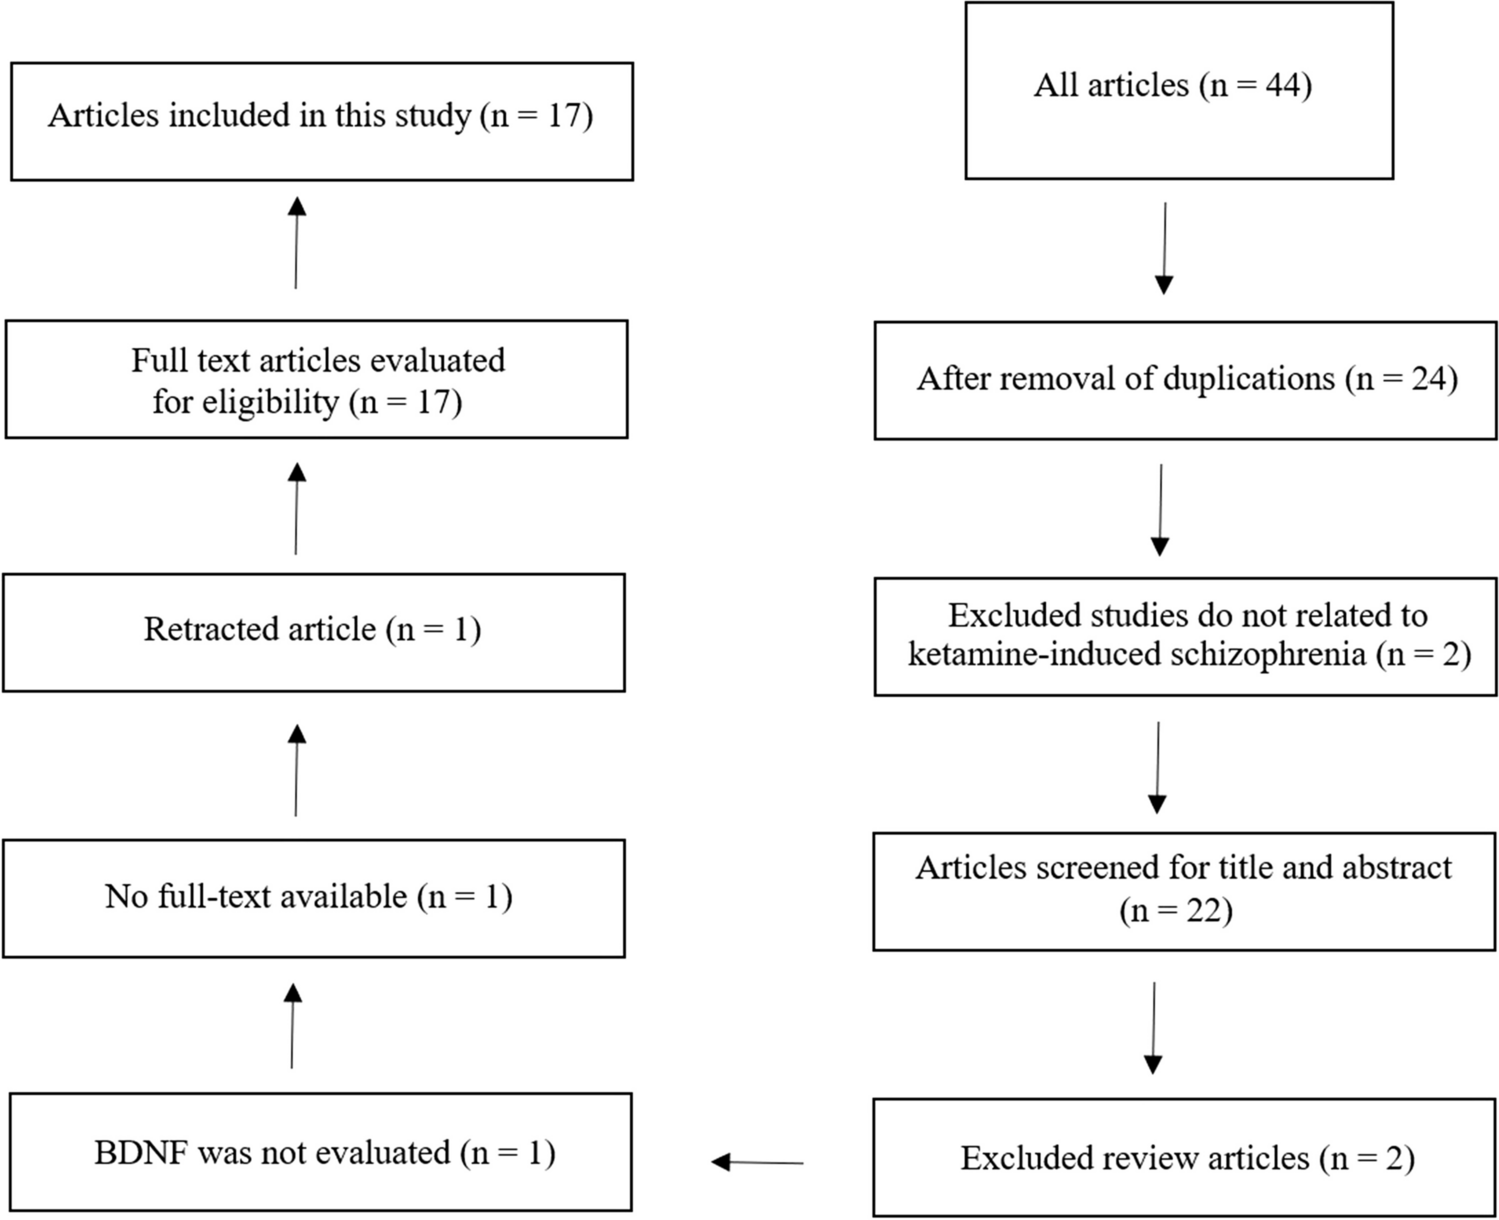
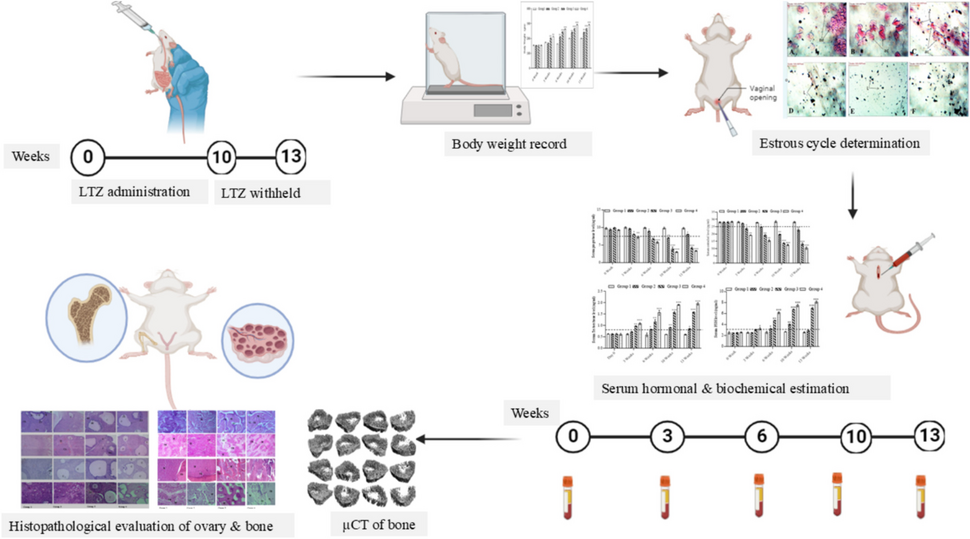
Remember me

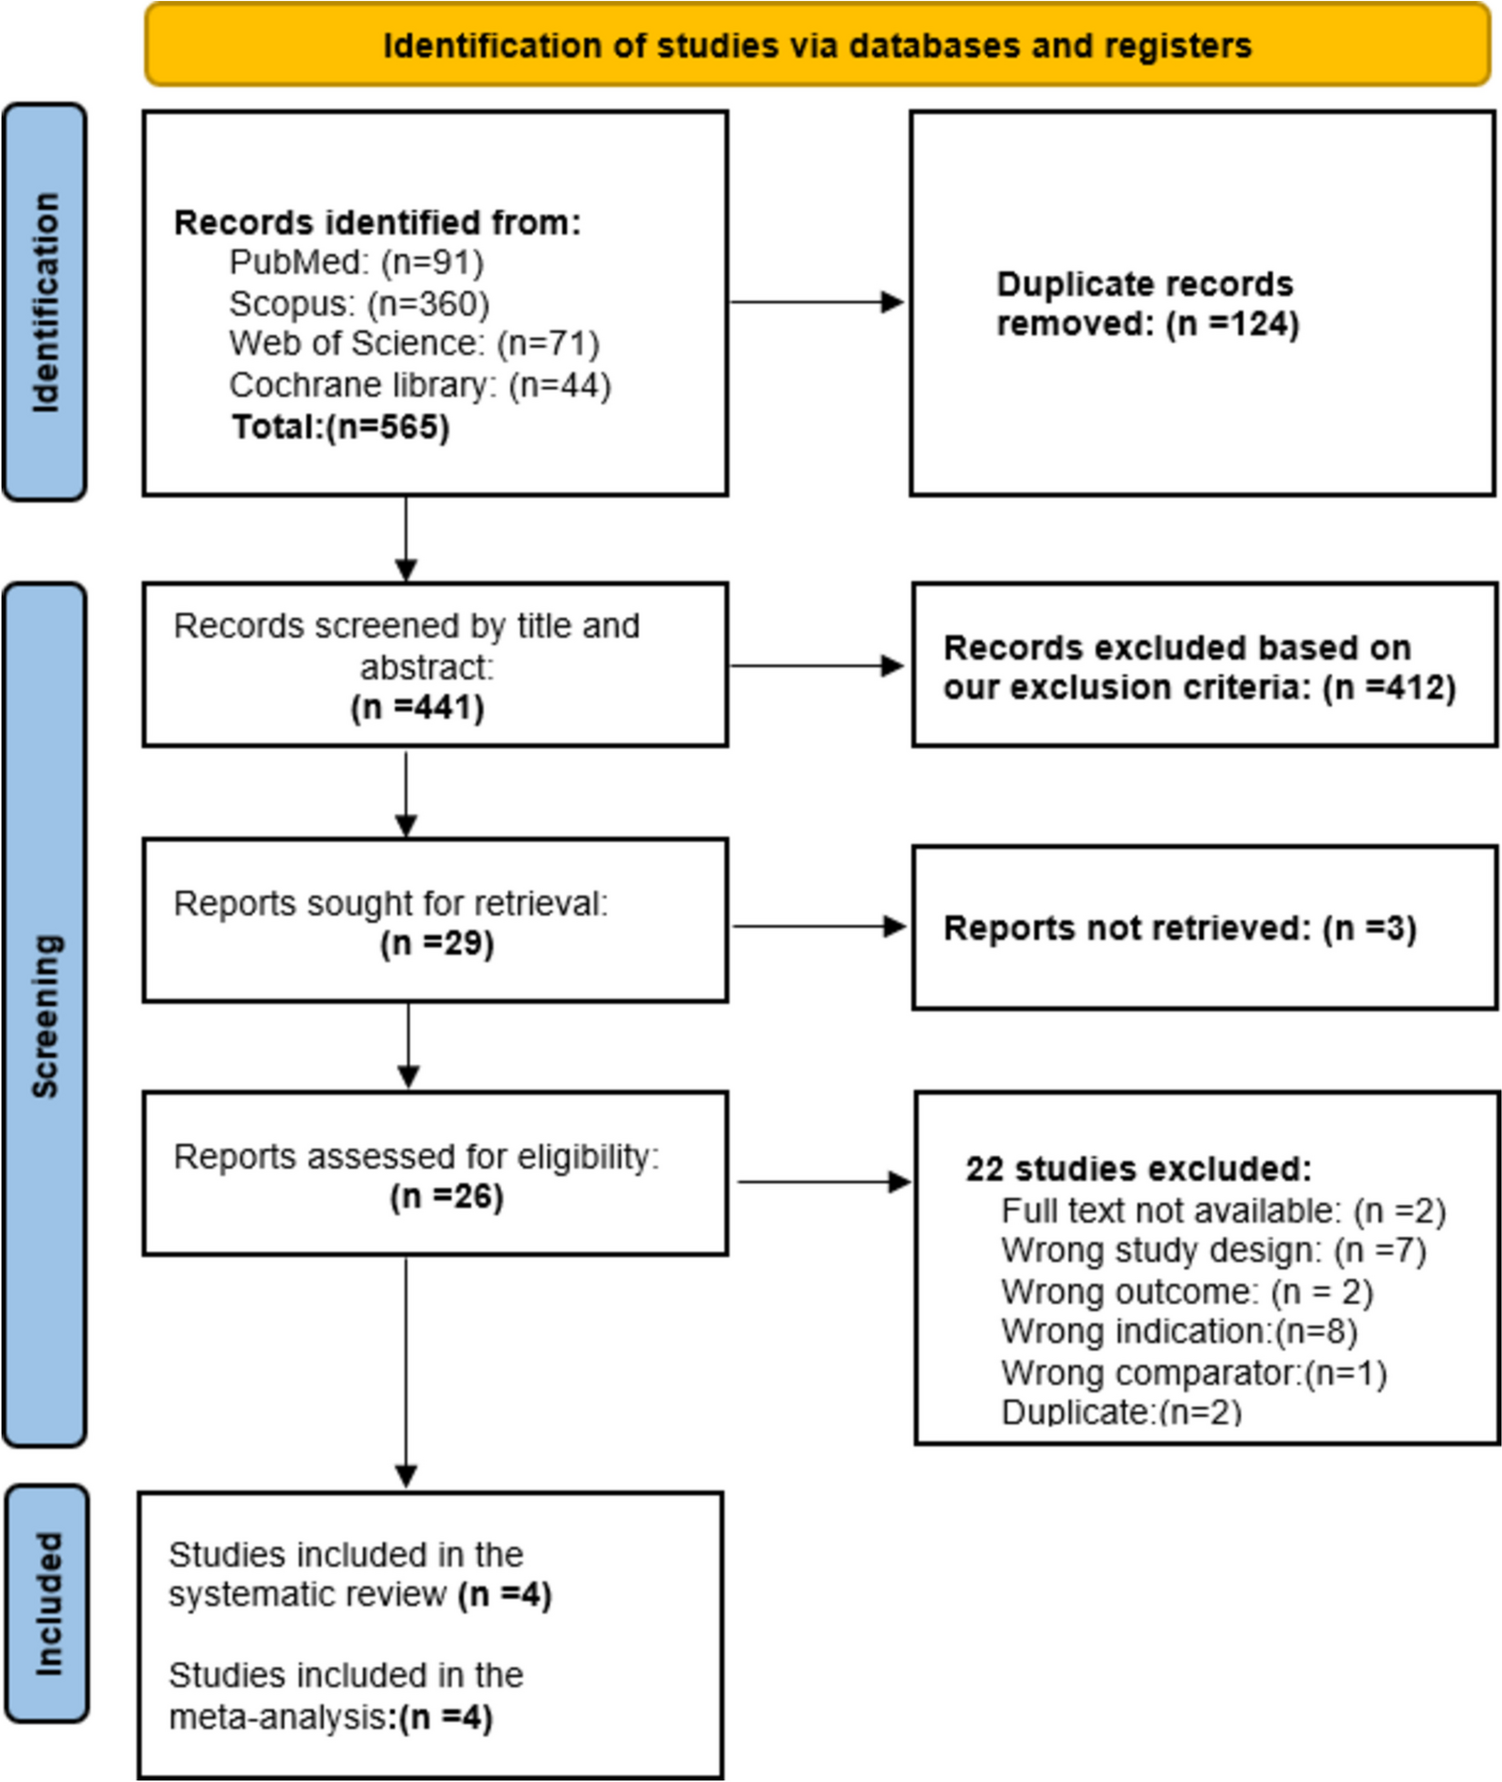

We obtained 565 studies from the search, and Rayyan identified 124 duplicates. After excluding irrelevant articles, 29 articles were eligible for full-text screening. Of these, 4 RCTs were included in this systematic review and meta-analysis. The PRISMA flow diagram of the study selection process is shown in (Fig. 1).
Fig. 1
The PRISMA flow diagram for the included studies
Characteristics of the included studiesAll studies were RCTs where the PTX dose was 400 mg twice daily, except for one study (Farajollahi‑Moghadam et al. 2021), in which patients received 400 mg three times daily. All patients in the studies took PTX in combination with SSRIs, except for one study (Yasrebi et al. 2021), which received PTX as monotherapy. Two studies were conducted in Iran (Merza Mohammad et al. 2024; Yasrebi et al. 2021), one in Egypt (El‑Haggar et al. 2018), and one in Iraq (Farajollahi‑Moghadam et al. 2021). Baseline characteristics and a summary of included studies are shown in Tables 1 and 2.
Table 1 Summary of the included studiesTable 2 Baseline characteristics of the included studiesQuality assessment according to risk of biasA summary and graph of the risk of bias in our included studies are shown in (Fig. 2). Results of the risk of bias assessment showed that the included studies’ quality varies between low risk and some concerns. Some concerns mainly in domain 2 (deviation from intended interventions) due to inappropriate analysis used to estimate the effect of intervention.
Fig. 2
Quality assessments. A According to risk of bias for each study. B According to risk of bias as percentage
Primary outcome (HAM-D)Four studies reported the HAM-D score at four weeks. The overall effect statistically favoured PTX over placebo (MD = –3.06, 95% CI [–3.51 to –2.62], P < 0.00001). The pooled studies were homogeneous (Chi-square P = 0.31, I2 = 16%) (Fig. 3A).
Fig. 3
Forest plot of A HAM-D scores at 4 weeks, B HAM-D scores at primary endpoint, C Response rate, D Remission rate. IV: Inverse-variance, CI: Confidence interval, PTX: pentoxifylline
This is further confirmed by the analysis of HAM-D score at the post-treatment assessment, where the overall effect statistically favoured PTX over placebo (MD = –3.84, 95% CI [–4.87 to –2.81], P < 0.00001). The pooled studies were heterogeneous (Chi-square P = 0.05, I2 = 61%), as shown in the forest plot (Fig. 3B).
As for the response rate, the overall effect of four studies statistically favoured PTX over placebo (RR = 1.69, 95% CI [1.39, 2.06], P = 0.00001). The pooled studies were homogeneous (Chi-square P = 0.74, I2 = 0%), as shown in the forest plot (Fig. 3C).
Three studies reported the remission rate, the overall effect statistically favoured PTX over placebo (RR = 2.09, 95% CI [1.57, 2.77], P = 0.00001). The pooled studies were homogeneous (Chi-square P = 0.99, I2 = 0%), as shown in the forest plot (Fig. 3D).
We conducted leave-one-out sensitivity analysis by excluding one study in each scenario to check the robustness of our findings. The results statistically favoured ondansetron over placebo in each scenario.
Biological markersTwo studies reported the biological markers and the overall effect favoured PTX over placebo in all of them: Serotonin (MD = 20.76 ng/mL, 95% CI [5.49 to 36.04], P = 0.008), BDNF (MD = 10.83 ng/mL, 95% CI [−0.22 to 21.88], P = 0.05), TNF-α (MD = –3.24 pg./mL, 95% CI [–4.12 to –2.36], P < 0.00001), IL-6 (MD = –2.64 pg./mL, 95% CI [–3.79 to –1.48], P < 0.00001), and IL-10 (MD = –1.55 pg./mL, 95% CI [–2.02 to –1.07], P < 0.00001), as shown in the forest plot (Fig. 4).
Fig. 4
Forest plot of biological markers with a random effect model. PTX: Pentoxifylline, IV: Inverse-variance, RR: Risk ratio
El-Hagger et al. (2018) reported a reduction in the biological marker 8-HOdG within the PTX group compared to the placebo group (MD = −0.49, 95% CI [−0.72, −0.26]) (El‑Haggar et al. 2018).
TAM-Mohammed et al. (2024) reported a reduction in CRP within the PTX group compared to the placebo group (MD = −0.53, 95% CI [−0.89, −0.17]) and in IL-1-β within the PTX group compared to the placebo group (MD = −0.61, 95% CI [−0.87, −0.35]) (Merza Mohammad et al. 2024).
Adverse events and side effectsThe pooled analysis of the studies showed no statistically significant difference between PTX and placebo in all reported side effects including Nausea (RR = 1.06, 95% CI [0.55, 2.02], P = 0.87), Vomiting (RR = 0.99, 95% CI [0.51, 1.93], P = 0.97), Headache (RR = 1.07, 95% CI [0.60, 1.90], P = 0.82), Diarrhea (RR = 1.29, 95% CI [0.65, 2.56], P = 0.47), Increased appetite (RR = 1.17, 95% CI [0.57, 2.38], P = 0.67), Dizziness (RR = 1.27, 95% CI [0.61, 2.67], P = 0.53), Insomnia (RR = 0.98, 95% CI [0.44, 2.15], P = 0.95), Fatigue (RR = 1.36, 95% CI [0.53, 3.47], P = 0.53), Abdominal pain (RR = 1.67, 95% CI [0.76, 3.66], P = 0.20), and Sexual dysfunction (RR = 0.75, 95% CI [0.33, 1.70], P = 0.50) (Fig. 5).
Fig. 5
Forest plot of the reported side effects with a random effect model. PTX: Pentoxifylline, IV: Inverse-variance, RR: Risk ratio
Discontinuation rateThere was no significant difference in all causes of discontinuation rate between pentoxifylline and placebo, with a risk ratio of (RR = 0.88, 95% [0.45 to 1.74], (Fig. 6).
Fig. 6
All causes of discontinuation rates. IV: Inverse-variance, CI: Confidence interval
Comments (0)