Cell culture
Rat insulinoma cells, INS-1 823/13 (INS-1, RRID:CVCL_7226) [23] originally obtained from C. Newgard (Duke University, NC, USA), NIT-1 insulinoma cell line (RRID:CVCL_3561) provided by E. Cai (Indiana Biosciences Research Institute, IN, USA) [24] and EndoC-βH1 cells (RRID:CVCL_L909) [25] purchased from Human Cell Design (Toulouse, France) were cultured as described previously but containing 10% EV-depleted FBS (see electronic supplementary material [ESM] Methods for details) [18, 26]. Human pancreatic islets were provided either by the NIDDK-funded Integrated Islet Distribution Program (IIDP) (RRID:SCR _014387) at City of Hope (NIH Grant U24DK098085) or the Alberta Diabetes Institute Islet Core at the University of Alberta in Edmonton (http://www.bcell.org/adi-isletcore.html) with the assistance of the Human Organ Procurement and Exchange (HOPE) program, Trillium Gift of Life Network (TGLN), and other Canadian organ procurement organisations. Islet isolation was approved by the Human Research Ethics Board at the University of Alberta (Pro00013094). All donors’ families gave informed consent for the use of pancreatic tissue in research (n=8, see ESM Human islet checklist), which was cultured as described [18]. To model the inflammatory milieu of type 1 diabetes, cells or human islets were exposed to 2000 U/ml IFN-α, 100 ng/ml human IFN-γ, 5 ng/ml human IL1-β or a cytokine mix of IFN-γ and IL1-β for 24 h. The list of cytokines is provided as ESM Table 1. Approximately 1×10⁷ INS-1 cells, 8×10⁶ EndoC-βH1 cells and 500 human islet equivalents (IEQs) from the same donor or cell passage were seeded and used for each condition for all experiments unless otherwise stated.
EV isolation
Small EVs from cells were isolated from cell culture supernatant fractions using ultracentrifugation, and from human islet medium or plasma using size exclusion chromatography (SEC) as described in ESM Methods [18]. Presence of EVs was verified using nanoparticle tracking analysis (NTA), transmission electron microscopy (TEM) and immunoblot as described in the ESM Methods. Antibodies for immunoblot were selected based on published literature [18]. The PD-L1 antibody underwent additional validation using siRNA-mediated knockdown of PD-L1 (ESM Methods). Distinct band signal of appropriate molecular weight and of intensity proportional to sample dilutions were considered as validation for target detection by immunoblot.
Immunofluorescence
INS-1 or EndoC-βH1 cells were seeded and allowed to attach overnight in a Millicell EZ slide (Millipore Sigma, MA, USA, catalogue no. C86024). Adherent cells were fixed with 4% (vol./vol.) paraformaldehyde (Thermo Fisher Scientific, catalogue no. 043368.9L) for 10 min and blocked with 2% (wt/vol.) BSA (Roche, Basel, Switzerland, catalogue no. 10775835001) and 0.5% (vol./vol.) Triton X-100 (EMD Millipore, MA, USA, catalogue no. 108643) in PBS for 45 min. Cells were incubated with primary antibodies against PD-L1 and CD63/CD9/CD81 (ESM Table 2) overnight at 4°C, followed by incubation with secondary antibodies (ESM Table 2). Nuclear staining was performed with Vectashield mounting medium with DAPI (Vector Laboratories, CA, USA, catalogue no. H-1200-10) and a confocal microscope (LSM800; Carl Zeiss, IL, USA) was used for image analysis.
Surface EV PD-L1 analysis
PD-L1 surface staining was performed using ExoView Exosome Human Tetraspanin Kit (Unchained Labs, CA, USA, catalogue no. 251-1044; EV-TETRA-C) or via flow cytometry (see ESM Methods). ExoView was performed on chips printed with capture antibodies for CD63, CD81 and CD9 according to the manufacturer’s protocol. Briefly, 1×10⁸ to 5×10⁸ EVs/ml was diluted using sample incubation buffer and 50–75 µl of samples were added to the pre-scanned chips and incubated overnight at room temperature. After incubation, chips were washed and incubated with anti-CD9 (Unchained Labs, CA, USA, catalogue no. 251-1044, CF488, 1:500), anti-CD81 (Unchained Labs, catalogue no. 251-1044, CF555, 1:500) and anti-PD-L1 (R&D Systems, MN, USA, catalogue no. FAB1562R, 1:100) for 1 h. Following washing, the chips were imaged using ExoView R200 automated imager (NanoView Biosciences, MA, USA) and analysed using ExoView data analysis software (ExoView Analyzer 3.2).
PD-1/PD-L1 binding assay
Homogeneous time-resolved fluorescence (HTRF) PD-1/PD-L1 Binding Assay Kit (Cisbio Bioassays, France, catalogue no. 64PD1PEG) was used to test the binding of EV PD-L1 from EndoC-βH1, wild-type (WT) HEK293 cells and HEK293 cells overexpressing (OE) PD-L1. The generation of PD-L1-OE cell lines and the binding assay are described in ESM Methods.
Human samples
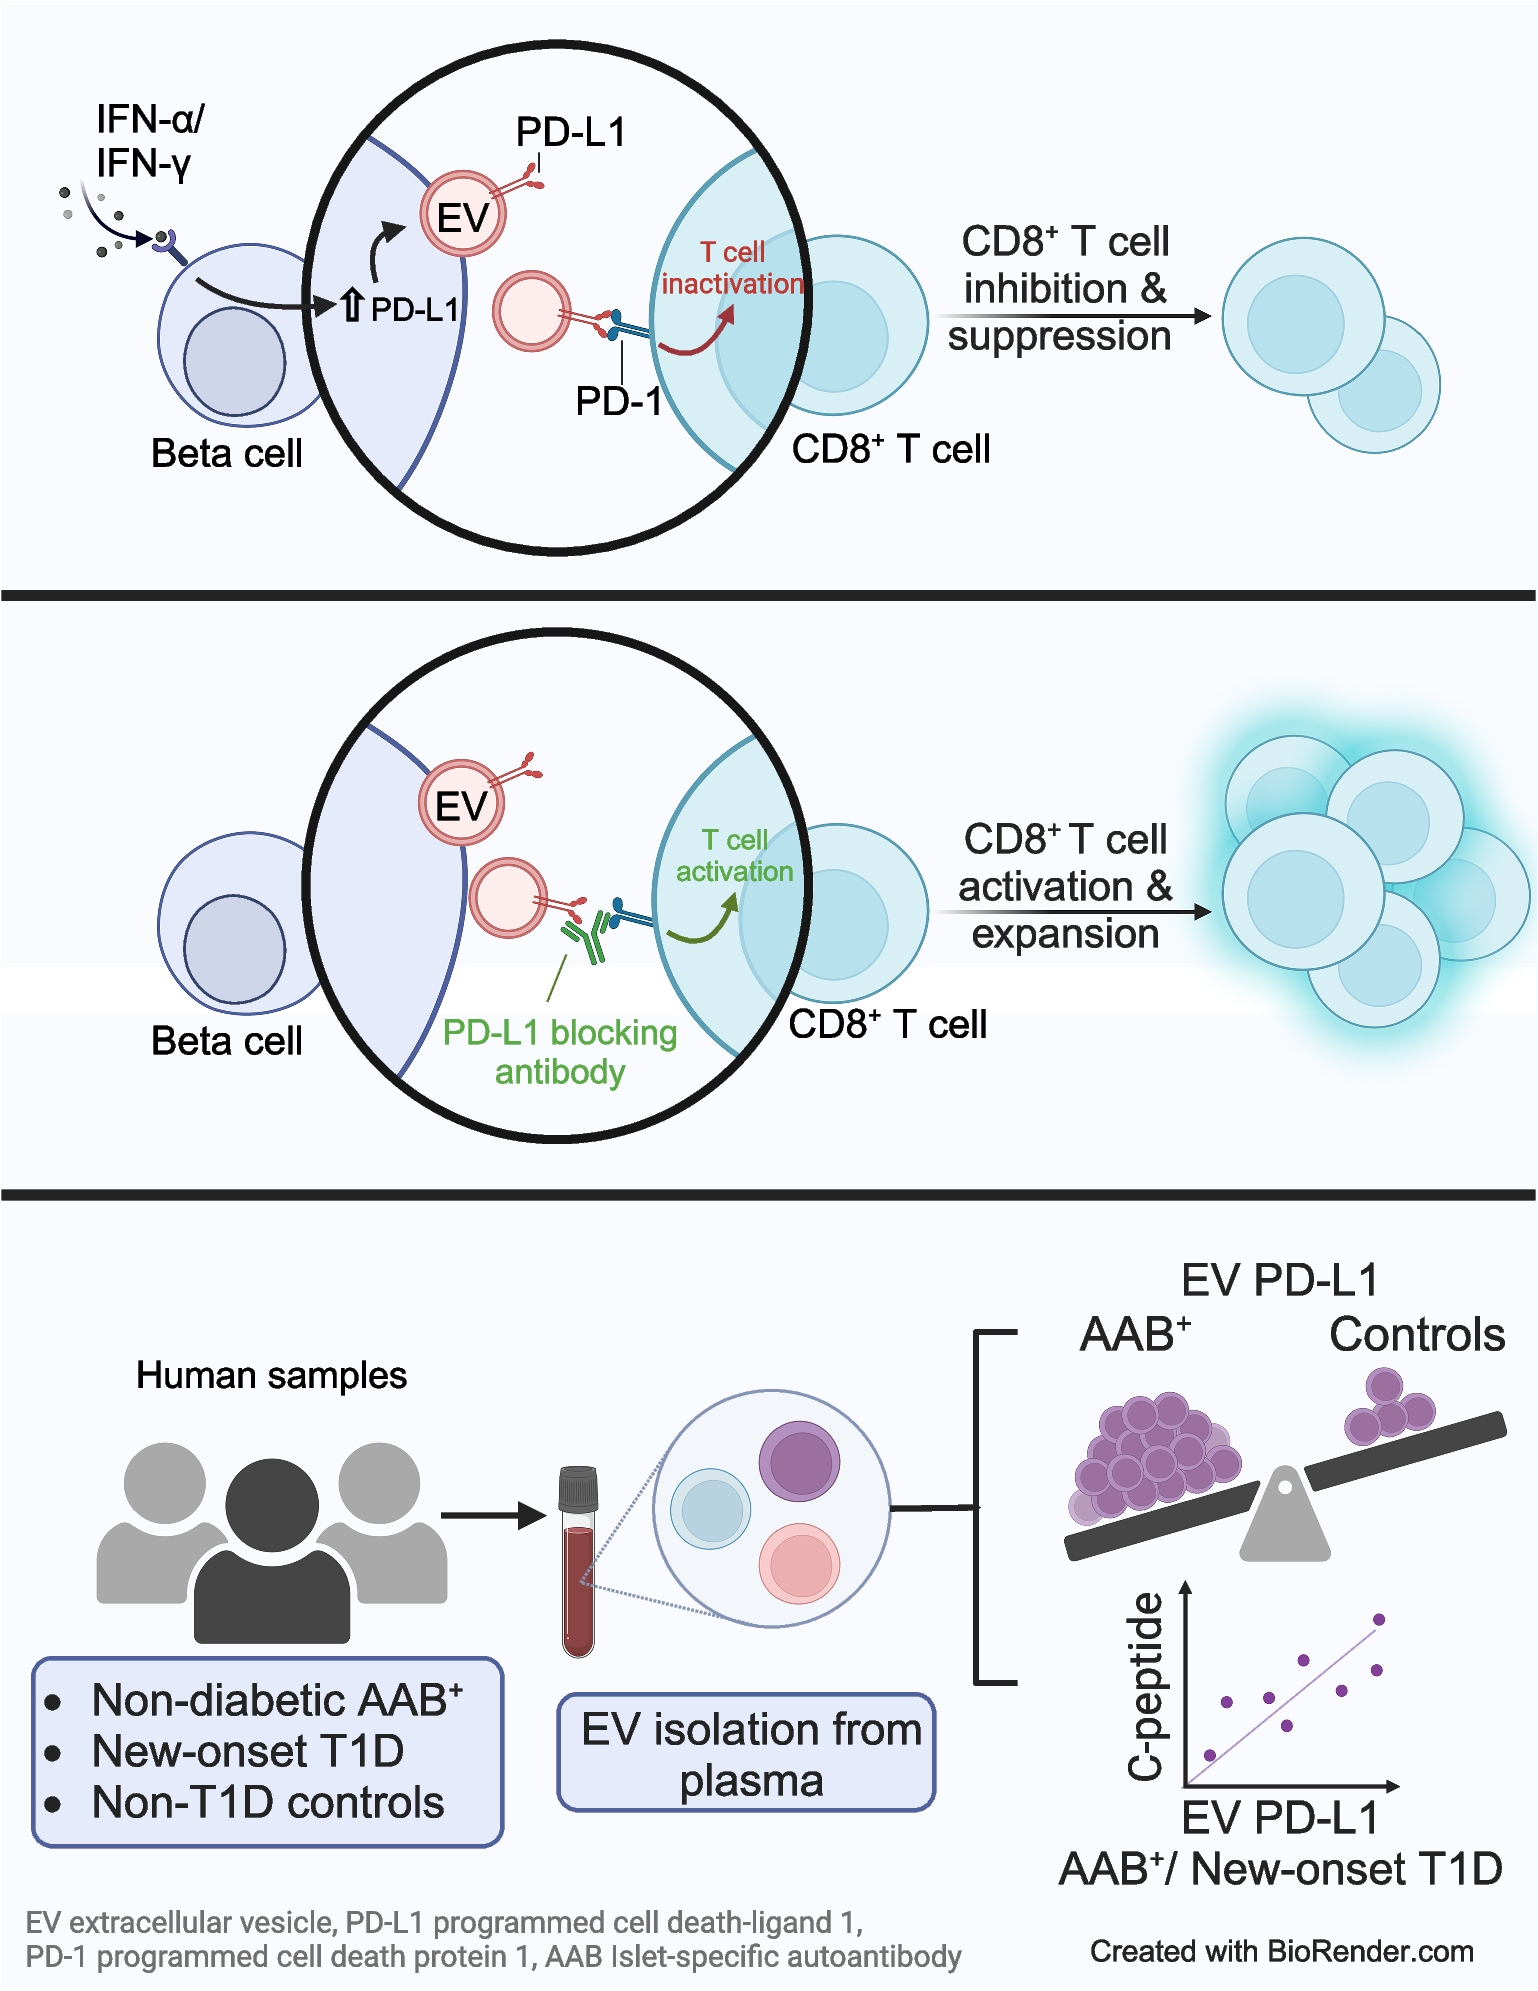
De-identified randomly collected plasma were obtained from the IU biorepository at Indiana University School of Medicine. The samples were collected from 26 children with recent-onset type 1 diabetes and non-diabetic control individuals who were similar in age (±2 years), sex and BMI category. BMI values were within a range of ±3 kg/m2 between matched pairs except for one individual whose BMI was not reported. For the analysis of soluble PD-L1, 34 samples (17 samples from each cohort) were assayed. De-identified randomly collected plasma samples from 16 islet autoantibody-positive (Ab+) individuals and 20 islet autoantibody-negative (Ab−) non-diabetic control individuals were obtained from the IU biorepository at Indiana University School of Medicine, IN, USA. Informed consent (and assent where relevant) was obtained from all individuals. Collections were approved by the Indiana University School of Institutional Review Board and reported investigations have been carried out in accordance with the principles of the Declaration of Helsinki as revised in 2008. Both male and female participants were included in this study. Sex was determined based on self-report by participants at enrolment. We collected and analysed data on participant sex as a biological variable.
Splenocyte isolation and treatment of CD8+ T cells with the EVs
Splenocytes of 7–12-week-old male NOD mice (NOD/ShiLtJ strain; The Jackson Laboratory, USA; https://www.jax.org/strain/001976#) were isolated aseptically as described in ESM Methods. To assess T cell-mediated immune activation, 96-well round-bottom plates (Greiner Bio-One, NC, USA, catalogue no. 650180) were coated with anti-CD3 (0.5 μg/ml; BioLegend, CA, USA, catalogue no. 100202, RRID:AB_312659) and anti-CD28 (1 μg/ml; BD Biosciences, NJ, USA, catalogue no. 553294, RRID:AB_394763) antibodies overnight. Splenic cells (1×10⁶–1.5×10⁶) were cultured with purified NIT-1 WT EVs or PD-L1-OE EVs (see ESM Methods) with or without anti-mouse PD-L1 blocking antibody (Bio X Cell, NH, USA, catalogue no. BE0101, RRID:AB_10949073) or Rat IgG isotype control (Bio X Cell, catalogue no. BE0090, RRID:AB_1107780). Cell Trace Violet (CTV)-labelled cells were analysed by flow cytometry at 24 h, 48 h and 72 h time points to assess CD8+ T cell proliferation. Cells were also stained with eFluor 780 fixable viability dye (eBiosciences, CA, USA, catalogue no. 65-0865-18) and analysed for activation-linked T cell surface markers using the primary antibodies listed in ESM Table 2. Culture supernatant fraction was collected and stored at −80°C for cytokine analysis. Samples were recorded on a Attune NxT Flow Cytometer (Thermo Fisher Scientific, MA, USA) and data were analysed using FlowJo v10 Software (BD Biosciences). The mice were maintained within the Indiana University Laboratory Animal Resource Center under pathogen-free conditions, in accordance with the Guide for the Care and Use of Laboratory Animals. All mice were kept in a standard light–dark cycle with ad libitum access to chow and water. All protocols were approved by the Indiana University School of Medicine Institutional Animal Care and Use Committee.
ELISA
Human islet EV, plasma EV and soluble PD-L1 levels were measured using U-plex Human PD-L1 kit (epitope 1) (Mesoscale Discovery, MD, USA). Plasma C-peptide was measured using the TOSOH immunoassay (TOSOH Biosciences, Tokyo, Japan). EV-splenocyte coculture supernatant fractions were assayed by Mouse Granzyme-B DuoSet ELISA (R&D Systems, MN, USA, catalogue no. DY1865-05) and IFN-γ ELISA (BD Biosciences, NJ, USA). ELISAs were performed according to manufacturers’ protocols and read on a SpectraMax M2 microplate reader (Molecular Devices, CA, USA). All samples were tested in duplicate.
Statistics
Data were analysed with GraphPad Prism 10.0.3 software for MacOS (GraphPad Software, Boston, MA, USA). Significance was assessed by a two-tailed Student’s t test or Mann–Whitney U test (for non-parametric distributions). Pearsons’ correlation analyses were used to measure monotonic relationships. A p value was considered statistically significant when <0.05. Data are presented as mean ± SEM. No samples or analyses were excluded from this study. All data collected were included in the final analysis and reporting of results.


Comments (0)