Construction and validation of the wPRS for YOD
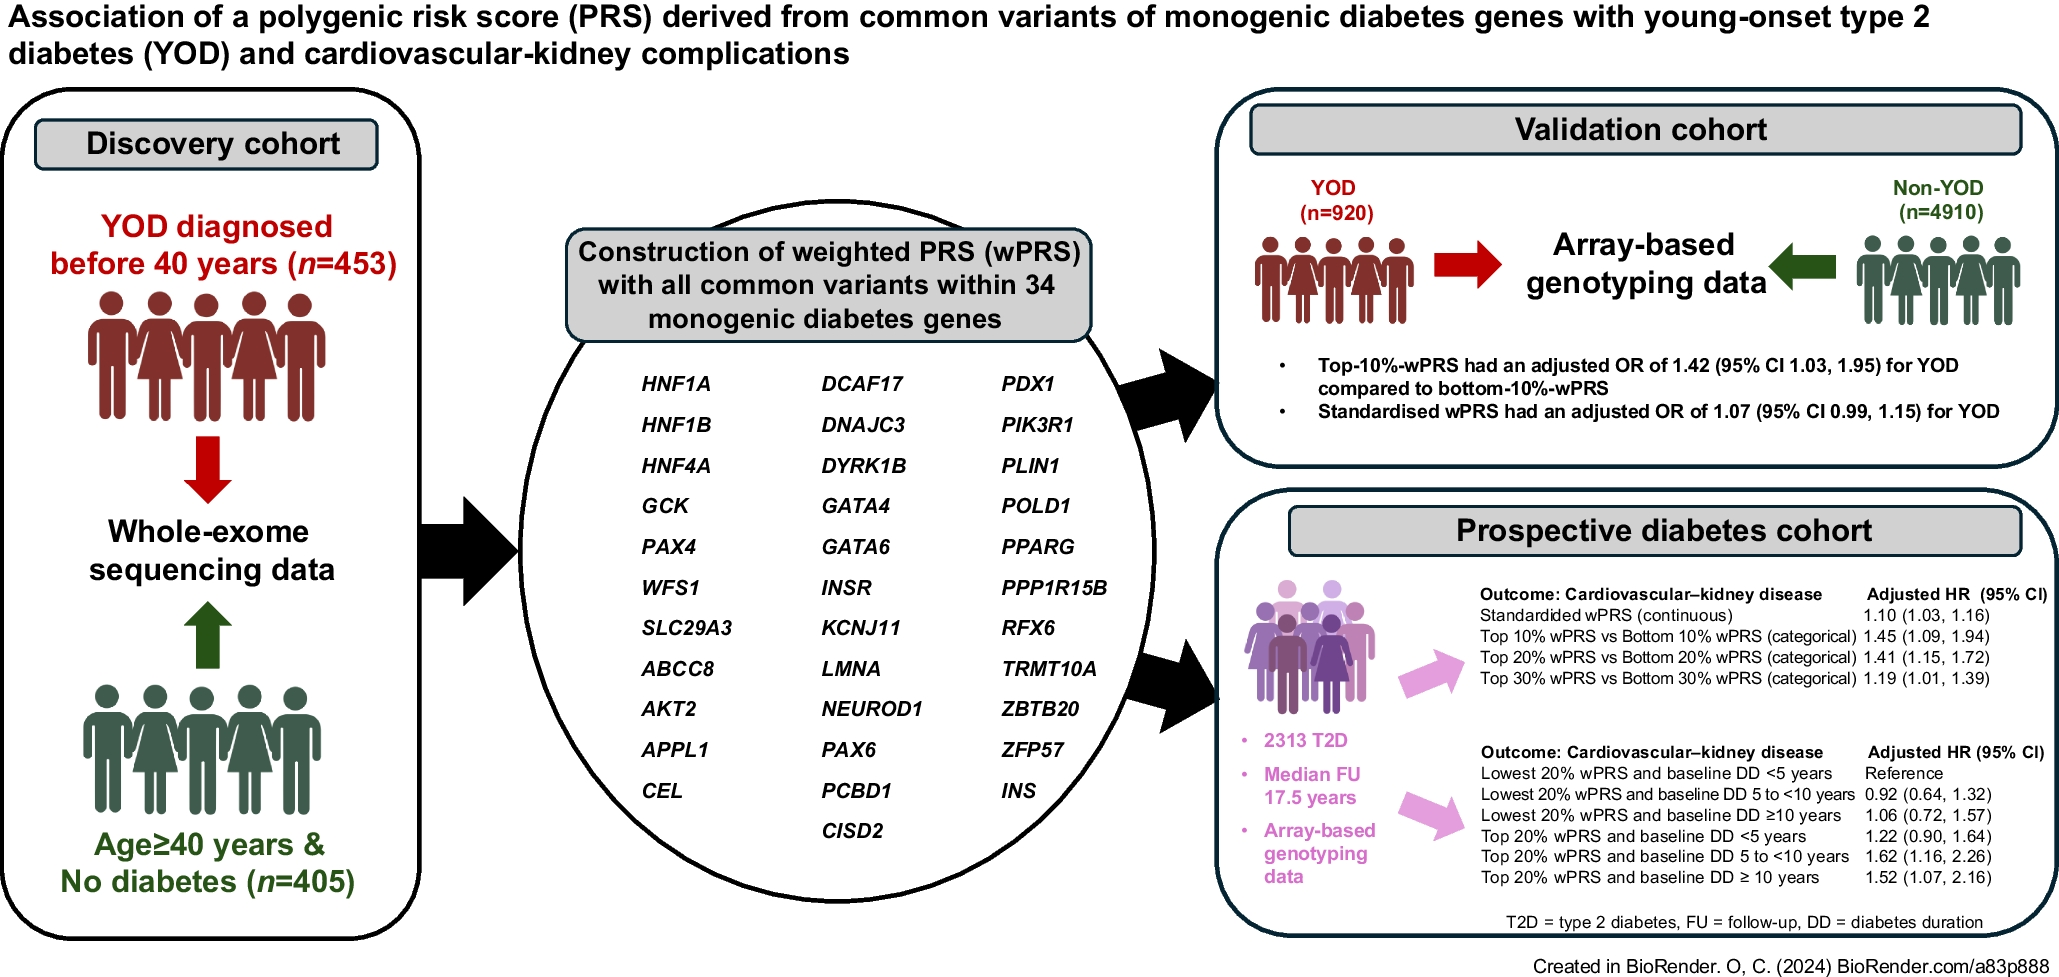
Figure 1 and Table 1 summarise the profiles of the discovery and validation cohorts, and the prospective HKDR cohort at baseline. We analysed the WES data of 453 individuals with YOD from the HKDR (median age 39.7 [IQR 34.9–46.9] years; median age of diagnosis 34.0 [IQR 31.0–38.0] years) and 405 individuals without YOD (non-YOD) from the BHBHK (median age 56.7 [IQR 50.3–61.0] years) and estimated the effect size of each SNP of the 34 MDG for YOD (discovery cohort). Using overlapping genotyping data from the BHBHK, HKFDS and HKDR, we selected 135, 175 and 206 SNPs to construct three wPRS using LD statistics r2 thresholds of 0.2, 0.4 and 0.6, respectively.
Table 1 Baseline characteristics of the discovery, validation and prospective HKDR cohorts
In the validation cohort, all swPRS were positively associated with increased odds for YOD. The wPRS constructed using SNPs with r2<0.2 performed the best, with the swPRS having an unadjusted OR of 1.073 (95% CI 1.00, 1.15, p=0.051) and a sex- and BMI-adjusted OR of 1.07 (95% CI 0.99, 1.15, p=0.074) for YOD (Table 2 and ESM Table 5a). The OR of 1.08 (95% CI 0.94, 1.25, p=0.280) remained similar in a sensitivity analysis with strict inclusion of only those aged ≥40 years with no diabetes as the non-YOD group (ESM Table 5b). Using these SNPs (r2<0.2), the top-10%-wPRS group had 42% higher risk of YOD than the bottom-10%-wPRS group (OR 1.42 [95% CI 1.03, 1.95], p=0.033) while the OR and significance (1.11 [95% CI 0.89, 1.39], p=0.346) were attenuated when comparing top-20% with bottom-20%-wPRS. The wPRS based on LD r2 threshold of 0.2 was therefore used in the subsequent analysis, and the OR of the 135 SNPs for YOD ranged from 1.00 to 2.61 in the discovery cohort (ESM Table 2b).
Table 2 Associations of wPRS, based on LD r2 threshold of 0.2 during selection of SNPs, with YOD in validation cohort of 920 individuals with YOD and 4910 individuals without YOD
Association of the wPRS with incident cardiovascular–kidney events in individuals with type 2 diabetes
In the HKDR, 2313 individuals with no history of cardiovascular–kidney events and albuminuria at baseline (enrolled in 1994–2007) were identified. After a median follow-up of 17.5 (IQR 14.4–21.8) years, there was an accrual of 519 cardiovascular and 882 kidney events. Per-SD increase in wPRS was associated with an HR of 1.10 (95% CI 1.03, 1.16, p=0.003) for cardiovascular–kidney events (Table 3). The top-20%-wPRS group had 41% higher risk than the bottom-20%-wPRS group (HR 1.41 [95% CI 1.15, 1.72], p<0.001) after adjusting for baseline demographics, metabolic control (BMI, HbA1c, systolic BP, triacylglycerol, LDL-cholesterol and HDL-cholesterol), eGFR, use of glucose-, BP- and lipid-lowering drugs, and use of tobacco and alcohol.
Table 3 Associations of wPRS, based on LD r2 threshold of 0.2 during selection of SNPs, with incident cardiovascular–kidney complications in the HKDR cohort of 2313 individuals with type 2 diabetes
Analysis of individual components of cardiovascular–kidney events (Table 3) revealed that the per-SD increase in wPRS was associated with 16% higher risk of CVD (HR 1.16 [95% CI 1.06, 1.27], p=0.001). The top-20%-wPRS group had an HR of 1.87 (95% CI 1.38, 2.52, p<0.001) for a cardiovascular event compared with the bottom-20%-wPRS group. For each component of the cardiovascular events, the swPRS was associated with incident CHD (HR 1.21 [95% CI 1.07, 1.36], p=0.003) but not with stroke (HR 1.00 [95% CI 0.86, 1.16], p=0.99), PVD (HR 1.06 [95% CI 0.80, 1.39], p=0.68) or CHF (HR 1.08 [95% CI 0.89, 1.31], p=0.44) (ESM Table 6). For kidney outcomes, the per-SD increase in wPRS was associated with an HR of 1.09 (95% CI 1.02, 1.16, p=0.013) for CKD, with the top-20%-wPRS group having an HR of 1.34 (95% CI 1.07, 1.66, p=0.010) compared with the bottom-20%-wPRS group (Table 3). The swPRS was not associated with incident ESKD (HR 0.95 [95% CI 0.76, 1.19], p=0.66) (ESM Table 6). There was no significant interaction between disease duration and wPRS (both continuous swPRS and top-20%-wPRS vs bottom-20%-wPRS) for CVD, CKD and combined events.
Association of risk category, stratified by disease duration and wPRS, with incident cardiovascular–kidney events in individuals with type 2 diabetes
We explored the importance of the wPRS relative to diabetes duration (DD) as a risk factor of diabetes-related complications [4]. Per-year increase in baseline DD was independently associated with an HR of 1.014 (95% CI 1.002, 1.025, p=0.020) for cardiovascular–kidney complications in the fully adjusted model (Model 4, Table 3). We stratified the HKDR cohort into six groups by wPRS (top 20% and bottom 20%) and baseline DD (<5 years, 5 to <10 years, and ≥10 years). We compared the risk association of these six groups with incident complications and explored whether those with top-20%-wPRS plus short baseline DD of less than 5–10 years would have comparable or higher risk of complications than the bottom-20%-wPRS plus long baseline DD ≥10 years group.
By Kaplan–Meier estimation (ESM Fig. 2, p<0.01 in all logrank tests), the ‘top-20%-wPRS plus baseline DD<5 years’ group with a median age of 49.0 (IQR 42.7–59.2) years had a cumulative incidence of 27% for CVD after 20 years, compared with 22% in the ‘bottom-20%-wPRS group plus baseline DD≥10 years’ group with a median age of 59.3 (IQR 51.2–63.8) years. Similarly, 55% and 66% of the ‘top-20%-wPRS plus baseline DD 5 to <10 years’ group with a median age of 54.5 (IQR 47.3–62.4) years developed CKD and cardiovascular–kidney events after 20 years, respectively, compared with 46% and 53% in the ‘bottom 20%-wPRS plus baseline DD≥10 years’ group. However, the ‘top-20%-wPRS plus baseline DD<5 years’ group had a lower cumulative incidence of CKD (38%) and cardiovascular–kidney events (47%) than the ‘bottom 20%-wPRS plus baseline DD≥10 years’ group after 20 years.
Tables 4 and 5 show the unadjusted and adjusted HRs, respectively, for cardiovascular–kidney disease and its components in the six groups. ESM Fig. 3 shows the associated one-minus-survival function curves. Using Cox regression with the ‘bottom-20%-wPRS plus baseline DD<5 years’ group as the referent, the ‘top-20%-wPRS plus baseline DD<5 years’ group had an unadjusted HR of 1.87 (95% CI 1.23, 2.85, p=0.003) for CVD vs 1.43 (95% CI 0.81, 2.54, p=0.217) in the ‘bottom-20%-wPRS plus baseline DD≥10 years’ group. The ‘top-20%-wPRS plus baseline DD 5 to <10 years’ group had an unadjusted HR of 1.62 (95% CI 1.15, 2.28, p=0.006) and 1.60 (95% CI 1.17, 2.19, p=0.003) for CKD and cardiovascular–kidney disease, respectively, vs 1.29 (95% CI 0.86, 1.92, p=0.216) and 1.38 (95% CI 0.97, 1.98, p=0.075) in the ‘bottom-20%-wPRS plus baseline DD≥10 years’ group. The ‘top-20%-wPRS plus baseline DD<5 years’ group had unadjusted HR of 1.04 (95% CI 0.76, 1.42, p=0.812) and 1.11 (95% CI 0.84, 1.46, p=0.471) for CKD and cardiovascular–kidney events, respectively.
Table 4 Association of risk categories based on DD at baseline and wPRS with cardiovascular–kidney disease in prospective HKDR (unadjusted)Table 5 Association of risk categories based on DD at baseline and wPRS with CVD in prospective HKDR (adjusted for covariates)
The results were similar after adjusting for baseline covariates. The ‘top-20%-wPRS plus baseline DD<5 years’ group had an adjusted HR of 2.08 (95% CI 1.34, 3.24, p=0.001) for CVD compared with 1.28 (95% CI 0.70, 2.34, p=0.427) in the ‘bottom-20%-wPRS plus baseline DD≥10 years’ group. The ‘top-20%-wPRS plus baseline DD 5 to <10 years’ group had an adjusted HR of 1.63 (95% CI 1.12, 2.36, p=0.010) and 1.62 (95% CI 1.16, 2.26, p=0.005) for CKD and combined cardiovascular–kidney disease, respectively, compared with 1.00 (95% CI 0.65, 1.54, p=0.986) and 1.06 (95% CI 0.72, 1.57, p=0.752) in the ‘bottom-20%-wPRS plus baseline DD≥10 years’ group. (The ‘top-20%-wPRS plus baseline DD<5 years’ group had an adjusted HR of 1.13 (95% CI 0.81, 1.57, p=0.478) and 1.22 (95% CI 0.90, 1.64, p=0.196) for CKD and cardiovascular–kidney events, respectively.)
We repeated the analysis by restructuring the ‘bottom-20%-wPRS plus baseline DD≥10 years’ as the reference group where the ‘top-20%-wPRS plus baseline DD 5 to <10 years’ group had an adjusted HR of 1.62 (95% CI 1.04, 2.53, p=0.033) and 1.52 (95% CI 1.02, 2.27, p=0.040) for CKD and cardiovascular–kidney disease, respectively, while the ‘top-20%-wPRS plus baseline DD<5 years’ group had an adjusted HR of 1.63 (95% CI 0.93, 2.87, p=0.089) for CVD, with borderline significance.
Secondary analysis: association of the wPRS with beta cell function and incident diabetes in people without diabetes in the BHBHK-HKFDS
We examined the associations of the wPRS with beta cell function and 12 year risk of incident diabetes in the BHBHK-HKFDS. swPRS were negatively associated with beta cell function indices and positively associated with risk of incident diabetes with an adjusted OR of 1.37 (95% CI 0.89, 2.12, p=0.150), albeit short of significance (ESM Table 7a).


Comments (0)