
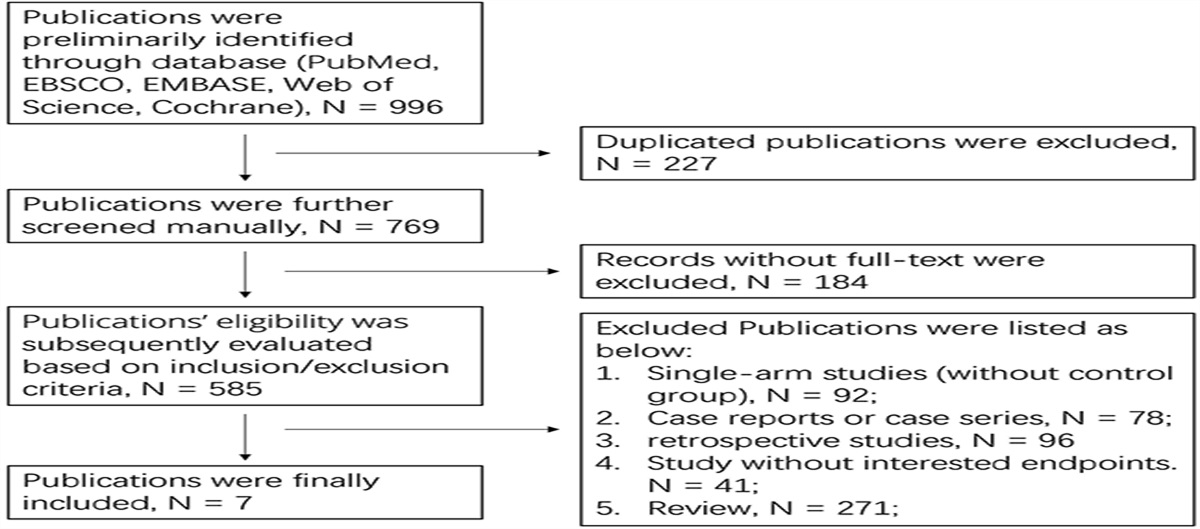
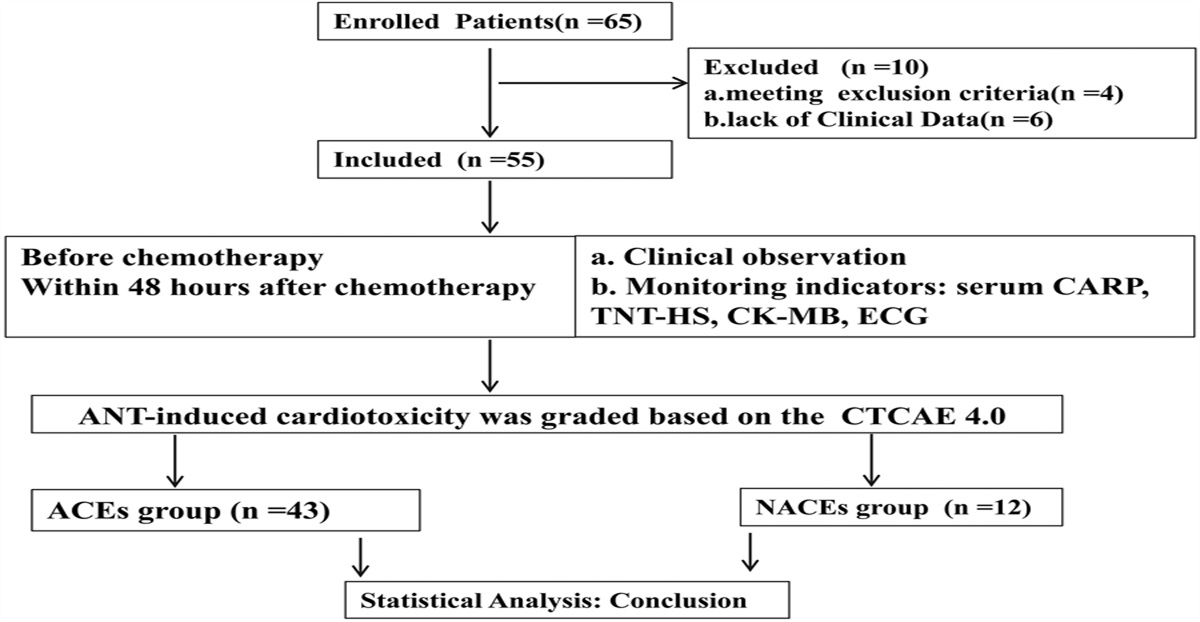
記住我
Hypertension, diabetes, and aging are the leading causes of chronic kidney disease (CKD) and end-stage renal disease (ESRD).1,2 Regardless of the initial etiology, the progression of CKD ultimately results from the accumulation of extracellular matrix (ECM), which replaces functional parenchyma leading to glomerulosclerosis, renal interstitial fibrosis, tubular atrophy, and loss of kidney function. Pathological fibrosis also involves inflammation, activation, and migration of myofibroblasts, matrix deposition, and remodeling. Current therapies that slow the progression of CKD target the underlying risk factors of hypertension and/or diabetes. However, despite strict control of blood pressure, glucose levels, and blockade of the renin-angiotensin system, the number of patients with ESRD is still increasing.3 Thus, there remains a tremendous need to identify novel therapeutic targets and more effective therapies that arrest and possibly reverse the progression of CKD.
Matrix metalloproteinases (MMPs) are zinc-dependent endopeptidases that degrade extracellular matrix (ECM) proteins, but they also release and activate many cell adhesion molecules, cytokines, growth factors, and their receptors.4–7 Several lines of evidence indicate that MMPs play an important role in the remodeling of ECM and basement membrane, immune infiltration, and cell proliferation, and epithelial-mesenchymal transition (EMT), and that activation of MMPs has been linked to the development of renal disease.5,8 Our group has reported that the renal expression of MMP-2 and TGF-β increases early in the development of hypertension in Dahl salt-sensitive (SS) and Fawn hooded-hypertensive rats and in diabetic type-2 diabetic nephropathy (T2DN) and streptozotocin (STZ)-induced type-1 diabetic SS rats.9–11 Administration of XL-784, a broad-spectrum MMP inhibitor, reduced proteinuria and renal fibrosis in hypertensive SS rats and T2DN rats.11 However, the MMP isoforms involved and the mechanisms of renoprotection remain to be determined.
MMP2 has been implicated in the pathogenesis of renal disease in humans and animal models. MMP2 expression and activity are elevated in the serum and urine of diabetic patients and in diabetic animal models.12,13 Overexpressing MMP2 in the proximal tubule of transgenic mice resulted in the loss of tubular basement membrane integrity, tubular atrophy, and renal fibrosis that recapitulates many of the characteristics of human CKD.14,15 In addition, unilateral ureteral obstruction–induced renal fibrosis and ischemia–reperfusion renal injury were significantly reduced in MMP2 knockout (KO) mice.16–18 However, the contribution of MMP2 to the development of hypertension and diabetes-induced renal disease has not been established because of the lack of MMP2 KO strains of mice susceptible to hypertension or diabetic nephropathy and effective, isoform-specific MMP inhibitors.
The SS rat is a genetic rodent model that, unlike C57BL/6 mice and Sprague Dawley and Wistar rats, is highly susceptible to hypertension and STZ-induced diabetic renal disease and exhibits many traits associated with hypertension and diabetic nephropathy in humans.19–22 Therefore, we created an MMP2 KO strain on SS genetic background using zinc-finger nucleases (ZFN) to determine the role of MMP2 in the development of hypertensive and diabetic nephropathy.
METHODS GeneralExperiments were performed using 9- to 12-week-old male SS and MMP2 KO rats. The SS and MMP2 KO rats were obtained from an in-house colony of heterozygous MMP2 KO rats that were originally generated at the Medical College of Wisconsin. The animals were housed in the Animal Care Facility at the University of Mississippi Medical Center, which is approved by the American Association for the Accreditation of Laboratory Animal Care. The rats had free access to food and water throughout the study. The rats were maintained on a low-salt (LS) diet containing 0.3% NaCl (Envigo Teklad 7034; Envigo, Indianapolis, IN). All protocols were approved by the Institutional Animal Care and Use Committee of the University of Mississippi Medical Center.
Generation of MMP2 KO RatsZinc finger nuclease (ZFN) technology was used to create the MMP2 KO rats on the SS genetic background (SS-Mmp2em2Mcwi; RRID: RGD_4139878) as previously described23,24 ZFN pairs targeting the sequence AACCACAACCAACTACGAT GATGAC CGGAAGTGGGGC in exon 7 of the rat MMP2 gene were obtained from Sigma-Aldrich (St. Louis, MO). The ZFN mRNA was injected into the pronucleus of fertilized SS embryos and transferred to the oviduct of pseudo-pregnant females to generate MMP2 KO founders. The founders were identified using a CEL-1 assay.25 Polymerase chain reaction genotyping of the founders, and Sanger sequencing of the product, identified an 8-bp deletion between bps 1443–1440, using the following forward primer 5′-TGGAAATTCAGAAGGTGC-3′ and reverse primer 5′-CTTGGTCGGGACAGAAGCCCCACTTC-3’. These primers amplified a 158-bp band for the wild-type rats and a 150-bp band for the KO rats. Positive founders were backcrossed to parental strain to generate a heterozygous F1 colony that was maintained, and heterozygous parents were intercrossed to produce homozygous MMP2 KO and control animals for the study.
Hypertensive ModelExperiments were performed on 12-week-old SS and MMP2 KO rats maintained on the LS diet from weaning. Baseline mean arterial pressure (MAP) was measured using a tail-cuff device (Hatteras Instruments, Cary, NC). Rats were then placed in metabolic cages overnight for urine collection to measure protein, MMP2, nephrin, and podocalyxin excretion. The SS (n = 10) and MMP2 KO rats (n = 10) were switched to a high-salt (HS) diet containing 8.0% NaCl (Harlan Teklad TD.92012; Harlan Laboratories), and MAP was measured weekly for 3 weeks. A time-control group (n = 8) remained on the LS diet. At each time point, urine was collected overnight for measurement of proteinuria, MMP2, nephrin and podocalyxin excretion. The study was repeated in a second cohort of 4 SS-LS, 11 SS-HS, and 10 MMP2 KO-HS rats in which MAP was measured using an HD-SD10 telemetry probe implanted into the femoral artery (Data Sciences International, St Paul, MN). There was no significant difference in the time course of changes in MAP and proteinuria in the rats in which blood pressure was measured using telemetry or tail cuff, so the results were pooled and presented together. At the end of the chronic studies, the rats were anesthetized with isoflurane, a blood sample was collected and the kidneys were collected for biochemical and histologic analyses. Urinary protein concentration was determined using the Bradford method (Bio-Rad Laboratories, Hercules, CA). Urinary nephrin and podocalyxin concentrations were determined by enzyme-linked immunosorbent assay (ELISA) (Exocell, Philadelphia, PA). Urine and tissue MMP2 concentrations were measured using an MMP2 Quantikine ELISA Kit (R&D Systems, Minneapolis, MN). Plasma creatinine levels were measured by using an assay kit (Wako Pure Chemical, Osaka, Japan).
Diabetic ModelThese experiments were performed on 12-week-old SS and MMP2 KO rats maintained on a normal salt diet containing 1% NaCl (Harlan Teklad 8640; Harlan Laboratories, Madison, WI). Baseline MAP was measured in conscious animals using a tail-cuff device. Rats were then placed in metabolic cages overnight for a urine collection to measure baseline protein, MMP2, nephrin, and podocalyxin excretion. A blood sample was collected from the tail vein for measurement of blood glucose levels and glycosylated hemoglobin (HbA1c) levels. Then, 10 SS and 10 MMP2 KO rats were then treated with an intravenous injection of STZ (50 mg/kg; Sigma-Aldrich, St. Louis, MO) to induce type 1 diabetes, and a long-acting insulin implant was placed subcutaneously (2 U/d; Linshin Canada, ON, Canada) to maintain blood glucose levels around 400 mg/dL. Age-matched SS rats served as nondiabetic time-control group (n = 5). Mean arterial pressure was measured biweekly by tail cuff, and blood samples were collected from the tail vein for the measurement of glucose and HbA1c levels. These experiments were also repeated in a group of SS control (n = 4), SS-STZ (n = 14), and MMP2 KO-STZ (n = 5) rats in which MAP was measured by telemetry. There was no significant difference in the MAP in the rats measured using telemetry or tail cuff, so the results were pooled and presented together. At each time point, urine was collected overnight for measurement of proteinuria, MMP2, nephrin, and podocalyxin excretion. Plasma glucose and HbA1c levels were measured using a glucometer (Bayer HealthCare, Mishawaka, IN) and a rapid glycosylated hemoglobin (HbA1c) device (Bayer HealthCare, Sunnyvale, CA). Plasma creatinine levels were measured by using an assay kit (Wako Pure Chemical, Osaka, Japan).
Renal Clearance StudyAt the end of the study, renal hemodynamics was measured. The rats were anesthetized with ketamine (20 mg/rat i.m.) and Inactin (50 mg/kg i.p.) and placed on a warming table to maintain body temperature at 37°C. Catheters were placed in the femoral artery and vein for the measurement of MAP and for intravenous infusions, respectively. The rats received an infusion of 0.9% NaCl solution containing 2% bovine serum albumin and 2 mg/mL fluorescein isothiocyanate (FITC)-labeled inulin at a rate of 3 mL/h throughout the experiment for the measurement of glomerular filtration rate (GFR). An ultrasound flow probe (Transonic System, Ithaca, NY) was placed on the renal artery to measure renal blood flow (RBF). After a 30-minute equilibration period, urine and plasma samples were collected during two 30-minute experimental periods. The concentrations of FITC-inulin in urine and plasma samples were measured using a fluorescent microplate reader (BioTek Instruments, Winooski, VT). At the end of the clearance studies, the kidneys of the rats were collected for histology and tissue measurement of MMP2 and TGF-β1 levels.
Glomerular Permeability to AlbuminNine-week-old male SS and MMP2 KO rats were treated with STZ (50 mg/kg) and a low dose of insulin (2 U/d) and studied 12 weeks after induction of diabetes. The rats were anesthetized and given an intravenous injection of a high-molecular-weight (250 kDa) FITC-dextran in saline. Glomeruli were isolated by passing the minced renal cortex through filters, and permeability to albumin (Palb) was measured using a fluorescent dilution assay as previously reported.26 The reflection coefficient (σAlb) indicating the ratio of the change in fluorescence intensity after reducing albumin concentration in the bath from 6% to 4% compared with the expected change (33%) in response to the decrease in oncotic pressure was calculated. The convective permeability to albumin (1 − σAlb) was compared as an index of the relative degree of glomerular injury between STZ-treated SS and MMP2 KO rats.
Assessment of Renal InjuryThe left kidney was fixed in 10% formalin. Paraffin sections (3 µm) were prepared and stained with Masson's trichrome to determine the degree of glomerular injury and renal fibrosis or Periodic acid-Schiff to evaluate the degree of mesangial matrix expansion in glomeruli. Images were captured using a Nikon Eclipse 55i microscope equipped with a Nikon DS-Fi1 color camera (Nikon Instruments Inc., Melville, NY). Thirty glomeruli per section were scored in a blinded fashion on a 0–4+ scale, with 0 representing a normal glomerulus, 1+ representing the loss of 1%–25% of the glomerular capillary area, 2+ representing a 26%–50% loss, 3+ representing a 51%–75% loss, and 4+ representing >75% loss of the capillaries in the glomerular tuft. The degree of renal fibrosis was assessed by measuring the percentage of blue staining of collagen and fibronectin in trichrome-stained sections by thresholding using NIS Elements D 3.0 software (Nikon Instruments Inc).
ImmunohistochemistryParaffin sections (3 µm) were deparaffinized in xylene and rehydrated using a decreasing ethanol gradient (100%–70%). Sections used for nephrin and Wilm's tumor suppressor (WT1) immunohistochemistry were permeabilized with 0.1% trypsin in PBS at 37°C for 30 minutes. Antigen retrieval was done by microwave heating in 0.1% citrate buffer for 20 minutes, followed by a rinse with methanol at −20°C for 5 minutes. The sections were then blocked with 10% normal donkey serum and incubated with a guinea pig polyclonal anti-nephrin antibody (1:50, 20R-NP002; Fitzgerald, Acton, MA) or a rabbit polyclonal anti-WT1 antibody (1:10, sc-192; Santa Cruz, Dallas, TX) overnight at 4°C. The antigen for MMP2 immunohistochemistry was retrieved by microwave heating for 20 minutes using a Retrieve-All antigen unmasking solution (BioLegend). The sections were blocked using a 10% normal donkey serum and incubated with a rabbit polyclonal anti-MMP2 antibody (1:50, ab37150; Abcam, Cambridge, MA) overnight at 4°C. The sections were rinsed in PBS and then incubated with a secondary antibody conjugated with Alexa Fluor 488 (1:200; Jackson ImmunoResearch, West Grove, PA) for 1 hour. After 3 rinses in PBS, they were then counterstained with 0.001% Evans Blue (Sigma-Aldrich, St. Louis, MO) to quench autofluorescence and reveal renal structure. The sections were then rinsed with distilled water and mounted using a fluorescent mounting medium containing DAPI (Vector Laboratories, Burlingame, CA). Images were obtained using a Nikon Eclipse 55i microscope equipped with a 540-nm excitation filter, a 590-nm emission filter, and a Nikon DS-Fi1 color camera.
Measurement of MMP2 and TGF-β1 in the KidneyThe renal cortex was homogenized in an ice-cold RIPA buffer containing a proteinase inhibitor cocktail. The suspension was centrifuged at 11,000g for 15 minutes at 4°C, and the MMP2 and TGF-β1 levels in the supernatant were measured using ELISA kits (R&D Systems, Minneapolis, MN).
Western BlotsThe renal cortex was homogenized in lysis buffer containing 20 mM HEPES, 10 mM sodium chloride, 1 mM sodium orthovanadate, 10 mM sodium fluoride, 10 mM EDTA, and a protease inhibitor cocktail. Fifty micrograms of protein were separated on a polyacrylamide gel and transferred to PVDF membranes with a Trans-Blot Turbo Transfer System (Bio-Rad). The membranes were blocked with 5% skim milk in Tris-buffered saline-Tween 20 at room temperature for 1 hour and then incubated with either a rabbit polyclonal anti-MMP2 antibody (1:50, ab37150; Abcam, Cambridge, MA) or a mouse anti-β-actin antibody (1:10,000, ab6276; Abcam) overnight at 4°C, followed by incubation with either a horseradish peroxidase-conjugated goat anti-rabbit secondary antibody (1:10,000, sc-2004; Santa Cruz) or horseradish peroxidase–conjugated goat anti-mouse secondary antibody (1:20,000, sc-2005; Santa Cruz) for 30 minutes at room temperature. The membranes were developed using an ECL, and the intensities of the bands were determined using a Chemiluminescent Gel Doc System (Bio-Rad).
Statistical AnalysisData were presented as mean values ± SEM. The statistical significances of differences were determined using an unpaired t test for comparisons between 2 groups, a one-way ANOVA and a Holm–Sidak test for multiple comparisons, or a two-way ANOVA for repeated measures followed by a Holm–Sidak test for the time course studies (Sigma Plot 11; Systat Software, San Jose, CA).
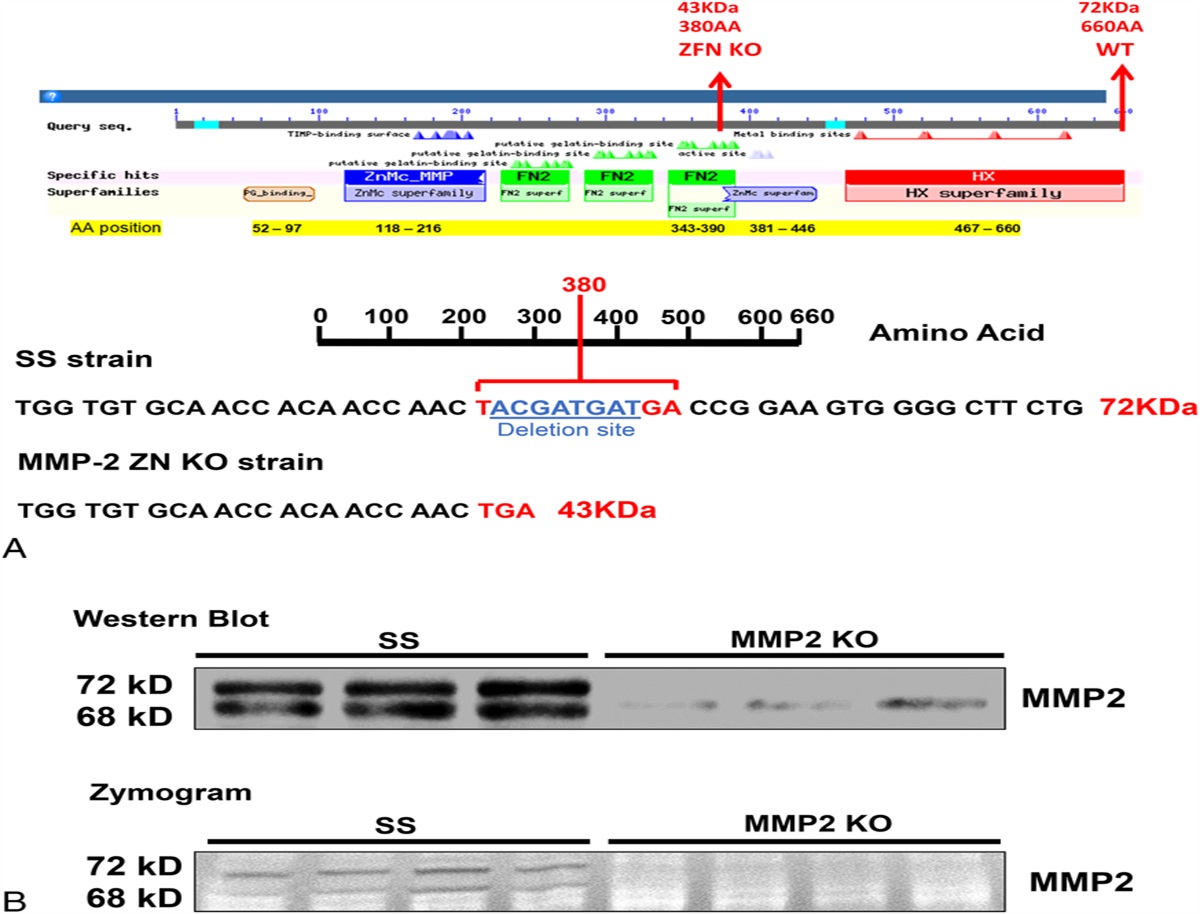
RESULTS Validation of KO of MMP2 in SS RatsThe MMP2 KO rat was created on a SS genetic background using ZFN (Fig. 1). We verified that the MMP2 KO rats have an 8-bp frame-shift deletion in exon 7 of the MMP2 gene between bps 1443–1440 that introduces a premature stop codon in a fibronectin-binding domain just before the Zn-binding catalytic site, and they produce a 43-KD instead of a 72-KD protein. We confirmed that the lack of expression of proactive and active MMP2 protein using a C-terminal antibody and diminished gelatinase activity by zymography in the kidneys of the KO versus the SS rats (Fig. 1).
 FIGURE 1.:
 Validation of MMP2 KO using the ZFN technology, Western blot, and zymography. A, Schematic presentation of the MMP2 protein (74 KDa; 660 AA) showing the locations of the different domains and the ZFN-target site that resulted in an 8-bp deletion and the introduction of a premature TGA stop-codon (43 KDa; 380 AA) in MMP2 KO rats. B, Representative images of Western blot and zymography confirming the loss of the expression of MMP2 protein and activity in the kidney of MMP2 KO rats. AA, amino acids; FN2, fibronectin type II repeats (green); HX, hemopexin-like domain (red); ZnMc, zinc binding site (blue).
Renal Expression of MMP2 and TGF-β1 in Hypertensive SS RatsRepresentative immunohistochemical localization of the expression of MMP2 in the renal cortex of SS and MMP2 KO rats fed either a LS or HS diet for 3 weeks is presented in Figure 2A. MMP2 was primarily expressed in glomeruli and proximal tubules of SS rats fed a LS diet. After 3 weeks on a HS diet, the expression of MMP2 increased in the glomeruli and proximal tubules of SS rats. MMP2 expression was barely detectable in the renal cortex of MMP2 KO rats. Similarly, MMP2 protein levels measured in renal cortical homogenates by ELISA increased significantly in SS rats fed a HS diet in comparison with SS rats fed a LS diet (Fig. 2B) and were not detectable in the MMP2 KO rats. MMP2 excretion increased 29-fold in SS rats fed a HS diet versus SS rats on a LS diet (Fig. 2C). In contrast, the renal expression and urinary excretion of MMP2 were barely detectable in MMP2 KO rats. The expression of TGF-β1 protein was also significantly increased in the renal cortex of SS rats fed a HS diet versus SS rats on a LS diet or MMP2 KO rats fed HS diet (Fig. 2D).
 FIGURE 2.:
 Renal expression and urinary excretion of MMP2 in hypertensive SS and MMP2 KO rats. A, Representative images of the renal cortex stained with MMP2 antibody (green) in age-matched SS rats maintained on a LS diet (SS-LS) and SS (SS-HS) and MMP2 KO (MMP2 KO-HS) rats fed a HS diet for 3 weeks. The tissues were counterstained with DAPI to visualize nuclei (blue) and 0.001% Evans blue (red) to quench autofluorescence and visualize tubular structures. Original magnification, ×200. MMP2 expression was barely detectable in (C) MMP2 KO-HS rats but markedly induced in the glomeruli and proximal tubules of (B) SS-HS rats compared with (A) SS-LS rats. B, Protein levels of MMP2 in the renal cortex of SS-LS, SS-HS, and MMP2 KO-HS rats were measured by ELISA after 3 weeks on the HS diet. C, Urinary excretion of MMP2 was measured in SS-LS, SS-HS, and MMP2 KO-HS rats before and after 3 weeks on a HS diet. D, Protein levels of TGF-β1 in the renal cortex of SS-LS, SS-HS, and MMP2 KO-HS rats were measured by ELISA after 3 weeks on a HS diet. Mean values ± SEM are presented. Numbers in parentheses indicate the number of rats studied per group. * indicates P < 0.05 versus the corresponding value measured in SS-LS rats. # indicates P < 0.05 versus the corresponding value measured in SS-HS rats. † indicates P < 0.05 versus the corresponding baseline control value within the same strain.
Changes in MAP and the Urinary Excretion of Proteinuria, Nephrin, and Podocalyxin in SS and MMP2 KO Rats Fed a HS DietBaseline MAP was similar in SS and MMP2 KO rats and averaged approximately 120 mm Hg. After 3 weeks on HS diet, MAP rose to 152 ± 3 mm Hg in SS rats but only to 145 ± 2 mm Hg in MMP2 KO rats (Fig. 3A). The rise in protein excretion was significantly attenuated in MMP2 KO rats (102 ± 5 mg/d) compared with SS rats fed a HS diet (421 ± 35 mg/d) (Fig. 3B). The urinary excretion of nephrin, a key podocyte marker, was significantly elevated 3-fold in SS rats fed a HS diet versus that seen in MMP2 KO rats (3.2 ± 0.5 vs. 0.8 ± 0.2 mg/d, respectively) or SS rats on a LS diet (Fig. 3C). Similarly, the urinary excretion of another podocyte membrane protein, podocalyxin, was significantly higher in SS rats fed a HS diet than in MMP2 KO rats fed a HS diet (67 ± 11 vs. 21 ± 4 mg/d, respectively) or SS rats on a LS diet (Fig. 3D).
 FIGURE 3.:
 MMP2 KO attenuates the development of hypertension and protein, nephrin, and podocalyxin excretion in SS rats fed a HS diet. A, Temporal changes in MAP in SS rats fed either a LS or a HS diet and MMP2 KO rats fed a HS diet for 3 weeks. B, The time course of changes in protein excretion in SS rats fed either a LS or a HS diet and MMP2 KO rats fed a HS diet for 3 weeks. C, D, The time course of changes in nephrin and podocalyxin excretion, as markers of podocyte injury, in SS rats fed either a LS or a HS diet and MMP2 KO rats fed a HS diet for 3 weeks. Mean values ± SEM are presented. Numbers in parentheses indicate the number of rats studied per group. † indicates P < 0.05 versus the corresponding value in the same strain at week 0. # indicates P < 0.05 versus the corresponding value measured in SS-HS rats.
Comparison of Renal Hypertrophy and Hemodynamics in SS and MMP2 KO Rats Fed a HS DietKidney weight increased by 20% in SS rats fed a HS diet for 3 weeks versus those seen in SS rats on a LS diet. Kidney weight did not increase in MMP2 KO rats (Fig. 4A). RBF per gram kidney weight fell by 29% in hypertensive SS rats fed HS diet compared with SS rats fed a LS diet (Fig. 4B). However, the GFR and plasma creatinine levels were not significantly altered (Figs. 4C, D). The MMP2 KO rats fed a HS diet for 3 weeks showed no significant change in RBF, GFR, or creatinine levels relative to the SS rats on either a LS or a HS diet (Figs. 4B–D).
 FIGURE 4.:
 Effects of MMP2 KO on renal hypertrophy and hemodynamics. A, Kidney weight in SS rats fed either a LS or a HS diet and MMP2 KO rats on a HS diet for 3 weeks. B, RBF was measured by using an ultrasonic flow probe in SS rats fed either a LS or a HS diet and in MMP2 KO rats fed a HS diet for 3 weeks. C, GFR, measured by the clearance of FITC-inulin, was measured in SS rats fed either a LS or a HS diet and in MMP2 KO rats fed a HS diet for 3 weeks. D, Plasma creatinine concentrations in SS rats fed either a LS or HS diet and in MMP2 KO rats fed a HS diet for 3 weeks. Mean values ± SEM are presented. * indicates P < 0.05 versus the corresponding value measured in SS-LS rats.
Comparison of Renal Injury in SS and MMP2 KO Rats Fed a HS DietA comparison of the degree of renal injury in the renal cortex and medulla of SS rats fed a LS or a HS diet and MMP2 KO rats fed a HS diet is presented in Figure 5A. The kidneys of SS rats fed a HS diet exhibited severe glomerulosclerosis, renal fibrosis (blue), and the formation of protein casts in the medulla (pink) when compared with SS rats fed a LS diet. In contrast, the degree of renal injury was significantly less in MMP2 KO rats on a HS diet (Fig. 5A). The glomerular injury scores and percentage of renal cortical and medullary fibrosis were significantly higher in SS rats fed a HS diet relative to the levels seen in SS rats on a LS diet or MMP2 KO rats fed a HS diet (Figs. 5B–D).
 FIGURE 5.:
 MMP2 KO protects against glomerular injury and renal fibrosis in SS rats fed a HS diet. A, Representative images of the renal cortex and medulla stained with Masson's trichrome in age-matched SS rats maintained on a LS or a HS diet and MMP2 KO rats fed a HS diet for 3 weeks. The degree of glomerulosclerosis and renal interstitial fibrosis was less in MMP2 KO-HS rats (C, F) than in SS-HS rats (B, E). Magnification, ×100. B, Thirty glomeruli were scored for the degree of glomerular injury in each animal. C, The degree of renal fibrosis was quantified by measuring the percentage of the area stained blue on 10 random, nonoverlapping fields in the renal cortex (C) and medulla (D) of each animal. E, Representative images of the expression of nephrin (green) and counterstained with 0.001% Evans blue (red) and DAPI (blue) in glomeruli and proximal tubules of SS rats fed a LS or a HS diet, and MMP2 KO rats fed a HS diet for 3 weeks. Quantitative analysis was performed on 30 glomeruli in each animal. The percentage of the nephrin-positive area in the glomeruli was significantly higher in (C) MMP2 KO-HS rats compared with (B) SS-HS rats. F, Representative images of the glomeruli stained with WT1 antibodies (green) and counterstained with 0.001% Evans blue (red) and DAPI (blue) in SS rats fed a LS or a HS diet and MMP2 KO rats fed a HS diet for 3 weeks. Quantitative analysis was performed on 30 glomeruli in each animal. The number of WT1-positive podocytes in the glomeruli of MMP2 KO-HS rats (C) was significantly higher than in SS-HS rats (B). Mean values ± SEM are presented. Numbers in parentheses indicate the number of glomeruli or areas scored per number of rats studied in each group. * indicates P < 0.05 versus the corresponding value measured in SS-LS rats, # indicates P < 0.05 versus the corresponding value measured in SS-HS rats.
The expression of nephrin and WT1 were examined by immunohistochemical analysis to assess glomerular podocyte injury and loss. Nephrin was highly expressed lining the basement membrane of glomerular capillaries in SS rats fed a LS diet. After 3 weeks on HS diet, the expression of nephrin decreased in both SS and MMP2 KO rats, but the levels remained much higher in MMP2 KO rats than in SS rats fed a HS diet (Fig. 5E). The number of WT1-positive podocytes in the glomeruli of MMP2 KO rats was also significantly greater than in SS rats fed a HS diet (Fig. 5F).
Because renal inflammation also plays an important role in the development of renal injury and fibrosis,27–30 we examined the accumulation of ED1-positive macrophages in the kidney. The number of ED1-positive macrophages in the renal cortex of SS rats fed a HS diet was significantly higher than in SS rats fed a LS diet or MMP2 KO rats fed a HS diet (see Figure, Supplemental Digital Content 1, https://links.lww.com/JCVP/A985).
Renal Expression of MMP2 and TGF-β1 in STZ-treated Diabetic SS RatsRepresentative images of the MMP2 immunostained renal cortex of SS, STZ-treated SS, and MMP2 KO rats are presented in Figure 6A. After 12 weeks of diabetes, MMP2 was detected in the glomeruli, proximal tubules, and interstitial space of STZ-treated SS rats compared with control SS rats. As expected, no MMP2 protein was detected in the renal cortex of MMP2 KO rats. The MMP2 protein levels in the renal cortex increased significantly 12 weeks after induction of diabetes in STZ-treated SS rats in comparison with the control group (Fig. 6B). Urinary MMP2 excretion also increased to 2496 ± 365 ng/d in STZ-treated SS rats versus 117 ± 31 ng/d in the time-control SS rats (Fig. 6C). In contrast, MMP2 KO rats had significantly lower renal expression and urinary excretion of MMP2. TGF-β1 protein levels in the renal cortex were also significantly increased in STZ-treated SS rats compared with control SS rats (1111 ± 182 vs. 685 ± 80 pg/g, respectively). MMP2 KO rats had significantly lower TGF-β1 protein levels (507 ± 35 pg/g) than in either group (Fig. 6D).
 FIGURE 6.:
 Effect of MMP2KO on the renal expression and urinary excretion of MMP2 in STZ-treated diabetic SS rats. A, Representative images of the renal cortex stained with MMP2 antibody (green) and counterstained with 0.001% Evans blue (red) and DAPI (blue) in age-matched control SS rats (SS), STZ-treated SS (SS-STZ), and MMP2 KO (MMP2 KO-STZ) rats. Magnification, ×200. MMP2 was avidly stained in the glomeruli, proximal tubules, and interstitial space of (B) SS-STZ rats compared with (A) SS control rats. There was no staining of MMP2 in the kidney of (C) MMP2 KO-STZ rats. B, Expression of MMP2 protein in the renal cortex of SS, SS-STZ, and MMP2 KO-STZ rats measured with ELISA 12 weeks after induction of diabetes. C, Urinary excretion of MMP2 was measured in SS, SS-STZ, and MMP2 KO-STZ rats before and 12 weeks after induction of diabetes with STZ. D, Protein levels of TGF-β1 in the renal cortex of SS, SS-STZ, and MMP2 KO-STZ rats were measured with ELISA 12 weeks after induction of diabetes. Mean values ± SEM are presented. Numbers in parentheses indicate the number of rats studied per group. * indicates P < 0.05 versus the corresponding value measured in SS control rats. # indicates P < 0.05 versus the corresponding value measured in SS-STZ rats. † indicates P < 0.05 versus the corresponding value measured within the same strain at week 0.
Comparison of MAP, Proteinuria, and Urinary Excretion of Nephrin and Podocalyxin in STZ-treated Diabetic SS and MMP2 KO RatsBaseline blood glucose levels (97.8 ± 5.2 vs. 97.6 ± 2.4 mg/dL) and HbA1c concentrations (4.9 ± 0.1 vs. 4.6 ± 0.0%) were similar in SS and MMP2 KO rats (Figs. 7A, B). Blood glucose levels (508 ± 26 vs. 451± 29 mg/dL) and HbA1c concentrations (12.5 ± 0.2 vs. 12.1 ± 0.3%) increased to the same extent in STZ-treated SS and MMP2 KO rats. Mean arterial pressure tended to be slightly lower in MMP2 KO than in STZ-treated SS rats, but this difference did not reach statistical significance (Fig. 7C). The STZ-treated SS rats developed progressive proteinuria, starting at week 2 and continuing through week 12, whereas MMP2 KO rats failed to develop significant proteinuria (Fig. 7D). The urinary excretion of nephrin (0.8 ± 0.1 vs. 5.3 ± 0.8 mg/d) and podocalyxin (14 ± 2 vs. 146 ± 14 μg/d) were significantly attenuated in MMP2 KO rats in comparison with STZ-treated SS rats (Figs. 7E, F).
 FIGURE 7.:
 Effect of MMP2 KO on proteinuria and urinary excretion of nephrin and podocalyxin in STZ-treated diabetic SS rats. Time course of (A) blood glucose and (B) HbA1c levels in SS, STZ-treated SS (SS-STZ), and MMP2 KO (MMP2 KO-STZ) rats. Temporal changes in (C) MAP and (D) proteinuria in SS, SS-STZ, and MMP2 KO-STZ rats. The time courses of changes in (E) nephrin and (F) podocalyxin excretion in SS, SS-STZ, and MMP2 KO-STZ rats. Mean values ± SEM are presented. Numbers in parentheses indicate the number of rats studied per group. † indicates P < 0.05 versus the corresponding value within the same strain at week 0. # indicates P < 0.05 versus the corresponding value measured in SS-STZ rats.
Comparison of Palb in STZ-treated Diabetic SS and MMP2 KO RatsThe fluorescence intensity of glomeruli isolated from STZ-diabetic MMP2 KO rats fell by a significantly greater extent (26 vs. 19%) in response to a reduction in the albumin concentration of the bath than in STZ-treated SS rats (Fig. 8A). Thus, the convective Palb was significantly lower in STZ-treated MMP2 KO rats than in SS rats (Fig. 8B).
 FIGURE 8.:
 Effect of MMP2 KO on the glomerular permeability to albumin (Palb) in STZ-treated diabetic SS rats. A, Comparison of the time course of changes in FITC-dextran fluorescence in glomeruli isolated from STZ-treated SS (SS-STZ) and MMP2 KO (MMP2 KO-STZ) rats in response to changes in the albumin concentration of the bath from 6% to 4% are presented. B, Comparison of Palb in isolated glomeruli from STZ-treated SS and MMP2 KO rats. Mean values ± SEM are presented. Numbers in parentheses indicate the number of animals and glomeruli studied. # indicates P < 0.05 versus the corresponding value measured in SS-STZ rats.
Comparison of Renal Hypertrophy and Hemodynamics in Diabetic SS and MMP2 KO RatsSS rats exhibited marked renal hypertrophy 12 weeks after the induction of diabetes. Kidney weight increased by 80% relative to nondiabetic time-control SS rats. Renal hypertrophy was significantly less in diabetic MMP2 KO rats (Fig. 9A). RBF per gram kidney weight was significantly lower in the diabetic SS rats than in control SS rats largely because of renal hypertrophy rather than a rise in renal vascular resistance. The fall in RBF was attenuated in STZ-treated MMP2 KO rats in which kidney weight did not increase (Fig. 9B). GFR on a per gram kidney weight was 33% lower after 12 weeks of diabetes in STZ-treated SS rats than in time-control SS rats. GFR only fell by 12% in the STZ-treated MMP2 KO rats (Fig. 9C). Plasma creatinine levels increased significantly in STZ-treated SS rats compared with SS time-control rats and STZ-diabetic MMP2 KO rats (Fig. 9D).
 FIGURE 9.:
 Effect of MMP2 KO on renal hypertrophy, RBF, GFR, and plasma creatinine levels in STZ-treated diabetic SS rats. A, Kidney weight in age-matched SS rats (SS), STZ-treated SS (SS-STZ), and MMP2 KO (MMP2 KO-STZ) rats, 12 weeks after induction of diabetes. B, RBF was measured by an ultrasound flow probe in age-matched SS rats (SS), STZ-treated SS (SS-STZ) and MMP2 KO (MMP2 KO-STZ) rats 12 weeks after induction of diabetes. C, GFR, measured by the clearance of FITC-inulin in SS, SS-STZ, and MMP2 KO-STZ rats 12 weeks after induction of diabetes. D, Plasma creatinine concentrations in SS, SS-STZ, and MMP2 KO-STZ rats, 12 weeks after induction of diabetes. Mean values ± SEM are presented. * indicates P < 0.05 versus the corresponding value measured in SS rats. # indicates P < 0.05 versus the corresponding value measured in SS-STZ rats.
Comparison of Renal Injury in STZ-treated Diabetic SS and MMP2 KO RatsA comparison of the renal injury in the renal cortex and medulla of control SS and STZ-treated SS and MMP2 KO rats is presented in Figure 10A. The kidneys of STZ-treated SS rats exhibited severe renal injury with thickening of the glomerular basement membrane, mesangial expansion, focal glomerulosclerosis, and renal interstitial fibrosis. In contrast, the kidneys from time-control SS and STZ-treated diabetic MMP2 KO rats exhibited only mild glomerular mesangial expansion and interstitial fibrosis. The glomerular injury score was significantly elevated in STZ-treated SS rats relative to the levels seen in control SS and STZ-treated MMP2 KO rats (Fig. 10B). The percentage of renal cortical and medullary fibrosis was also significantly higher in STZ-treated SS rats than in control SS and STZ-treated MMP2 KO rats (Figs. 10C, D).
 FIGURE 10.:
 Effect of MMP2 KO on glomerular injury and renal fibrosis in STZ-treated diabetic SS rats. A, Representative images of (A–C) the glomeruli stained with PAS, and (D–F) the renal cortex and (G–I) medulla stained with Masson's trichrome in age-matched SS (SS), STZ-treated SS (SS-STZ), and MMP2 KO (MMP2 KO-STZ) rats. The degree of glomerular mesangial matrix expansion, glomerulosclerosis, and renal fibrosis was less in MMP2 KO-STZ rats (C, F, I) than in SS-STZ rats (B, E, H). Magnification, ×200 in (A–C); ×100 in (D–I). B, Thirty glomeruli were scored for the degree of glomerular injury in each animal (C, D). The degree of renal fibrosis was quantified by measuring the percentage of the area stained blue in 10 random, nonoverlapping fields in the renal cortex (C) and medulla (D) of each animal. E, Representative images of glomeruli stained with nephrin antibodies (green) and counterstained with 0.001% Evans blue (red) and DAPI (blue) in SS, SS-STZ, and MMP2 KO-STZ rats. Quantitative analysis was performed on 30 glomeruli in each animal. The percentage of the nephrin-positive area in the glomeruli was significantly higher in MMP2 KO-STZ rats (C) compared with SS-STZ rats (B). F, Representative images of the glomeruli stained with WT1 antibodies (green) and counterstained with 0.001% Evans blue (red) and DAPI (blue) in SS, SS-STZ, and MMP2 KO-STZ rats. Quantitative analysis was performed on 30 glomeruli in each animal. The number of WT1-positive podocytes in the glomeruli of MMP2 KO-STZ rats (C) was significantly higher than in SS-STZ rats (B). Mean values ± SEM are presented. Numbers in parentheses indicate the number of glomeruli or areas scored per number of rats studied in each group. * indicates P < 0.05 versus the corresponding value measured in SS rats. # indicates P < 0.05 versus the corresponding value measured in SS-STZ rats.
A comparison of the glomerular nephrin and WT1 expression in the kidneys of SS, STZ-treated SS, and MMP2 KO rats is presented in Figures 10E, F. Strong staining for nephrin was detected in glomeruli of control SS and STZ-treated MMP2 KO rats, but much less staining was detected in glomeruli of STZ-treated SS rats. The number of WT1-positive podocytes in the glomeruli of STZ-treated SS rats was also significantly lower when compared with control SS and STZ-treated MMP2 KO rats. The number of ED1-positive macrophages in the renal cortex of STZ-treated SS rats was also significantly higher than control SS and STZ-treated MMP2 KO rats (see Figure, Supplemental Digital Content 1, https://links.lww.com/JCVP/A985).
DISCUSSIONOne of the major characteristics of CKD progression is ECM deposition, which has been linked to the development of ESRD. MMPs play a key role in controlling ECM turnover and have been implicated in the pathogenesis of CKD.4,5,7,15,31 However, the relationship between MMP2 and the progression of renal disease, including hypertensive and diabetic nephropathy, remains controversial13,32–37 and requires further investigation. We reported that the progression of renal disease in hypertensive SS and diabetic T2DN strains was associated with increased levels of MMP2 in the kidney.11 Therefore, the present study examined the role of MMP2 in hypertension- and diabetic-induced renal injury by comparing proteinuria and renal injury after induction of hypertension and STZ-induced diabetes in SS rats and a novel SS MMP2 KO strain that we created using ZFN technology.
The results indicate that SS rats fed a HS diet developed hypertension and proteinuria and marked renal injury, as reflected by severe glomerulosclerosis, renal fibrosis, and podocyte effacement, associated with the loss of glomerular nephrin and WT1 expression and elevated levels in the urine. We found that the renal expression and urinary excretion of MMP2 increased significantly in hypertensive SS rats fed a HS diet. These results are consistent with our previous finding that hypertension upregulates the expression of MMP2 in the kidney of SS rats.11,38 The increases in proteinuria and nephrin and podocalyxin excretion fed a HS diet were lower in MMP2 KO versus SS rats. Moreover, the degree of glomerulosclerosis, renal cortical and medullary fibrosis, and podocyte injury was markedly reduced in the kidneys of the MMP2 KO rats. These results suggest that the progression of hypertension-induced renal injury in SS rats is associated with the upregulation of MMP2 and that KO of MMP2 activity largely prevents the development of proteinuria and renal injury in this model of hypertension. Our findings, however, do not exclude the participation of other MMPs in hypertension-induced renal injury. In this regard, there is evidence by our laboratory and others that the renal MMP9 expression also increases in hypertensive SS rats and that KO or inhibition of MMP9 activity attenuated the development of both hypertension and proteinuria in these studies.38,39
The time course of the changes in MAP was not significantly different in SS and MMP2 KO rats fed a HS diet suggesting that the protection from the development of proteinuria and renal injury in the MMP2 KO strain was not because of a reduction in blood pressure. Moreover, it is somewhat surprising that hypertension was not attenuated in the MMP2 KO rats. This may be because of a limitation of the present study that the rats were only fed the HS diet for 3 weeks, which was insufficient for the full development of hypertension. Typically MAP increases by 15–20 mm Hg in SS rats in the first week on a HS diet. After 3–5 weeks on a HS diet, a secondary (malignant) phase of hypertension develops. Mean arterial pressure plateaus between 180 and 200 mm Hg, far beyond the 150 mm Hg seen in the present study in the SS/Mcw rats fed the HS diet for 3 weeks. Thus, it is possible that if the rats were exposed to the HS diet for longer, the degree of hypertension might be attenuated in the MMP2 KO rats, secondary to reduced glomerulosclerosis and fibrosis.
Recent studies have indicated that infiltration of immune cells in the kidney is elevated in models of SS hypertension, and depletion of macrophages or immunosuppressants reduced the degree of renal injury and hypertension in SS rats.27–30 In the present study, we also found that infiltration of ED1-positive macrophages in the renal cortex of SS rats fed a HS diet was significantly higher than that seen in MMP2 KO rats or SS rats on a LS diet. This finding is consistent with the idea that MMP2-mediated release of membrane-bound cytokines and degradation products of ECM proteins may play a key role in the activation of the immune system and infiltration of monocytes and macrophages in the kidney and other tissues.28,40–43
We also evaluated the role of MMP2 during the progression of STZ-induced diabetic nephropathy by comparing the development of proteinuria and renal injury after the induction of diabetes in SS and MMP2 KO rats. The SS rat is more susceptible to the development of diabetic nephropathy because the myogenic and tubuloglomerular feedback (TGF) responses44,45 and autoregulation of glomerular capillary pressure are impaired in this strain.19–22 The results of the present study indicate that the renal expression and urinary excretion of MMP2 increased significantly in parallel with the development of proteinuria and renal injury in STZ-treated SS rats, but it did not increase in MMP2 KO rats. This was associated with a reduction in proteinuria and the excretion of nephrin and podocalyxin in the MMP2 KO rats in comparison with STZ-treated SS rats. We also found that Palb was significantly higher in STZ-treated SS rats compared with STZ-treated MMP2 KO rats in the absence of significant changes in MAP. Although the mechanism of action remains to be determined, previous studies have indicated that TGF-β1 increases glomerular permeability to albumin9,46 and causes podocyte dysfunction and injury.47,48 MMP2 also promotes the release of active TGF-β1 from its bound latent forms.14,49 Consistent with this view, we found that the levels of TGF-β1 increased significantly in the renal cortex of STZ-treated SS rats and hypertensive SS rats, whereas the levels were much lower in STZ-treated MMP2 KO rats and MMP2 KO rats fed a HS diet. These findings indicate that upregulation of the renal formation of MMP2 may contribute to the development of proteinuria in diabetic and hypertensive SS rats by promoting podocyte loss, resulting in an increase in Palb by promoting the release of TGF-β1.
Consistent with the results of previous studies,19,50 STZ-treated SS rats exhibited severe diabetic nephropathy as evidenced by a high degree of glomerular injury, renal interstitial fibrosis, and tubular damage. In contrast, glomerular injury, renal interstitial fibrosis, and t
留言 (0)