
Remember me


As a degenerative and chronic inflammatory disease, abdominal aortic aneurysm (AAA) is characterized by degradation of the extracellular matrix1 and impaired function of vascular smooth muscle cells.2 Rupture of AAA is the leading cause of death in patients with AAA worldwide.3 The clinical manifestations of AAA are back pain, weight loss, elevated ESR,4 and nonspecific inconsistent abdominal pain/discomfort, which may also affect the chest, back, and lower limbs. Other symptoms include abdominal pulsation and ischemia in the lower leg caused by emboli associated with thrombosis.5 Many studies have confirmed the important role of macrophage polarization in AAA.6,7 Macrophages are an important type of immune cell that can digest pathogens and dead cells and participate in inflammation and immune responses.8 Changes in the number and function of macrophages can significantly affect disease progression during the occurrence and progression of AAA.9,10 Macrophages have 2 phenotypes (M1 and M2), which have different physiologic and pathologic functions.11 Research has shown that in AAA, M1 macrophages mainly participate in inflammatory and pathologic development by secreting cytokines and inflammatory factors; M2 macrophages, however, mainly promote the repair and reconstruction of lesions by secreting anti-inflammatory factors and growth factors.12,13 In addition, clinical studies of AAA have shown an increase in the number of M2 macrophages in the lesion area, which is related to the pathologic type of the lesion and the development stage.14
TCF3, which is an important transcription factor, is known as E2A15 and has important roles in immune cell differentiation, embryonic development, and cancer.16–18 TCF3 can be expressed in a variety of cells, including embryonic stem cells, mouse cardiomyocytes,19 liver cancer cells,20 and macrophages.21 As a transcription factor, TCF3 can take part in disease progression by controlling the expression of noncoding RNAs.22,23 However, the function of TCF3 in AAA has not yet been reported. Studies have shown that miRNAs, which are noncoding RNA molecules, can participate in the pathologic process of AAA by regulating mRNA translation.24 Moreover, it was found that miR-143 plays a key role in the formation of AAA, and multiple differentially expressed miRNAs, including miR-21, miR-143, and miR-145, have been found in human brain aneurysms, among which the expression of miR-143-5p is most downregulated.25MiR-143-5p has been implicated in the progression and prognosis of many types of cancer.26 However, the specific mechanism of miR-143-5p in AAA still needs to be further studied. CCL20 [chemokine (C–C motif) ligand 20], which is a chemokine that is primarily produced by cells associated with inflammation and autoimmune responses, has been shown to be a highly sensitive biomarker of AAA, and its expression is increased in AAA.27MiR-143-5p can affect renal fibrosis by targeting CCL20.28 However, whether targeted regulation of CCL20 by miR-143-5p is involved in the process of AAA remains unclear.
To elucidate the role of TCF3 in the formation of AAA, we examined the polarization of macrophages by overexpressing and inhibiting TCF3, focusing on how TCF3 regulates the miR-143-5p/CCL20 pathway and plays a role in AAA, aiming to provide a new theoretical basis for the treatment of AAA.
MATERIALS AND METHODS Clinical SamplesThe clinical samples were collected from 18 patients with AAA who underwent surgical treatment at the First People's Hospital of Yunnan Province. This study was approved by the ethics committee of the First People's Hospital of Yunnan Province, and the informed consent has been obtained from each patient.
The inclusion criteria for AAA included main artery diameter ≥30 mm. We excluded subjects with Marfan syndrome, traumatic AAA, previous aortic surgery, malignancies, hematologic disorders, infectious diseases, autoimmune diseases, myocardial infarction, or severe organ failure.29 Preoperative hypotensive control was mainly conducted for patients to adjust blood pressure. Almost all AAA patients had hypertension, and additional anticoagulant drugs were not required if the visceral artery was not reconstructed after surgery. It was only necessary to continue the treatment of the underlying disease (such as high blood pressure and diabetes).
Experimental Animals and Model ConstructionEight-week-old male apolipoprotein E-deficient (ApoE −/−) C57BL/6 mice were purchased from Hunan Slake Jingda Experimental Animal Co, Ltd (Changsha, China). In this study, the mice were raised in an environment with a temperature of 22 ± 1°C, relative humidity of 50%–60%, ventilation of 8–12 times/h, and a 12-h light/dark cycle and were given sufficient food and water. The mice were randomly divided into 5 groups with 12 mice in each group. The animals were anesthetized with 1.5%–2% isoflurane, and an infiltration pump (Alzet Model 2004, Mountain View, CA) containing Ang II (MCE, NJ) was implanted in the lateral back of each mouse. Ang II was injected at a rate of 1 μg/kg per min for 4 weeks. The miR-143-5p mimic, overexpression (oe)-TCF3, oe-CCL20, and corresponding negative controls (20 nmol/mouse RiboBio, Guangzhou, China) were injected into the mice via the tail vein with a Lipofectamine TM 3,000 kit (Invitrogen, Carlsbad, CA) for subsequent experiments. The experiments were authorized by the Experimental Animal Ethics Committee of Kunming University of Science and Technology. All animal studies, including mouse euthanasia procedures, were performed in accordance with the National Institutes of Health guidelines for experimental animal care and use (2015). Finally, the mice were euthanized by an intraperitoneal injection of pentobarbital sodium on the 28th day of modeling.
Isolation, Culture, and Treatment of Murine MacrophagesThe mice were injected with 1 mL of 4% thioglycolate into the abdomen 3 days before the experiment. After 72 hours, the mice were euthanized and soaked in 75% alcohol for 3–5 minutes, and 5 mL of DMEM (Life Technology, Carlsbad, CA) was injected into the abdominal cavity with a sterile pipette. At the same time, the peritoneal wall was manually pressed on both sides, and the fluid from the abdominal cavity was transferred into a sterile centrifuge tube at 4°C and centrifuged at 300×g for 5 minutes. The supernatant was discarded, and the cells were suspended in DMEM containing 10% fetal bovine serum (FBS Gibco, Grand Island, NY) and inoculated in 6-well plates. The cells were incubated at 37°C in 5% CO2. After 24 hours, the medium was changed to remove other cells that were not attached to the wells. After being identified by flow cytometry, the cells were starved for 16–18 hours and treated with Ang II (1 μm) for 24 hours. When the cell density reached 80%, 10 nM miR-143-5p mimic, oe-TCF3, oe-CCL20, and the corresponding negative controls were transfected into the cells using the LipofectamineTM 3,000 kit and cultured for 24 hours. Next, the medium containing the transfer solution in the wells was replaced with DMEM containing 10% fetal bovine serum for the next experiment.
Macrophages Were Identified by Flow CytometryMacrophages were collected and evenly dispersed, and the cell suspension was divided into 2 tubes. Tube 1 was the negative control, 1:300 FITC Rat IgG2a κ isotype Ctrl was added to the tube 1, and 1:300 FITC antimouse F4/80 antibody was added to tube 2 and incubated for 30 minutes in the dark. Then, the cells were washed once with flow buffer, resuspended in 1 mL of flow buffer and transferred into a flow tube for flow cytometry.
Western Blot AnalysisTotal proteins were extracted with RIPA lysis buffer, and the protein concentration was measured by a BCA kit (Solarbio, Beijing, China). Proteins were isolated by SDS gels, transferred to PVDF membranes, and blocked with 5% nonfat milk powder. The membranes were incubated overnight at 4°C with the following antibodies (Abcam, Cambridge, United Kingdom, 1:1,000): TCF3 (ab243152), CCL20 (ab9829), MMP9 (ab76003), CD68 (ab283654), iNOS (ab178945), CD163 (ab182422), MMP2 (ab92536), and CD206 (ab64693). HRP-linked mouse IgG (1:1,000, Abcam) was used and incubated with the membrane at room temperature for 1 hour. Then, ECL chemiluminescence was used for development, a chemiluminescence instrument was used for exposure and observation, and ImageJ was used for protein band analysis. β-Actin was used as a control. ECL was added for exposure and ImageJ was used for data processing.
RT‒qPCRCell and tissue specimens were lysed with RNAiso reagent, total RNA was extracted by an RNAiso Reagent RNA kit (Takara, Dalian, China) in accordance with the specifications; then, the RNA concentration and mass were measured. The RNA specimens were treated with DNase I, and 1 μg of RNA was reverse-transcribed into cDNA. Then, 2 μL of cDNA was prepared for PCR, and U6 was used as the internal reference. The PCR thermal cycle parameters were 94°C for 2 minutes → 94°C for 15 seconds → 60°C for 30 seconds for 45 cycles. The results were calculated by the 2−ΔΔCt method. The experiment was repeated 3 times. The primer sequences are shown in Table 1.
TABLE 1. - Primer Sequences Genes Sequences (5′-3′) miR-143-5p CGGGTGCAGTGCTGCAT AGTGCAGGGTCCGAGGTATT U6 GCGCGTCGTGAAGCGTTC GTGCAGGGTCCGAGGTThe MMP Total Activity Fluorescence Quantitative Detection Kit (Guide Chem, Shanghai, China) was used to detect MMP activity. The cells were lysed, the samples were added to a 96-well ELISA plate, and the corresponding fluorescence value RUF was measured at 37°C and an excitation wavelength of 330 nm.
ELISA Analysis of CytokinesAccording to the ELISA kit instructions (Solarbio, Beijing, China), the cell supernatant or mouse serum was collected to detect cytokine concentrations. Mouse IL-6 (SEKM-0007), mouse IL-1 β (SEKM-0002), mouse IL-18 (SEKM-0019), and mouse TNF-α (SEKM-0034) were measured. An enzyme-linked immunosorbent assay was used to measure the OD value.
Flow CytometryThe cells were prepared as suspensions, CD11b and CD163 (BD Biosciences) were labeled with fluorescent antibodies, and then the single-cell suspension was filtered through a 100-µm filter to analyze the levels of CD11b- and CD163-positive cells by flow cytometry. The data were analyzed using Flow J software.
Double Luciferase Reporter Gene ExperimentA total of 2 × 10⁴ 293T cells were inoculated in a 24-well plate 24 hours before being transfected with the luciferase reporter plasmid, and the CCL20 3′UTR WT and mutant sequences were amplified and ligated into the pGL3 luciferase vector reporter. The miR-143-5p analog or analog control was cotransfected into 293T cells using Lipofectamine 2,000 (Invitrogen). After 48 hours, luciferase activity was detected with a double fluorescent enzyme reporter gene detection kit (Sigma Aldrich, Louis, MO).
ChIP AssayChIP assay was performed with a SimpleChIP Plus Ultrasonic Chromatin IP kit. Then, 1% formaldehyde was used to fix 1 × 10⁷ cells, and glycine was used to quench the cells, which were then resuspended and lysed. Afterward, the cross-linked DNA was cut by ultrasound treatment into 200–1,000 bp fragments. Immunoprecipitation, decrosslinking, and DNA purification were performed. Normal mouse IgG (2 μg), TCF3 antibodies, and 10 μg of sheared chromatin (small fragments of chromatin interrupted by ultrasound) were incubated together. After the samples were incubated with the antibody overnight at 4°C, magnetic beads were added. After 2 hours, the magnetic beads were filtered. Then, 6 μL of 5 mol NaCl and 2 μL of protease K were used to reverse the cross-linking at 65°C for 2 hours. A DNA purification spin column was used to purify the DNA. Finally, RT-qPCR was used to enrich specific DNA sequences.
Histologic StainingThe abdominal aortic tissue of rats was fixed in 4% paraformaldehyde overnight at 4°C. The sections were rinsed with running water, embedded in paraffin, and sliced continuously at a thickness of 5 μm. A hematoxylin–eosin (HE) staining kit (G1120, Solarbio, Beijing, China) was used to stain the sections according to the kit instructions. The Verhoeff's Van Gieson (EVG) staining kit (ab150667, Abcam) was used to stain the sections according to the kit instructions.
Statistical AnalysisThe data were analyzed by GraphPad 8.0 and are expressed as the mean ± SD. All experiments were repeated 3 times. One-way ANOVA and Student's t test were used for analysis. A value of P < 0.05 was considered statistically significant.
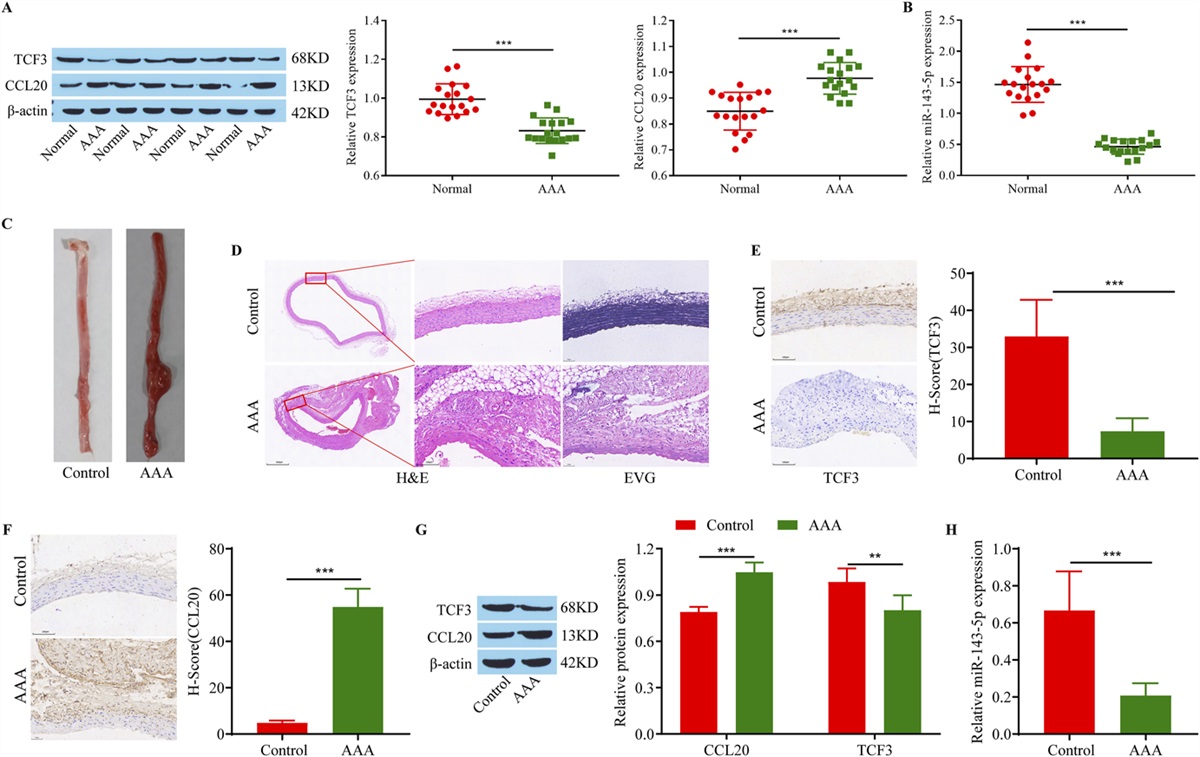
RESULTS The Expression of TCF3, miR-143-5p, and CCL20We collected samples of AAA and surrounding tissues from patients who underwent AAA surgery in our hospital for Western blot and RT-qPCR analysis. TCF3 and miR-143-5p protein and gene expression in AAA samples were lower than those in normal tissues, whereas the amount of CCL20 was the opposite (Figs. 1A, B). Next, we successfully constructed an AAA animal model using ApoE −/− mice. There was tumor formation in the abdominal aortas of the mice, and the diameter of the abdominal aorta was increased (Fig. 1C). HE and EVG staining showed thickening of the abdominal aortic wall, rupture of the medium and outer membrane, and degradation of elastic fibers in the AAA group (Fig. 1D), indicating the successful construction of the mouse AAA model. Similarly, we measured the expression of TCF3, miR-143-5p, and CCL20 in the different groups. The results showed that TCF3 and miR-143-5p were expressed at low levels in the AAA model, whereas CCL20 was highly expressed in the AAA model (Figs. 1E,H). These results indicate that TCF3 and miR-143-5p are expressed at low levels in AAA, whereas CCL20 is highly expressed in AAA.
 FIGURE 1.: Expression of TCF3, miR-143-5p, and CCL20. A, Western blot analysis of TCF3 and CCL20 in clinical samples. B, RT‒qPCR analysis of miR-143-5p expression in clinical samples. C, Apparent view of AAA in mice. D, HE and EVG staining of AAA tissue. E–F, Immunohistochemical staining was used to detect TCF3 and CCL20 in the AAA tissue of mice. G, Western blot analysis of TCF3 and CCL20 in mouse abdominal aortic tissue. H, RT‒qPCR analysis of miR-143-5p expression in mouse abdominal aortic tissue. The uncropped original western blot images are shown in Supplemental Digital Content 1 (see File 1, https://links.lww.com/JCVP/A991). AAA versus Normal or control, **P ˂ 0.01, ***P < 0.001.Overexpression of TCF3 Promotes the Ang II-Induced M2 Macrophage Polarization and Inhibits MMP Secretion
Changes in the M1/M2 macrophage ratio can induce the formation of AAA by inducing vascular inflammation,30 whereas matrix MMPs promote the occurrence and development of AAA by degrading elastin and collagen in the aortic media.31 To investigate whether the role of TCF3 in AAA is related to M1/M2 macrophage polarization and MMPs, we isolated and cultured murine macrophages, and F4/80 is a recognized marker of murine macrophages. Flow cytometry showed that the proportion of macrophages was approximately 81.5%, indicating that macrophages of suitable purity had been obtained (Fig. 2A). We transfected the TCF3 expression vector into macrophages, resulting in TCF3 overexpression (Fig. 2B). The changes in the expression of MMP were detected, and the results showed that MMP activity was significantly reduced after oe-TCF3 transfection (Fig. 2C). The results showed that after TCF3 was overexpressed, the protein expression of MMP9 and MMP2 decreased (Fig. 2D), and the proportions of the M2 cell markers CD11b and CD163 in Ang II-induced macrophages were upregulated after oe-TCF3 (Fig. 2E). The expression of the M1 marker proteins CD68 and iNOS was downregulated in Ang II-induced macrophages after oe-TCF3, the expression of the M2 marker proteins CD163 and CD206 was upregulated (Fig. 2F), and the levels of the inflammatory factors IL-1β, IL-6, IL-18, and TNF-α were significantly decreased by oe-TCF3 (Fig. 2G). These results indicated that overexpression of TCF3 promoted the Ang II-induced M2 macrophage polarization, inhibited the secretion of MMP, and suppressed inflammatory factors.
 FIGURE 2.: TCF3 overexpression promotes the Ang II-induced M2 macrophage polarization and inhibits MMP secretion. A, Murine macrophages were identified by flow cytometry. B, Detection of the transfection efficiency of TCF3. C, Detection of MMP activity using a reagent kit. D, Western blot analysis of MMP9 and MMP2. E, Flow cytometric analysis of CD11b and CD163. F, Western blot analysis of M1 macrophage and M2 markers. G, ELISA analysis of inflammatory factors. The uncropped original western blot images are shown in Supplemental Digital Content 1 (see File 1, https://links.lww.com/JCVP/A991). Oe-TCF3 versus NC, *P ˂ 0.05, **P ˂ 0.01, ***P ˂ 0.001.Knocking Down TCF3 Inhibits the Ang II-Induced M2 Macrophage Polarization and Promotes MMP Secretion
To investigate whether the low expression of TCF3 in AAA affects M1/M2 macrophage polarization and MMP activity, we detected Ang II-induced macrophage MMP expression after knocking down TCF3 (si-TCF3). First, a western blot assay was used to detect the knockdown efficiency of si-TCF3, and the results showed that the expression of TCF3 decreased significantly after si-TCF3 transfection (Fig. 3A). The results of the MMP activity assay showed a significant increase in MMP activity after si-TCF3 treatment (Fig. 3B). Furthermore, the protein levels of MMP9 and MMP2 increased after the expression of TCF3 was decreased (Fig. 3C). Flow cytometry showed that the proportion of the M2 markers CD11b and CD163 in macrophages induced by Ang II was decreased by si-TCF3 (Fig. 3D). Western blot analysis showed that the expression of the M1 marker proteins CD68 and iNOS was upregulated in macrophages induced by Ang II after si-TCF3 transfection, whereas the expression of the M2 marker proteins CD163 and CD206 was downregulated (Fig. 3E). Finally, the expression level of inflammatory cytokines increased after si-TCF3 transfection (Fig. 3F). These results indicate that knocking down TCF3 can inhibit the Ang II-induced M2 macrophage polarization, promote MMP secretion, and promote inflammatory factor production.
 FIGURE 3.: Knocking down TCF3 inhibits the Ang II-induced M2 macrophage polarization and promotes MMP secretion. A, Detection of the transfection efficiency of TCF3. B, Detection of MMP activity using a reagent kit. C, Western blot analysis of MMP9 and MMP2. D, Flow cytometric analysis of CD11b and CD163. E, Western blot analysis of M1 macrophage and M2 markers. F, ELISA analysis of inflammatory factors. The uncropped original western blot images are shown in Supplemental Digital Content 1 (see File 1, https://links.lww.com/JCVP/A991). si-TCF3 versus NC, *P ˂ 0.05, **P ˂ 0.01, ***P ˂ 0.001.TCF3-Induced Transcriptional Activation of miR-143-5p
Previous studies have shown that the expression level of miR-143-5p in aneurysm tissues is lower than that in normal tissues.25 We selected 2000 bp upstream of hsa-miR-143-5p as the promoter region for potential transcription factor prediction and found that TCF3 may activate miR-143-5p through transcription, playing a role in AAA. JASPER website (https://jaspar.genereg.net/) analysis revealed the binding site of the transcription factor TCF3, which is shown in Figure 4A, and there is a possible binding site between the transcription factor TCF3 and the promoter sequence of miR-143-5p (−2000 bp) located between −598 and −607. Further ChIP experiments showed that TCF3 can act as a promoter to activate miR-143-5p (Fig. 4B). Next, we detected a positive regulatory relationship between TCF3 and miR-143-5p (Fig. 4C).
 FIGURE 4.:
 Detection of the regulatory relationship between TCF3 and miR-143-5p. A, The binding sites of the transcription factor TCF3 are shown in the figure. B, ChIP analysis of TCF3 transcriptional activation of miR-143-5p. C, RT‒qPCR analysis of miR-143-5p. Oe-TCF3 or si-TCF3 versus NC, ***P ˂ 0.001.
MiR-143-5p Affects Macrophage-Mediated Inflammation and MMP Secretion Through CCL20CCL20 is a chemokine that regulates inflammation,32 and miR-143-5p can bind with CCL20 to affect the development of renal fibrosis.28 In this study, the miRanda algorithm predicted the binding site of homo sapiens (hsa)-miR-143-5p and CCL20, as shown in Figure 5A. The dual luciferase reporter gene system was used to verify the targeting relationship between miR-143-5p and CCL20, and the results showed that miR-143-5p significantly inhibited the luciferase activity of wild-type CCL20, but had no effect on the luciferase activity of mutant CCL20 (Fig. 5B). Next, we verified the relationship between miR-143-5p and CCL20, macrophage-mediated inflammation, and MMP secretion after overexpressing miR-143-5p and CCL20 in Ang II-induced macrophages. The transfection efficiency of miR-143-5p and CCL20 was detected, and the results showed that transfection was successful (Figs. 5C, D). The results were clear: the activity of MMP and the protein expression of MMP9 and MMP2 were decreased in the miR-143-5p mimic group, and oe-CCL20 restored these changes (Figs. 5E, F). M2 and M1 markers in Ang II-induced macrophages were examined, and there was an increased expression of CD11b, CD163, and CD206 and a decreased expression of CD68 and iNOS after miR-143-5p mimic transfection; these effects were reversed by the addition of oe-CCL20 (Figs. 5G, H). The miR-143-5p mimic reduced the levels of IL-1β, IL-6, IL-18, and TNF-α, whereas oe-CCL20 upregulated their expression (Fig. 5I). In conclusion, miR-143-5p affects macrophage-mediated inflammation and MMP secretion through CCL20.
 FIGURE 5.: MiR-143-5p affects macrophage-mediated inflammation and MMP secretion through CCL20. A, Binding analysis of miR-143-5p and CCL20. B, Double luciferase reporter gene experiment. C, RT‒qPCR analysis of miR-143-5p transfection efficiency. D, Western blot analysis of CCL20 transfection efficiency. E, Analysis of MMP activity using a reagent kit. F, Western blot analysis of MMP9 and MMP2. G, Flow cytometric analysis of CD11b and CD163. H, Western blot analysis of M1 macrophage and M2 markers. I, ELISA analysis of inflammatory factors. The uncropped original western blot images are shown in Supplemental Digital Content 1 (see File 1, https://links.lww.com/JCVP/A991). MiR-143-5p mimic versus NC, miR-143-5p mimic +oe-CCL20 versus miR-143-5p mimic, *P ˂ 0.05, **P ˂ 0.01, ***P ˂ 0.001.Cell and Animal Studies on TCF3-Mediated M2 Polarization and Inhibition of MMP Secretion by Macrophages Through miR-143-5p/CCL20
To further validate that TCF3 can inhibit the secretion of MMP and affect AAA through miR-143-5p/CCL20-mediated M2 macrophage polarization in vitro and in vivo, we overexpressed TCF3, transfected the miR-143-5p mimic, and overexpressed CCL20 in Ang II-induced macrophages and AAA mouse models and detected the protein expression of MMP9 and MMP2, and the expression of M1 and M2 markers in cells. We also detected the pathologic changes and levels of inflammatory factors in the abdominal aortas of animals. Overexpression of TCF3 and miR-143-5p reduced the expression of MMP9 and MMP2 in Ang II-induced macrophages, whereas overexpression of CCL20 restored the effects of TCF3 and miR-143-5p overexpression (Fig. 6A). Overexpression of TCF3 and miR-143-5p inhibited the expression of M1 markers and promoted the expression of M2 markers in Ang II-induced macrophages, whereas overexpression of CCL20 reversed the effects of TCF3 and miR-143-5p (Fig. 6B). Flow cytometry showed that overexpression of TCF3 and miR-143-5p increased the proportion of the M2 markers CD11b and CD163 in Ang II-induced macrophages, whereas overexpression of CCL20 restored the effects of TCF3 and miR-143-5p overexpression (Fig. 6C). The appearance of mouse AAA shows that oe-TCF3 and the miR-143-5p mimic can reduce the diameter of AAA, whereas CCL20 overexpression can restore the effects of TCF3 and miR-143-5p overexpression (Fig. 6D). In addition, TCF3 and miR-143-5p overexpression can reduce the expression of CCL20, and this effect can be reversed by CCL20 overexpression. Overexpression of TCF3 significantly increased the expression of TCF3, and the miR-143-5p mimic and OE-CCL20 had no significant effects on the expression of TCF3 (Fig. 6E). HE and EVG staining showed that oe-TCF3 and the miR-143-5p mimic inhibited thickening of the abdominal aorta wall and rupture of the adventitia and inhibited fibrosis in the abdominal aorta and elastin degradation (Figs. 6F, G). ELISA showed that oe-TCF3 and the miR-143-5p mimic could reduce the inflammatory factors IL-1β, IL-6, IL-18, and TNF-α in AAA. CCL20 overexpression restored the effects of TCF3 and miR-143-5p overexpression (Fig. 6H). In summary, TCF3 can inhibit the secretion of MMP and inflammatory levels by mediating M2 macrophage polarization through miR-143-5p/CCL20, thereby inhibiting AAA progression.
 FIGURE 6.: Cell and animal studies on TCF3-mediated M2 polarization and inhibition of MMP secretion by macrophages through miR-143-5p/CCL20. A, Western blot analysis of MMP9 and MMP2 in macrophages. B, Western blot analysis of M1 macrophage and M2 markers. C, Flow cytometric analysis of CD11b and CD163. D, Apparent view of AAAs in mice. E, The expression of TCF3 and CCL20 was detected by immunohistochemical staining. F, HE staining of mouse abdominal aortas. G, EVG staining of mouse abdominal aortas. H, ELISA analysis of the expression of inflammatory factors in mice. The uncropped original western blot images are shown in Supplemental Digital Content 1 (see File 1, https://links.lww.com/JCVP/A991). oe-TCF3 versus NC, oe-TCF3+ miR-143-5p mimic versus oe-TCF3, oe-TCF3+ miR-143-5p mimic+oe-CCL20 versus oe-TCF3+ miR-143-5p mimic, *PPPDISCUSSION
There have been many studies on the role and mechanism of macrophage polarization in AAA.33–35 M1 macrophages mainly promote inflammatory reactions, and their surface molecules interact with initiating cytokines, leading to the production and release of inflammatory substances and promoting the rupture of arterial walls and tumor formation. In contrast, M2 macrophages mainly have anti-inflammatory effects, and their secreted cytokines can prevent damage to the abdominal aortic wall and promote vascular repair.36–38 In studying the polarization signaling pathways of macrophages, it was found that liver X-receptors, TGF- β 1 and NF- κB, have important regulatory effects on the polarization of M1 and M2 macrophages.39–41 To investigate the effects of macrophage polarization on AAA and the underlying molecular mechanisms, we constructed a AAA mouse model by treating murine macrophages with Ang II and inducing ApoE−/− mice. Ang II has a proinflammatory effect and can increase inflammatory markers and the production of free radicals, triggering inflammatory events, which may be the basis of Ang II-mediated induction of AAA.42 Because ApoE−/− mice lack the ApoE gene and lipids and cholesterol are more likely to accumulate in the aorta, leading to more severe atherosclerosis and inflammation, Ang II-infused ApoE−/− mouse models are commonly used in preclinical AAA studies.43 Our study showed that the aortic wall was damaged and elastin was degraded in the AAA group. In clinical AAA samples and AAA mouse models, the expression of TCF3 and miR-143-5p was low and negatively correlated with disease progression, whereas the expression of CCL20 was elevated in AAA.
TCF3, which is an important transcription factor, plays a role in regulating the occurrence or resolution of different diseases. TCF3 can activate Wnt/β signaling pathways by binding to the promoter region of FoxM1, which promotes the malignant biological behavior of colorectal cancer18; TCF3 has also been shown to regulate the progression of breast cancer.44 At present, the specific mechanism of TCF3 in AAA is still unclear. To determine the effect of TCF3 on the pathologic process of AAA, TCF3 was overexpressed or knocked down in Ang-II-induced macrophages, and it was found that TCF3 overexpression could promote the transformation of Ang-II-induced macrophages into the M2 phenotype. TCF3 overexpression also inhibited the release of inflammatory factors and the secretion of MMP, and the effect of knocking down TCF3 was opposite to those of overexpressing TCF3. Moreover, TCF3 overexpression can alleviate aortic wall thickening, injury, and elastic fiber degradation induced by Ang-II in AAA mice. These results suggest that TCF3 protects against Ang-II-induced AAA, and our study is the first to link TCF3 to Ang-II-induced AAA. TCF3 can recruit novel coactivators specifically through transcription activation domains 1 (AD1) in macrophages, thereby activating genes that regulate macrophage differentiation.45 However, whether TCF3 is involved in other diseases by regulating macrophage polarization remains to be investigated.
To verify the downstream mechanism of TCF3 in AAA, this study confirmed that miR-143-5p may be the downstream target gene of TCF3 through the JASPER website and ChIP experiments, and TCF3 can transcriptionally activate the expression of miR-143-5p. The expression of miR-143-5p is changed in colorectal cancer, pulmonary hypertension, bladder cancer, and other diseases,32,46,47 and may be used as a corresponding target. We found that miR-143-5p and TCF3 overexpression had similar effects on Ang-II-induced macrophages. In this study, miR-143-5p mimic was transfected after overexpression of TCF3, and it was found that TCF3 and miR-143-5p mimic had synergistic effects on AAA, which could further inhibit the progression of AAA. Moreover, our study showed that miR-143-5p, which is a noncoding RNA, further regulated the progression of AAA by inhibiting the expression of CCL20 through targeted binding.
CCL20 is a chemokine that regulates inflammation.48 CCL20 participates in the autoimmune response and the proliferation and differentiation of immune cells, thereby regulating, strengthening, or inhibiting inflammatory responses.49,50 Research has shown that the progression of AAA is often accompanied by inflammation.51 The local inflammatory response is an important cause of the formation of AAA, which damages the intima of the abdominal aorta wall and mediates the infiltration of inflammatory cells.52 The results of this study show that CCL20 overexpression can inhibit the protective effect of TCF3 and miR-143-5p against Ang-II-induced AAA, inhibit M2 macrophage polarization, promote the release of inflammatory factors and the secretion of MMP, promote the degradation and destruction of aortic elastin, and thus accelerate the progression of AAA.
These results indicate that TCF3 regulates macrophages through the miR-143-5p/CCL20 molecular axis to inhibit AAA, and our study indicates the importance of TCF3 in the occurrence and development of AAA.
CONCLUSIONSThrough animal and cell experiments, this study demonstrated that the transcription factor TCF3 could target the regulation of the miR-143-5p/CCL20 signaling axis, promote M2 macrophage polarization, inhibit the release of inflammatory factors and the expression of MMP, and thus inhibit the progression of AAA. At present, there have been only a few reports on the role of TCF3 in AAA. Our findings make TCF3 a promising new therapeutic target for AAA. Moreover, since there are many miRNAs involved in the progression of AAA,53 we need to further explore whether TCF3 also participates in AAA progression by regulating the expression of other miRNAs.
REFERENCES 1. Jana S, Hu M, Shen M, et al. Extracellular matrix, regional heterogeneity of the aorta, and aortic aneurysm. Exp Mol Med. 2019;51:1–15. 2. Sakalihasan N, Michel JB, Katsargyris A, et al. Abdominal aortic aneurysms. Nat Rev Dis Primers. 2018;4:34. 3. Zhang Y, Huang X, Sun T, et al. MicroRNA-19b-3p dysfunction of mesenchymal stem cell-derived exosomes from patients with abdominal aortic aneurysm impairs therapeutic efficacy. J Nanobiotechnol. 2023;21:135. 4. Mikami Y, Kyogoku M. [Inflammatory abdominal aortic aneurysm]. Nihon Rinsho. 1994;52:2148–2151. 5. Maegdefessel L, Azuma J, Tsao PS. MicroRNA-29b regulation of abdominal aortic aneurysm development. Trends Cardiovasc Med. 2014;24:1–6. 6. Raffort J, Lareyre F, Clément M, et al. Monocytes and macrophages in abdominal aortic aneurysm. Nat Rev Cardiol. 2017;14:457–471. 7. Davis FM, Gallagher KA. Epigenetic mechanisms in monocytes/macrophages regulate inflammation in cardiometabolic and vascular disease. Arterioscler Thromb Vasc Biol. 2019;39:623–634. 8. Sheu KM, Hoffmann A. Functional hallmarks of healthy macrophage responses: their regulatory basis and disease relevance. Annu Rev Immunol. 2022;40:295–321. 9. Hadi T, Boytard L, Silvestro M, et al. Macrophage-derived netrin-1 promotes abdominal aortic aneurysm formation by activating MMP3 in vascular smooth muscle cells. Nat Commun. 2018;9:5022. 10. Liu CL, Liu X, Zhang Y, et al. Eosinophils protect mice from angiotensin-II perfusion-induced abdominal aortic aneurysm. Circ Res. 2021;128:188–202. 11. Yunna C, Mengru H, Lei W, et al. Macrophage M1/M2 polarization. Eur J Pharmacol. 2020;877:173090. 12. Batra R, Suh MK, Carson JS, et al. IL-1β (Interleukin-1β) and TNF-α (tumor necrosis factor-α) impact abdominal aortic aneurysm formation by differential effects on macrophage polarization. Arterioscler Thromb Vasc Biol. 2018;38:457–463. 13. Funes SC, Rios M, Escobar-Vera J, et al. Implications of macrophage polarization in autoimmunity. Immunology. 2018;154:186–195. 14. Chen L, Wang S, Wang Z, et al. Construction and analysis of competing endogenous RNA network and patterns of immune infiltration in abdominal aortic aneurysm. Front Cardiovasc Med. 2022;9:955838. 15. Slattery C, Ryan MP, McMorrow T. E2A proteins: regulators of cell phenotype in normal physiology and disease. Int J Biochem Cel Biol. 2008;40:1431–1436. 16. Han X, Huang H, Gao P, et al. E-protein regulatory network links TCR signaling to effector Treg cell differentiation. Proc Natl Acad Sci U S A. 2019;116:4471–4480. 17. Cole MF, Johnstone SE, Newman JJ, et al. Tcf3 is an integral component of the core regulatory circuitry of embryonic stem cells. Genes Dev. 2008;22:746–755. 18. Zhao H, Zhao C, Li H, et al. E2A attenuates tumor-initiating capacity of colorectal cancer cells via the Wnt/beta-catenin pathway. J Exp Clin Cancer Res. 2019;38:276. 19. Su D, Ju Y, Han W, et al. Tcf3-activated lncRNA Gas5 regulates newborn mouse cardiomyocyte apoptosis in diabetic cardiomyopathy. J Cell Biochem. 2020;121:4337–4346. 20. Li L, Zheng YL, Jiang C, et al. HN1L-mediated transcriptional axis AP-2γ/METTL13/TCF3-ZEB1 drives tumor growth and metastasis in hepatocellular carcinoma. Cell Death Differ. 2019;26:2268–2283. 21. Simakou T, Freeburn R, Henriquez FL. Gene expression during THP-1 differentiation is influenced by vitamin D3 and not vibrational mechanostimulation. PeerJ. 2021;9:e11773. 22. Li X, Sanda T, Look AT, et al. Repression of tumor suppressor miR-451 is essential for NOTCH1-induced oncogenesis in T-ALL. J Exp Med. 2011;208:663–675.
Comments (0)