
記住我


JDNWF consists of ten herbs including Phyllanthus amarus Schumach. & Thonn, Trichosanthes kirilowii Maxim, Lysimachia christinae Hance, Astragalus mongholicus Bunge, Viscum coloratum (Kom.) Nakai, Panax notoginseng (Burkill) F.H.Chen, Curcuma phaeocaulis Valeton, Salvia miltiorrhiza Bunge, Rehmannia glutinosa (Gaertn.) DC and Aconitum carmichaelii Debeaux (Table 1). These 10 herbs were purchased from Beijing TongRenTang (Group) Co. Ltd., Beijing, China and mixed in the proportions previously described [16]. After soaking in distilled water for 4 h, Aconitum carmichaelii Debeaux. was boiled for 30 min first, followed by the remaining herbs being boiled together for 45 min. The liquid collected and the herbal mixture was boiled again for 30 min with distilled water. The two aqueous decoctions were mixed, filtered and subsequently concentrated. Finally, the decoction was concentrated at 4.34 g/ml for rat administration.
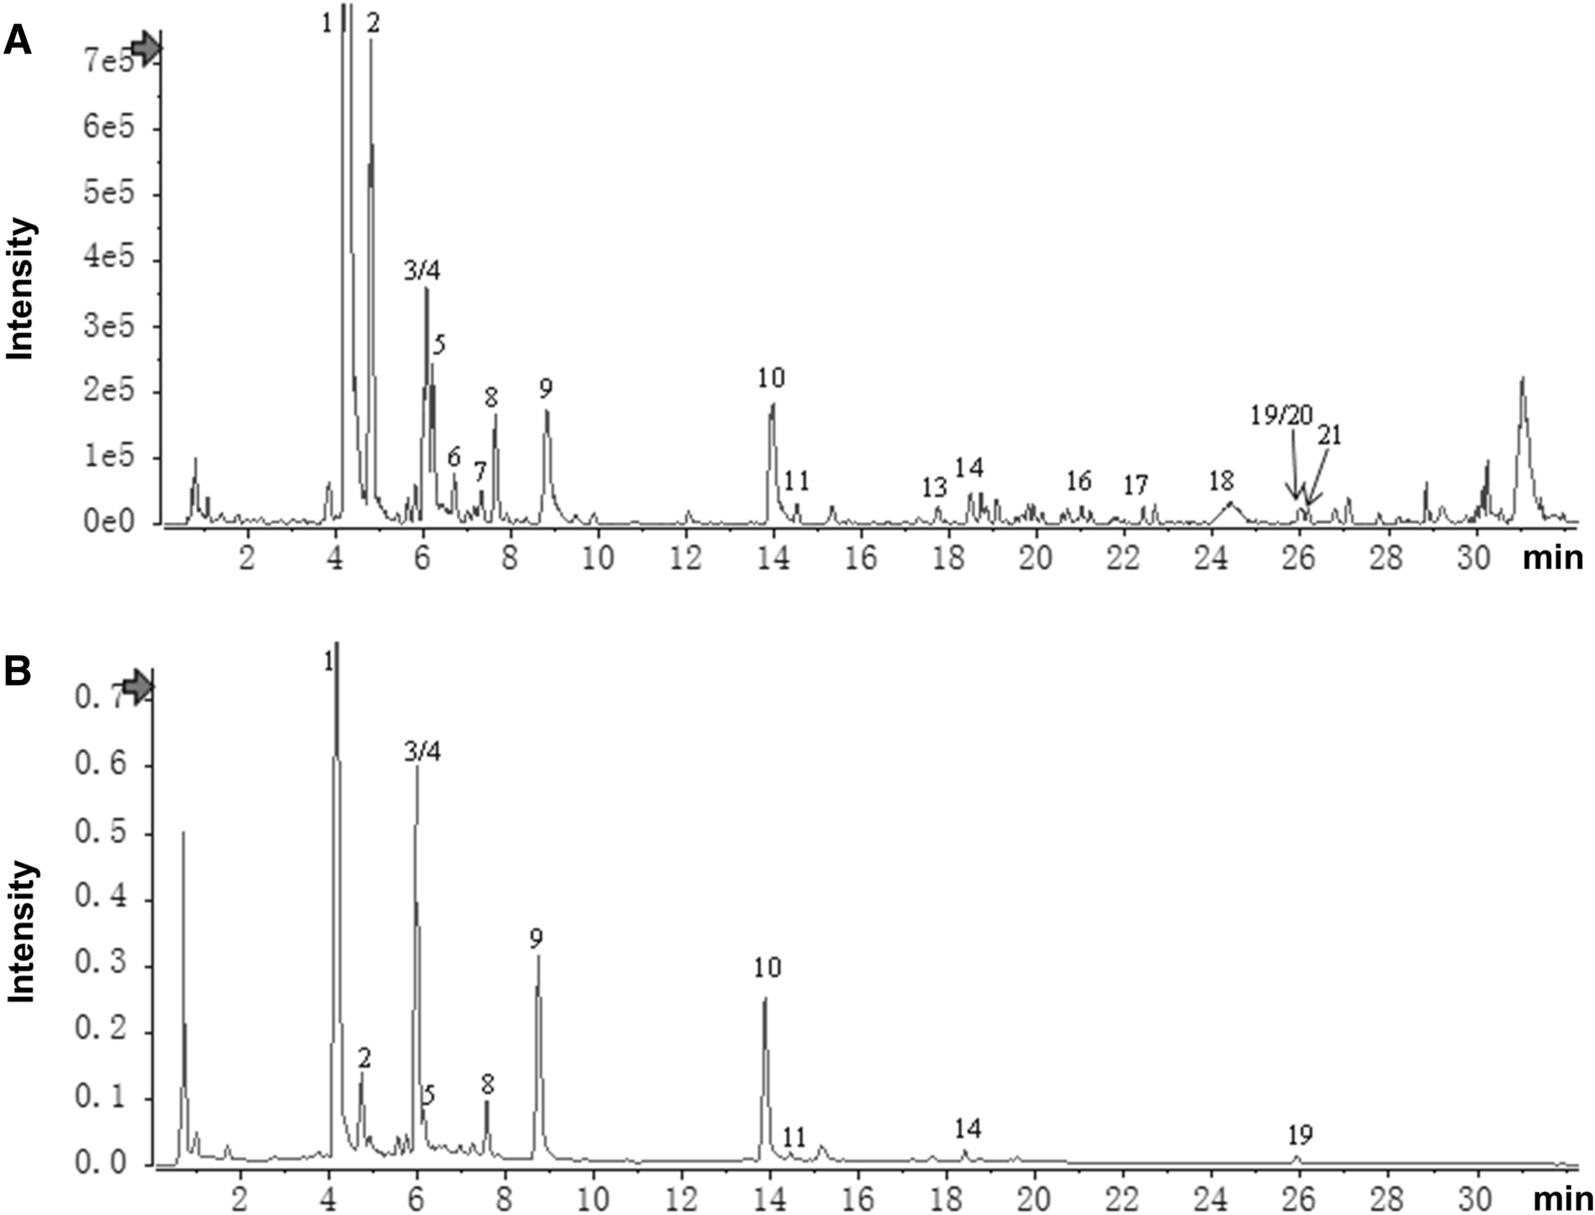
Table 1 The 10 botanical plant of JDNWFIdentification of compounds in JDNWF by UPLC- MS/MSFor quality control of JDNWF, samples were freeze-dried and ground into powder for UPLC-MS/MS analysis (UPLC, SHIMADZU Nexera X2; MS, Applied Biosystems 4500 QTRAP). An Agilent SB-C18 column (1.8 µm, 2.1 mm*100 mm) was employed and the mobile phases were pure water with 0.1% formic acid (A) and acetonitrile with 0.1% formic acid (B). The gradient elution degree was set as 5% B phase at 0 min and linearly increased to 95% (B) within 9 min, which was kept for 1 min. From 10 to 11 min, 5% (B) was adjusted and balanced at 5% to 14 min. The flow rate was 0.35 ml/min and 4 μl filtrate was injected for analysis with a column temperature at 40 °C. The positive and negative ion modes are controlled by Analyst 1.6.3 software (AB Sciex). Operating parameters of ESI source are as follows: ion source, turbine spray; Source temperature 550 °C; Ion spray voltage (IS) 5500 V (positive ion mode)/− 4500 V (negative ion mode); The ion source gas I (GSI), gas II (GSII) and curtain gas (CUR) are set to 50 psi, 60 psi and 25.0 psi respectively, and the collision-induced ionization parameter is set to high. Instrument tuning and quality calibration were performed with 10 and 100 μmol/l polypropylene glycol solution in triple quadrupole (QQQ) and LIT modes, respectively. QQQ scan uses MRM mode and sets collision gas (nitrogen) to medium. DP and CE of each MRM ion pair were completed by further DP and CE optimization. A specific set of MRM ion pairs was monitored at each period based on the eluted metabolites in each period. Compounds in JDNWF were identified, including quercetin, kaempferol, catalpol, notoginsenoside R1, gallic acid, tanshinone IIA, tanshinone I, cryptotanshinone, formononetin and luteolin. Chemical mass spectra of JDNWF and information of major components were shown in Additional file 1: Figure S1 and Table S1.
Animal and modelsWistar male rats, weighing 180–220 g, were purchased from Beijing Vital River Laboratory Animal Technology Co., Ltd., Beijing, China. The animal experiments were carried out in the Experimental Animal Center of Capital Medical University. All rats were fed and watered freely in a specified-pathogens free (SPF) environment at 20–25 ℃, 50% humidity and 12 h-light–dark cycle. The design and performing of animal experiments are approved by the Animal Experimentation and Laboratory Animal Welfare Committee of Capital Medical University. Rats were randomly divided into five groups: normal control group (NC, n = 9), ACLF model group (ACLF, n = 9), JDNWF treatment group (JDNWF, n = 9), mdivi-1 treatment group (mdivi-1) and chloroquine treatment group (CQ). Rats were fed adaptively for 7 days before the experiment. ACLF rat model was established according to previous reports (Fig. 1) [7]: Rats in the ACLF group and JDNWF group were injected intraperitoneally with 40% carbon tetrachloride (CCl4) olive oil solution (1.5 ml/kg) twice a week. After ten weeks, acute liver injury was induced by intraperitoneal injection of LPS (100 μg/kg) and D-GalN (400 mg/kg). Rats in the NC group were given equal doses of saline.
Fig. 1
Experimental procedures of model establishment
A week before the induction of acute liver injury, JDNWF group was given 21.7 g/kg JDNWF decoction for intragastric administration according to our previous studies [17]. Mdivi-1 group was intragastrically injected with mdivi-1 (1 mg/k) [18, 19] and CQ group was intragastrically injected with CQ (20 mg/kg) [20].Rats in each group were sacrificed 12 h after the acute attack. Before tissue collection, rats were anesthetized with 1% sodium pentobarbital (40 mg/kg) injected intraperitoneally. After rat was deeply anesthetized, blood was collected from the abdominal aorta and left to coagulate at room temperature for 4 h, followed by centrifugation at 4000 rpm for 15 min at 4 °C to obtain serum samples. The rat livers were completely removed and quickly rinsed in PBS. A fraction of the liver was fixed using 4% paraformaldehyde for histopathological observation and the remaining liver was stored at − 80 °C after rapid freezing in liquid nitrogen. The rat cervical vertebrae were dislocated for euthanasia.
Liver function assessmentThe levels of serum liver function indicators alanine aminotransferase (ALT), aspartate aminotransferase (AST), total bilirubin (TBIL), and albumin (ALB) were detected using a Hitachi 7600 automatic biochemistry analyzer (Hitachi, Tokyo, Japan).
Coagulation function assayActivated partial thromboplastin time (APTT), prothrombin time (PT), international normalized ratio (INR) and Fibrinogen (FIB) levels were measured in rat plasma treated with Na-citrate using a Beckman Coulter ACL-TOP 700 coagulation analyzer (Beckman/Instrumentation Laboratory, Florida, USA).
Histological examinationThe liver tissue fixed with paraformaldehyde was embedded in paraffin and then stained with hematoxylin–eosin (HE) and Masson. The stained samples were scanned by Pannoramic SCAN (3D HISTECH) to obtain images.
Ultrastucture observationSamples for observation by transmission electron microscope (TEM) were processed as in previous studies [7] and the mitochondrial structure was observed using a Hitachi 7700 TEM (Hitachi, Tokyo, Japan).
Non-targeted metabolomics analysisSample preparation and quality controlA 100 mg sample of tissue ground in liquid nitrogen was vortexed and shaken with 500 μl of 80% methanol in water, left to stand for 5 min in an ice bath, and centrifuged at 15,000g for 20 min at 4 °C. The methanol concentration was diluted to 53% with mass spectrometry grade water. The supernatant was collected by centrifugation at 15000g for 20 min at 4 °C and analyzed by LC–MS. The Q-Exactive HF-X Mass Spectrometer was connected in tandem with Vanquish UHPLC system. To ensure the stability and reproducibility of the instrumental analysis, quality control (QC) samples were prepared by mixing equal amounts of each sample. Three QC samples were inserted to balance the LC–MS system before testing the sample. After that, four QC samples were inserted during the sample testing to evaluate the stability of the system. Besides, blank samples were set for excluding background ions. Finally, PCA analysis was used to visualize the testing samples and QC samples, and showed an aggregation of QC sample points, suggesting no signal drift. Besides, PC1 values of all sample were also used to assess whether the laboratory sample is outlier and sample points outside the control limit (mean ± 3SD) are considered outliers. As shown in Additional file 1: Figure S2, most of the points were distributed within mean ± 2SD (Additional file 1: Figure S2).
LC–MS/MS analysisAll samples were analyzed in both positive and negative mode. The spectra were performed on a Hypesil Gold column (C18) (100 mm × 2.1 mm, 1.9 μm). The mobile phase in the positive mode consisted of 0.1% formic acid (A) and methanol (B) in the positive mode and 5 mM ammonium acetate (A) and methanol (B) in the negative mode. The gradient elution times were 0 min, 98% (A), 2% (B); 1.5 min, 98% (A), 2% (B); 12 min, 0% (A), 100% (B); 14 min, 0% (A), 100% (B); 14.1 min, 98% (A), 2% (B); 17 min, 98% (A), 2% (B). Scanning range 100–1500 m/z. ESI source Settings are as follows: Spray Voltage:3.2 kV; Sheath gas flow rate:40 arb; Aux Gasflow rate:10 arb; For Capillary Temp:320 °C. MS/MS secondary scanning is data-dependent scan.
Data processingThe chromatograms obtained from LC/MS analysis were imported into Compound Discoverer 3.1 (ThermoFisher Scientific, USA) for processing and filtering based on retention time, mass-to-charge ratio, and other parameters. The peak alignment parameters for each sample are set to a retention time deviation of 0.2 min and a mass deviation of 5 ppm. Peak extraction was then performed based on a mass deviation of 5 ppm, a signal intensity deviation of 30%, a signal-to-noise ratio of 3, minimum signal intensity, and summed ions and compared with mzCloud (https://www.mzcloud.org/), mzVault and Masslist databases. A mass tolerance range of 5 ppm was set for matching the compounds we assayed to the metabolite information in the database. According to the mzCloud database, if the mass difference between the two parent ions is well within the mass tolerance, the test compound was considered as full match to that metabolite in the database. Otherwise, a further prediction based on the mzVault and MassList databases was perform to compare the daughter ion fragments. After the above steps, a data normalization was carried out on the peak areas of the metabolites. Firstly, the abundance of all features in each sample was divided by the median abundance of that sample to correct the sample library size. Then, log transformations were performed on all metabolite contents to correct the content matrix to bring the metabolite content distribution close to normality. Finally, the abundance of all samples corresponding to the feature was subtracted from the mean of that feature abundance and divided by the standard deviation of that feature so that the mean and standard deviation of all metabolites were at the same level. After normalization, the median and upper and lower quartiles of metabolite content were essentially at the same level.
Multivariate analysis and metabolic pathways enrichmentThe processed metabolite data were uploaded to Wekemo Bioincloud (https://bioincloud.tech/) for further analysis. Enrichment analysis of liver differential metabolites in each group of rats was performed with Over-Representation Analysis (ORA) provided on the website. Differences in metabolic patterns between groups were identified by principal component analysis (PCA), orthogonal partial least squares discriminant analysis (OPLS-DA). Differences in various metabolites between groups were compared using a two-sided t-test, and differential metabolites were screened in the OPLS-DA model based on parameters of P < 0.05, VIP > 1. Finally, the marker metabolites screened based on OPLS-DA model were uploaded to MetaboAnalyst 5.0 (https://www.metaboanalyst.ca/faces/home.xhtml) for pathway analysis.
Liver ATP and serum GDH assayFrozen liver in frozen double-distilled water to make a 10% homogenate. Liver ATP levels were assayed according to the instructions provided in the kit (Nanjing Jiancheng Bioengineering Insitute, Nanjing, China). The serum obtained was used to detect GDH activity, according to the instructions provided with the kit (Nanjing Jiancheng Bioengineering Insitute, Nanjing, China).
Energy metabolism markers lactate and NAD + /NADH assayThe serum obtained was used to detect lactate, according to the instructions provided with the kit (Nanjing Jiancheng Bioengineering Institute, Nanjing, China). Frozen liver in frozen double-distilled water to make a 10% homogenate. Liver NAD + /NADH ratio was assayed according to the instructions provided in the kit (Beyotime, Shanghai, China).
Mitochondrial membrane potential analysisFluorescent probe JC-10 (4A Biotech, Beijing, China) was used to estimate mitochondrial membrane potential (MMP). Single cell suspension was prepared from fresh rat liver and incubated with 20 μM JC-10 solution for 30 min in dark light according to the kit instructions. Finally, fluorescence changes of Ex/Em = 490/525 and 490/590 were detected by FL1 and FL2 channels with NovoCyte 3130 (ACEA Biosciences, USA).
Markers of oxidative stress (MDA, SOD and GSH) assayLiver tissue homogenates were prepared for MDA, SOD and GSH assays according to the instructions of the kit (Beyotime, Shanghai, China).
Activity of metabolic enzymes involved in the TCA cycleDetection of hepatic alpha-ketoglutarate dehydrogenase (α-KGDH), fumarase (FUM), cytosolic isocitrate dehydrogenase (ICDHc), succinate dehydrogenase (SDH), cis-aconitate dehydrogenase (ACO), and mitochondrial isocitrate dehydrogenase activity (ICDHm) in rats according to the kit instructions (Kang Jia Hong Yuan Biological Technology Co., Ltd, Beijing, China).
The level of inflammatory factors TNF-α and IL-6The levels of liver inflammatory factor TNF-αand IL-6 were measured in each group according to the ELISA kit instructions (Kang Jia Hong Yuan Biological Technology Co., Ltd, Beijing, China).
Western blot analysisThe liver tissue protein samples (3 μg/μl) were collected as previously described and subsequently separated by SDS polyacrylamide gel electrophoresis (SDS-PAGE) and transferred to PVDF membranes. After blocking with 5% skimmed milk powder, the bands were incubated overnight at 4 °C with the appropriate primary antibodies against PGC-1α (1:3000, Proteintech, USA), NRF1 (1:1000, Cell Signaling Technology, USA), TFAM (1:1000, Proteintech, USA), MFN2 (1:1000, Cell Signaling Technology, USA), DRP1 (1:1000, Cell Signaling Technology, USA), PINK1 (1:1000, Proteintech, USA), Parkin (1:1000, Cell Signaling Technology, USA), LC3B (1:500, Genetex, USA), P62 (1:200, Santa Cruz, USA), and β-actin (1:1000, Cell Signaling Technology, USA). Bands were washed with TBST and incubated with the corresponding secondary antibody, including Donkey Anti-Mouse IgG (Proteintech, USA) and Goat Anti-Rabbit IgG (Lablead, China), for 1 h at room temperature. Protein expression was observed using a Vilber FUSION FX6 XT gel chemiluminescence imaging analysis system (Vilber Lourmat, Marne La Vallee, France). The images were analyzed semi-quantitatively using ImageJ software. Results are presented as the ratio of the target protein to reference protein.
Statistical analysisMetabolomics-related data were analyzed as described above. Other data were analyzed using GraphPad software (Prism 7.00). For comparison of two groups, the t-test was used for data with equal variance, otherwise, the Mann–Whitney test was used; for comparison of multiple groups, the one-way ANOVA was used for data with equal variance, otherwise, the Kruskal-Walli’s test was used. P < 0.05 were statistically significant.
留言 (0)