This study followed the Strengthening the Reporting of Observational Studies in Epidemiology (STROBE) reporting guidelines.
Study design and population
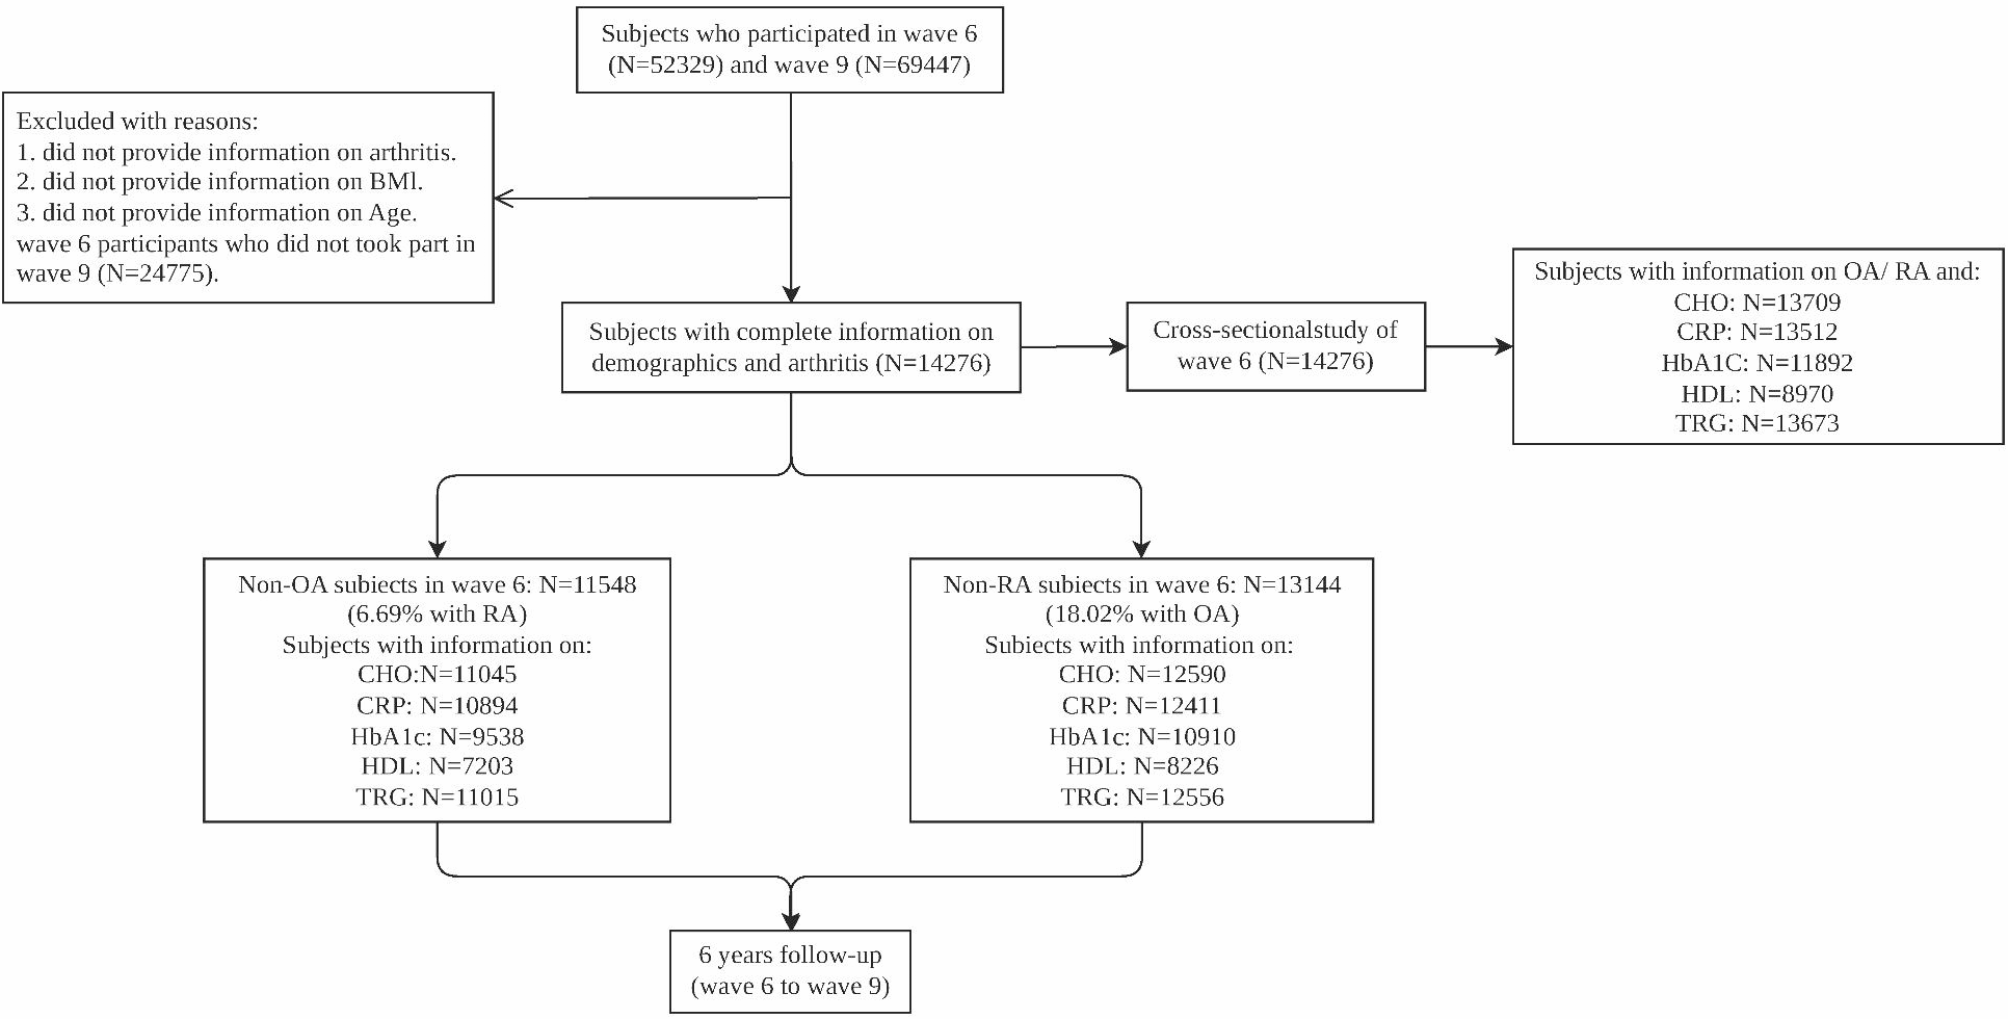
Individual participants were enrolled in the Korean Genome and Epidemiology Study-Health Examinees Cohort (KoGES-HEXA). Individuals (n = 173,195) from all eight regions of Korea were enlisted between 2004 and 2013. A total of 38 different health facilities served as recruitment centers [25, 26]. Among the 173,195 participants, 130,219 agreed to have their data connected to the National Statistical Office mortality records. After excluding 15,262 participants with missing IR index data, 114,957 participants (aged 40–79 years) were included in the analysis, of whom 75,251 (65.5%) were women (Fig. S1).
Exposure variables
The main exposure variables were individual anthropometric (BMI and WC) and biochemical (FBG, HDL-C, and TG) parameters, and their composite IR indices (TyG, TyG-BMI, TyG-WC, METIR, LAP, and VAI), as described in the following subsections.
Anthropometric measurements
The participants’ height (in meters) and weight (in kilograms) were recorded while they were barefoot and dressed in light clothing. For each individual, BMI was calculated as the fraction of their weight and the square of their height. WC was measured along the horizontal line equidistant from the lowest rib and the top of the hip bone.
Biochemical measurements
After overnight fasting, a minimum of 19 cc of blood was collected in a serum separator tube and two tubes containing ethylenediaminetetraacetic acid. The samples were then transferred to conical tubes and subjected to further handling. Each biospecimen was assigned a unique identification that corresponded to each participant’s questionnaire and was marked with a 2D barcode sticker. Biospecimens were stored in refrigerators at each healthcare facility until they were transported by a courier from a commercial laboratory within 24 h. Subsequently, various tests were conducted on these specimens [25]. Baseline biochemical variables were quantified using enzymatic calorimetric methods with automatic analyzers (ADVIA 1650 and 1800; Siemens, Tarrytown, NY, USA). Surrogate IR indices were calculated based on anthropometric and biochemical measurements (Table 1).
Table 1 Calculation of IR indicesOutcome measures
Deaths from all causes, cancer, and CVD that occurred between recruitment and December 31, 2020 were ascertained by linking each participant to mortality records from the Korean National Statistical Office, or the National Health Insurance Service for Medicaid recipients. Cancer and CVD mortality was defined using the 10th revision of the International Classification of Disease codes (ICD 10).
Assessment of covariates
A standardized interviewer-administered questionnaire was used to assess the age, sex, educational level, household income, region of residence, alcohol consumption, smoking habits, regular practice of physical exercise, and history of medical conditions. Covariates were defined as follows: Current alcohol drinking was defined as a history of alcohol consumption and consumption during study recruitment; current smoking was defined as a history of smoking more than 400 cigarettes over the participant’s lifetime, and current smoking during the study recruitment [27]; and regular physical exercise was defined as participating in activities that induced perspiration five or more days a week, with each session lasting for a minimum of 30 min.
The baseline prevalence of CVD, chronic obstructive pulmonary disease, chronic gastritis, and cancer were defined based on a self-reported diagnosis and intake of prescribed medication for the above conditions. A diagnosis of diabetes was based on FBG levels ≥ 126 mg/dl or being on diabetes treatment. Hypertension was determined based on the following clinical criteria: systolic blood pressure ≥ 130 mmHg, diastolic blood pressure ≤ 85 mmHg, or currently receiving antihypertensive pharmacotherapy [28]. The presence of CKD was based on an estimated glomerular filtration rate (eGFR) < 60 mL/min/1.73 m2 [29]. Disease scores were derived from the sum of the chronic morbidities at baseline.
Statistical analysis
Person-years for each individual were computed by subtracting the study entry date from the date of death or December 31, 2020, with the earlier of the two considered first. Missing data on income was assigned “unknown” (8.7%), while missing data on each categorical covariate was replaced by the mode (< 5%). Continuous variables were expressed as either the mean value accompanied by its standard error, or the median value followed by its interquartile range. Categorical variables were expressed as frequencies (percentages). Participant characteristics were compared across fifths of TyG-BMI using general linear models and chi-square tests.
The participant characteristics associated with mortality in the Korean population were included in models as covariates [30]. The proportionality of hazards was evaluated using the Wald test. Nonlinear associations between basic biochemical and anthropometric measurements, IR indices, and mortality were modelled using restricted cubic spline (RCS) models [31]. Age (spline), sex, education level, monthly family income, region of residence, alcohol consumption, smoking habits, regular physical exercise, high sensitivity C-reactive protein (hs-CRP; continuous), disease score (only for all-cause mortality), baseline history of cancer (for cancer-specific mortality), and baseline history of CVD (for CVD-specific mortality) were included in the models.
Two steps were implemented to evaluate whether IR indices provided additional predictive information for mortality outcomes beyond basic anthropometric and biochemical measurements. First, a baseline model that included the covariates described above, was built for comparison with the model that additionally included individual measurements or their indices. Subsequently, the adequacy index (AI) was computed. The AI is the ratio of the log-likelihood (LL) of the baseline model to that of the models containing individual biochemical measurements or IR indices. The percentage of variation explained by each measurement (additional predictive information provided to the baseline model) was computed as (1-AI) x100. The percentage of variation indicates the differences in the risk of mortality due to a specific variable in the model [32].
As for sensitivity analyses, deaths reported in the first two years after study entry were excluded to account for latent period bias. Additionally, participants who reported at least one chronic disease at baseline were excluded.
The SAS statistical package (version 9.4; SAS Institute Inc., Cary, NC, USA) was used for data analyses. A P value < 0.05 was set as statistically significant.


Comments (0)