Cell lines
UM cell lines 92.1, Mel202, Mel270 and Mel290 were cultured in 5% CO2 in RPMI media supplemented with 10% tetracycline-free HI FBS, 2 mM Glutamax, and 1× Pen/Strep. MP41 UM cells were cultured in 5% CO2 and 5% O2 in DMEM/F12 media supplemented with 10% tetracycline-free HI FBS, 2 mM Glutamax, 1 mM NEAA, 0.5x ITS, and 1× Pen/Strep. Non-transformed human uveal melanocytes (UMCs) were cultured in 5% CO2 and 5% O2, in Ham’s F12 supplemented with 10% tetracycline-free HI FBS, 2 mM Glutamax, 1× Pen/Strep, 100 µM IBMX, 10 ng/ml human bFGF and rSCF, and cholera toxin.
Single-cell RNA sequencing
Human testis scRNA-seq data was obtained from a public single-cell atlas [47]. Seurat (version 3.2.2) [48] was utilized for processing and clustering cells. Cells were filtered for a minimum of 500 features and less than 20% mitochondrial RNA content. Samples were integrated using 5000 variable features with percent mitochondrial content regressed. Uniform Manifold Approximation and Projection (UMAP) dimensional reduction was conducted based on the first 30 principal components, and cells were clustered using shared nearest neighbor (SNN) algorithm with a resolution of 0.25. Cell type annotation was assigned by cell cluster, based on expression of marker genes [47]. The clustered dot plot was generated using ComplexHeatmap (Version 2.14) [49]. The dot color encodes the average RNA expression while the dot size indicates percentage of cells in a group expressing a gene of interest. Genes were hierarchical clustering based on their average RNA expression.
Chromatin immunoprecipitation and DNA sequencing
Chromatin immunoprecipitation (ChIP) followed by next-generation sequencing (ChIP-seq) was performed using 20 million cells per experiment. Cells were crosslinked for 7 min with 1% formaldehyde, then DNA was sonicated to an average fragment size of 200–500 base pairs using a Covaris M220 sonicator. Fragmented DNA was incubated with 10 µg of the following antibodies: Pol2 (Diagenode, C15200004), H3K27AC (Active Motif, 39133), H3K4me3 (Active Motif, 39915). Libraries were prepared using the NEBNext Ultra 2 kit (NEB, E7645S) and sequenced by the OGSR with >20 million reads per sample. Reads were filtered for quality by Trim Galore! (https://github.com/FelixKrueger/TrimGalore) and aligned to the hg38 genome with Bowtie2 [50], and visualized with SparK [51]. The location of putative G-quadruplex forming regions was determined using the G4P Calculator [52].
Plasmids and lentiviral expression vectors
The pLV-TET-PRAME-V5 vector was created by PCR amplification of human full-length PRAME cDNA fragment (Horizon # MHS6278-202802292) and subsequent recombination into a pLV-TET-C-V5 plasmid encoding C-terminal V5. Plasmids containing FLAG-tagged PRAME and BioID2-tagged PRAME were created by substituting the C-terminal V5 tag with FLAG or FLAG-BioID2 fragments, respectively, using restriction digestion and T4 ligation. MP41s with knockout of PRAME were created using lentiviral particles encoding spCAS9 (Addgene plasmid no. 50661) and guide RNA-encoding plasmid (Addgene plasmid no. 64114). Guide RNA against PRAME 5’-GGGACAGGATACAGCACGT-3’ and 5’-CCGGCAGTTAGTTATTGAG-3’ directed the CRISPR-mediated deletion of the first exon of the PRAME gene. The pLV-TRPM1-LUC vector expressing luciferase under TRPM1 promoter was synthesized by VectorBuilder. The lentiviral plasmids were packaged into lentiviral particles by transient co-transfection into HEK293T cells with pMD2G and psPAX2 packaging plasmids using JetPrime reagent (Polyplus). The lentivirus transduced cells were selected with puromycin for 7 days, clonally selected for optimal PRAME knockout or overexpression upon induction with 1 µg/ml doxycycline. Gene knockout and overexpression was verified with western blot (Supplementary Fig. 2). Biotinylation was induced with 30 µM biotin over 5 days and confirmed by WB. The TRPM1 promoter luciferase reporter plasmid was stably integrated into cells by lentiviral transduction.
Bulk RNA sequencing
RNA was isolated with Direct-zol RNA kit (Zymo Research, USA) according to the manufacturers’ instructions. Library preparation and sequencing was conducted at the Oncogenomics Shared Facility (OGSR) of the University of Miami Sylvester Comprehensive Cancer Center. Reads were trimmed using Trim Galore! (https://github.com/FelixKrueger/TrimGalore) and aligned to the human genome build hg38/GRCH38 using STAR [53]. Read counts were normalized and batch corrected then assessed for differences in expression between groups using EdgeR [54]. Pathway analysis was conducted with Metascape [55].
Co-Immunoprecipitation and mass spectrometry
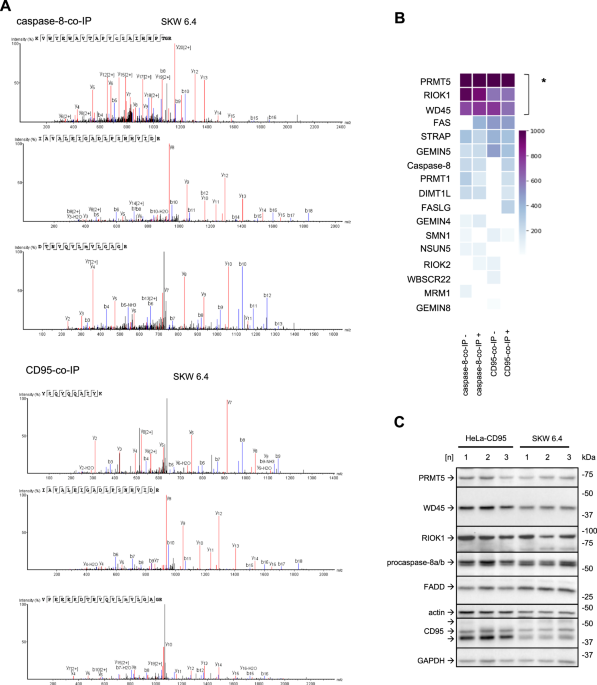
Cells were washed in ice-cold PBS twice, lysed in lysis buffer [20 mM Tris, 137 Mm NaCl, 2 mM sodium pyrophosphate, 1 mM sodium orthovanadate, 1 mM NaF, 2 mM EDTA, 1% Triton X-100 and 10% glycerol supplemented with Halt Protease Inhibitor Cocktail (Thermo Scientific, 87786)], scraped, collected in a 1.7 mL tube and incubated by constant rotation for 1 h at 4 °C. Lysates were centrifuged at 10.000 g for 10 min at 4 °C, supernatants were placed in a new 1.7 mL tube, precleared with 25 µL of Protein A Dynabeads (Invitrogen, 10002D) for 1 h with gentle mixing at 4 °C and separated from beads with a magnet. Pre-clear lysates were incubated with 10 µg of SMC1a antibody (Bethyl, A300-055AA), 10 µg IgG Rb antibody (Proteintech, 30000-0-AP), or FLAG M2-conjugated beads (Sigma, A2220) for IP overnight at 4 °C on a rotator. Antibody IPs were bound to Protein A Dynabeads (Invitrogen, 10002D) for 2 h at 4 °C on a rotator. The beads were washed three times with ice-cold lysis buffer, divided equally into two 1.7 mL tubes and separated from the lysate by magnets. One set was used for western blotting, the other set of divided beads was sent for mass spectrometry at either the Proteomics & Metabolomics Core Facility at the Moffitt Cancer Center (Tampa, FL) or the Wistar Institute (Philadelphia, PA).
For western blotting, one set of the divided beads was eluted with SDS-loading buffer, separated through precast polyacrylamide gel (4–15%) (Bio-Rad, 5678084) and transferred to nitrocellulose membrane via Trans-Blot Turbo System (Bio-Rad, 170–4159). Membrane was blocked with 5% BSA in 1x TBS for 1 h at room temperature (RT), followed by incubation with SMC1a antibody (Cell Signaling, 6892) diluted in 5% BSA in 0.1% Tween20 in 1x TBS (TBS-T) overnight at 4 °C. Membrane was washed with 1x TBS-T three times, incubated in anti-mouse IgG horseradish peroxidase (HRP)-linked antibody (Cell Signaling, 7076 S) in TBS-T for 1 h at RT, washed with TBS-T three times, incubated with SuperSignal West Femto Maximum Sensitivity Substrate chemiluminescence reagent (Thermo Scientific, 34096) and visualized on an Amersham Imager 680 (GE Healthcare). Images were quantified using ImageJ software. Western blot was probed using antibody against STAG2 (Santa Cruz, sc-81852). The same membrane was stripped with Restore Plus Western blot stripping buffer (Thermo Scientific, 46430) and re-probed with SMC1A antibody (Bethyl, A300-055AA) to ensure equal protein loading. Anti-rabbit HRP-linked IgG (Cell Signaling, 7074P2) was used as a secondary antibody. Experiments were repeated at least three times.
For ubiquitomic and FLAG-PRAME mass spectrometry, 300 million cells per experiment were washed in cold PBS containing Halt Protease Inhibitor Cocktail (Thermo Scientific, 87786), pelleted before flash freezing, and further processed by the Proteomics & Metabolomics Core Facility at the Moffitt Cancer Center (Tampa, FL). Following lyophilization, the dried peptide pellet was re-dissolved in IAP buffer containing 50 mM MOPS pH 7.2, 10 mM sodium phosphate and 50 mM sodium chloride. Acetyl-Lysine-containing peptides were immunoprecipitated with immobilized anti-Ubiquitin Remnant Motif (K-ε-GG) antibody. (Cell Signaling Technology #5562) After two hour incubation, the antibody beads were washed 2 times with IAP buffer, followed by 3 washes with H2O. The Ubiquitinated peptides were eluted twice with 0.15% TFA. Peptide offline fractionation was performed using bRPLC cartridge (Thermo 84868) according to manufacture protocol. 4 fractions were collected from each sample. A nanoflow ultra high performance liquid chromatograph (RSLC, Dionex, Sunnyvale, CA) coupled to an electrospray bench top orbitrap mass spectrometer (Q-Exactive plus, Thermo, San Jose, CA) was used for tandem mass spectrometry peptide sequencing experiments. The sample was first loaded onto a pre-column (2 cm × 100 µm ID packed with C18 reversed-phase resin, 5 µm, 100 Å) and washed for 8 min with aqueous 2% acetonitrile and 0.04% trifluoroacetic acid. The trapped peptides were eluted onto the analytical column, (C18, 75 µm ID × 25 cm, 2 µm, 100 Å, Dionex, Sunnyvale, CA). The 120-min gradient was programmed as: 95% solvent A (2% acetonitrile + 0.1% formic acid) for 8 min, solvent B (90% acetonitrile + 0.1% formic acid) from 5% to 38.5% in 90 min, then solvent B from 50 to 90% B in 7 min and held at 90% for 5 min, followed by solvent B from 90 to 5% in 1 min and re-equilibrate for 10 min. The flow rate on analytical column was 300 nl/min. Spray voltage was 1900v. Capillary temperature was 275 °C. S lens RF level was set at 40. Sixteen tandem mass spectra were collected in a data-dependent manner following each survey scan using 15 s exclusion for previously sampled peptide peaks. MS and MS/MS resolutions were set at 70,000 and 17,500, respectively. MaxQuant (version 1.6.14.0) was used to identify modified peptides and quantify the relative intensities. Protein database was downloaded from Uniprot in March 2020. Up to 4 missed trypsin cleavage was allowed. Carbamidomethyl cystine was set as fixed modification. Lysine ubiquitination and Methionine oxidation was set as variable modification. Both PSM and peptide FDR were set at 0.05. Match between runs feature was activated.
Telomere staining
For metaphase analysis cells were incubated with 50 ng/ml colcemide in cell culture media for 3 h, harvested by trypsinization, incubated for 10 min at RT in 75 mM KCl, and fixed in freshly prepared methanol:glacial acetic acid (3:1 v/v). Cells were stored at 4 °C and when needed dropped onto wet slides and air-dried. For FISH analysis of the metaphases the cells were pre-treated with 0.05% w/v pepsin in 10 mM HCl during 10 min at 37 °C. After washes with 1x PBS, cells were fixed with 1% formaldehyde in 1x PBS during 10 min at RT, washed again with 1x PBS and dehydrated with ethanol series (70-90-100%, 2 min each at RT) and air-dried ON. Then, cells were denatured with hybridization solution (70% deionized formamide; 2.5% 50x Denhardt’s solution; 10 mM Tris pH 7.5; 1.5 mM MgCl2) containing Alexa488-conjugated PNA probe (Alexa488-OO-(CCCTAA)3) 2 min at 80 °C on a heat block. After 4 h incubation at RT in the dark, the samples were washed twice with wash solution (70% deionized formamide and 10 mM Tris-HCl [pH 7.2]) at RT and then twice with PBS. For DAPI staining of DNA, slides with metaphase spreads were incubated 10 min in 0.5 μg/ml 4’, 6-diamino-2-phenylindole (DAPI) (Sigma) in PBS, washed with PBS for 2 min, and mounted in SlowFade Gold antifade mounting reagent (Life Technologies). Finally, the samples were analyzed as described above. Where indicated, metaphases were spread as previously described [56]. Anaphase cells were visualized by DAPI staining of cells fixed with 2% paraformaldehyde in 1× PBS and attached to slides pre-treated with poly-lysine and analyzed as previously described [56]. A total of 50 anaphases were analyzed for each cell line per experiment.
DNA damage foci assay
Mel290 cells and UMCs with stably integrated constitutive PRAME expression vector or empty vector were plated in 100 mm dishes in duplicates. Once cells reached approximately 70% confluency, one set was exposed to 4 Gy of ionizing radiation (IR) from CIX3 320 kV Self-Contained Cabinet Irradiator (XStrahl, Suwanee, GA) and put back inside the cell incubator for 6 h. The two sets of cells (control and irradiated) were washed with 1x PBS twice, fixed with 2% formaldehyde in PBS for 10 min at RT, washed again with PBS twice and bound to poly-L-lysine coated slides. After a wash with PBS for 5 min, cells were incubated with Blocking Solution (1 mg/ml BSA, 5% horse serum, 0.1% Triton X-100 in PBS) for 30 min at RT. Next, the cells were incubated with the primary antibodies in Blocking Solution for 1 h at RT, washed three times with PBS, and incubated with donkey anti-rabbit Alexa Fluor 488 (Invitrogen, A-21206) and donkey anti- mouse Alexa Fluor 594 (Invitrogen, A-21203) for another 30 min. Finally, cells were incubated with 0.5 μg/ml 4’, 6-diamino-2-phenylindole (DAPI) (Sigma Aldrich, D9542) in PBS for 5 min, washed with PBS for 2 min, air dried, and mounted in SlowFade Diamond antifade mounting reagent (Invitrogen, S36972). Samples were analyzed using a Leica DMI6000B microscope with LASX software (Leica). At least 500 cells were analyzed per cell line/experiment. We performed 3 independent experiments. Antibodies to the following proteins were used: 53BP1 (Novus Biologicals, NB100-304), BRCA1 (EMD Millipore, 07-434), γ-H2AX (Ser 139) clone JBW301 (EMD Millipore, 05-636) and RAD51 (Bio Academia, 70-001).
Homologous recombination assay
Mel290-EV and Mel290-PRAME cells (1 × 10⁶ cells per sample) were transfected with pDR-GFP (Addgene plasmid # 26475) using jetPRIME DNA and/or siRNA transfection reagent (Polyplus) and selected for puromycin resistance (2 μg/ml). Upon 60% confluence, the cells were transfected with a plasmid expressing the restriction enzyme I-SceI (pCBASce1) (Addgene plasmid # 26477) using jetPRIME DNA and/or siRNA transfection reagent (Polyplus). This restriction enzyme cuts the reporter plasmid and when repaired by HR, GFP is expressed [31]. Ninety-six hours after I-SceI transfection, cells were harvested, centrifuged at 300 g for 5 min at 4 °C, washed with cold 1× PBS and resuspended in cold 1× PBS. Flow cytometry and data analysis were performed by the University of Miami Sylvester Comprehensive Cancer Center Flow Cytometry Shared Resource (FCSR).
PARP1/2 inhibition experiments
Cells were seeded into 24-well plates, three wells per cell per treatment. After 24 h, cells were treated with 0, 0.25 or 0.5 nM talazoparib (APExBIO Technology, A4153) for 5 days. Untreated cells were used as control. Cell survival was measured with trypan blue viability assay described at TC20 automated cell counter manual (Bio-Rad). The viability of the cells was normalized to control untreated group. Each experiment was performed in triplicate and repeated three times.
For in vivo mouse experiments, MP41 cells expressing luciferase were harvested, washed with 1× PBS, counted, and resuspended in PBS at a concentration of 50,000 cells/µL in a sterile laminar flow hood. Cells were maintained on ice until injection. MP41 cells (100,000 cells in 2 µL) were injected into the choroidal space of the right eye in 22 NOD.Cg-Prkdcscid Il2rgtm1Wjl/SzJ (NSG) mice using a 33-gauge needle (Hamilton, 7803-05) and a 10 µL gastight microsyringe model 1701 (Hamilton, 7653-01) under a dissecting microscope (Olympus SZX-ST). Ketamine (75 mg/kg) and xylazine (15 mg/kg) were used for anesthesia. After 2 weeks, in vivo bioluminescence imaging was performed using the In Vivo Imaging System (IVIS) Spectrum (PerkinElmer, US). Mice were then divided with equal numbers of males and females into vehicle- and talazoparib-treatment groups. Talazoparib was dissolved in 10% n,n-dimethylacetamide (DMAc) (Sigma) in 6% solutol (ChemScene) in saline (Aspen) and administered intraperitoneally (IP) every other day at 0.7 mg/kg for 60 days starting 15 days after suprachoroidal injections. Vehicle consisting of the same solution lacking talazoparib was given on the same schedule. Four weeks after suprachoroidal injections, mice were anesthetized with ketamine/xylazine, and the right eyes were enucleated to prevent local discomfort from tumor growth in the eye. A toe-pinch was performed to confirm appropriate level of anesthesia, after which the eye and lid was cleaned using aseptic techniques. Two drops of proparacaine hydrochloride ophthalmic solution 0.5% (Bausch Lomb) were instilled in the right eye before surgery as a local anesthetic, and the left eye was lubricated (Optixcare) to prevent ulceration. Next, proptosis was gently induced in the right eye using an open forceps until the globe was anterior to the lids and the optic nerve was accessible. The optic nerve and surrounding blood vessels were clamped for 5 min with a hemostat for hemostasis, and the eye was detached using surgical scissors. Enucleated eyes were placed in 10% formalin. The right eyelids were sutured together, and erythromycin ophthalmic ointment (Bausch Lomb) was applied to prevent infection. Following the surgery, mice were given one subcutaneous injection of Meloxicam SR (2 mg/kg, ZooPharm) and did not require additional analgesia based on their behavior and activity level. All mice were monitored closely and recovered fully without complications. Five months after suprachoroidal injections, mice were euthanized and necropsies were performed. Liver, lungs, kidneys, and spleen were collected, placed in 10% formalin, and sent for histopathological analysis. All experimental animal protocols used in this study were approved by the Institutional Animal Care and Use Committee at University of Miami (protocol #15–197). All activities were performed in compliance with federal, state, and institutional regulations.
Micronuclei staining
Mel290 cells with inducible FLAG-tagged PRAME expression construct (TET-FLAG-PRAME) were grown on #1.5 coverslips, and half of replicates were treated with 1 μg/mL doxycycline for the indicated amounts of time. Cells were fixed in 4% paraformaldehyde in 1X PBS for 20 min and washed three times with 1X PBS (5 min/wash). Cells were permeabilized with 0.1% Triton X-100 in 1X PBS for 10 min and washed in 1X PBS. Coverslips were mounted using ProLong Diamond Antifade Mountant with DAPI, and cells were imaged using a Zeiss LSM 700 confocal microscope. At least 200 cells were counted for each condition and the experiments were repeated in triplicate.
Calculation of fraction genome altered
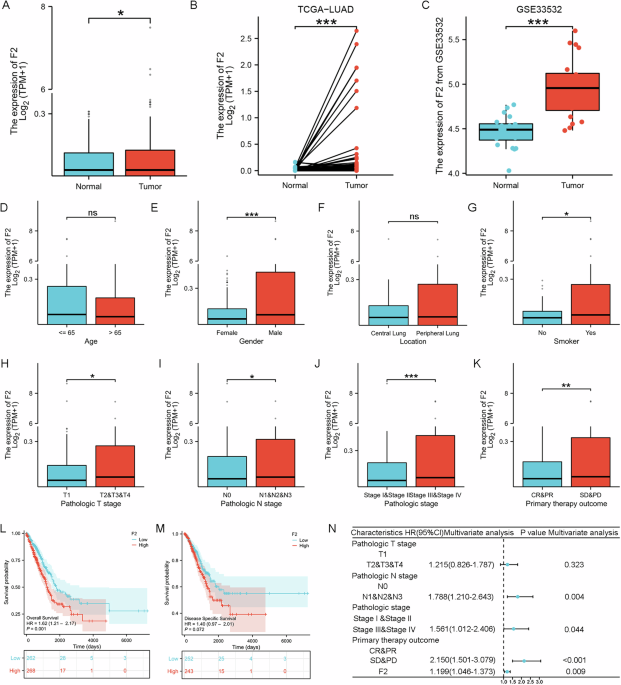
Bulk RNA sequencing expression and fraction genome altered data from the TCGA cohort was collected for each patient across 32 cancers via the Cancer Genomics Data Server R package (cgdsr Version 1.3). For each cancer, we fitted a LOESS model of PRAME expression and identified the inflection point before expression became aberrantly high, as previously described [2, 9]. This inflection point provided the PRAME expression threshold for “positive” PRAME “positive Once samples were labeled as PRAME “HIGH” or “LOW”, we conducted a one-way Wilcox test to identify significant association (p-value < 0.05) of PRAME “HIGH” samples with increased fraction genome altered (FGA).
Single-cell DNA sequencing
Single-cell DNA sequencing was performed using the Chromium platform (10X Genomics). Single-cell suspensions were counted using both the Cellometer K2 Fluorescent Viability Cell Counter and hemocytometer, and cell counts were adjusted to 1,000 cells/μl. Samples were run using the Chromium Single Cell DNA Library & Gel Bead Kit with a target capture of 500 cells. Samples were processed on Chromium Single Cell C and D Chips (10X Genomics) according to the manufacturer’s protocol and subsequently run on a thermocycler. Single-cell genomic DNA libraries were sequenced on the NextSeq 500 sequencer using 300-cycle high-output flow cells.
Single-cell CNV analysis
Raw BCL files for the DNA sequencing data were processed using Cellranger DNA (version 1.0.0). The “mkfastq” command was used to generate FASTQ files and the “cnv” command was used to generate CNV data aligned to the 10X Genomics GRCh37 build 87 genome (version 1.0.0). Results were visualized in the Loupe scDNA Browser (version 1.0.0).

Comments (0)