Clinical samples and database
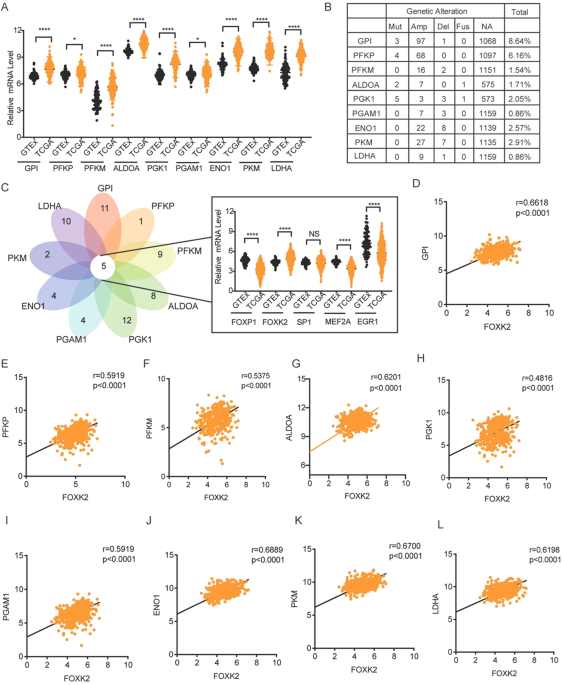
The human ovarian cancer and normal ovarian tissues used in this study were obtained from the Department of Obstetrics and Gynecology, Fengxian District Center Hospital and the Department of Obstetrics and Gynecology, The Affiliated Changzhou No. 2 People’s Hospital of Nanjing Medical University. None of the patients had received radiotherapy, chemotherapy, or other related antitumor therapies before surgery. All human tissues were obtained with informed consent, and the study was approved by the Research Ethics Committee of Fengxian District Center Hospital. We downloaded and analyzed the ovarian cancer cohorts in The Cancer Genome Atlas (TCGA, https://cancergenome.nih.gov/), GTEx (https://www.gtexportal.org/home/index.html) and the Gene Expression Omnibus (GEO, https://www.ncbi.nlm.nih.gov/geo/). The RNA-seq level 4 gene expression data contain log2-transformed RNA-seq by expectation maximization (RSEM) values summarized at the gene level. Genetic alteration data were downloaded from the cBio Cancer Genomics Portal (http://cbioportal.org/). Transcription factors of glycolytic genes were downloaded in JASPAR (https://jaspar.genereg.net).
Cell culture and reagents
The human ovarian cancer cell lines OVCAR8 (RRID:CVCL_1629), ES-2 (RRID:CVCL_3509),human embryonic kidney 293T (RRID:CVCL_0063) cells were all preserved in Shanghai Cancer Institute, Ren Ji Hospital, School of Medicine, Shanghai Jiao Tong University. OVCAR8 cells were cultured in RPMI 1640 containing 10% fetal bovine serum (FBS), 2 mM glutamine and 1% penicillin/streptomycin (P/S). ES-2 and HEK293 cells were cultured in Dulbecco’s modified Eagle’s medium containing 10% fetal bovine serum (FBS) and 1% P/S. All cells were incubated at 37 °C in a humidified atmosphere containing 5% CO2. All experiments were performed with mycoplasma-free cells.
All the cells we used were purchased from ATCC with STR certification. We conducted a cell quality inspection in 2019 and found that they were free of HIV, HBV, HCV, mycoplasma, bacterial, yeast, and fungal contamination.
Immunohistochemistry (IHC) staining
Immunohistochemical staining was performed as described. After treatment with diaminobenzidine and counterstaining with hematoxylin, all the sections were observed and photographed with a microscope (Axio Imager: Carl Zeiss). Scoring was conducted according to the ratio and intensity of positive-staining cells: 0–5% scored 0; 6–35% scored 1; 36–70% scored 2; more than 70% scored 3. The final scores were designated as low or high expression groups as follows: low expression: score 0–1; high expression: score 2–3. These scores were assigned independently and in a blinded manner by two senior pathologists. The primary antibodies used for FOXK2 detection are shown in Supplementary Table 2.
siRNA transfection
Cells were plated at 60–70% confluence in 60 mm dishes. OVCAR8 and ES-2 cells were transfected with si- FOXK2 or with a nontargeted siRNA as a control. The sequences of the siRNAs used were as follows: si-FOXK2-1, sense (5′-3′): GCGAGUUCGAGUAUCUGAUTT, antisense (5′-3′): AUCAGAUACUCGAACUCGCTT; si-FOXK2-2, sense (5′-3′): CGGUGACCAUAGUACAACATT, antisense (5′-3′): UGUUGUACUAUGGUCACCGTT. SiRNA oligos were produced by Gene Pharma (Shanghai, China). Transfection steps were performed according to the manufacturer’s protocols using Lipofectamine® RNAiMAX (Thermo Fisher Scientific, Waltham, MA, USA).
Plasmid transfection
The sequences of the short hairpin (sh)RNAs targeting FOXK2 were sh-1, 5′- GCGAGTTCGAGTATCTGATTT -3′ and sh-2, 5′- CGGTGACCATAGTACAACATT-3′. The shRNA-containing plasmids and a negative control plasmid were purchased from GenePharma (Shanghai, China). All these plasmids were packaged into virus particles using HEK 293T cells and the viral titers were determined. To establish stable FOXK2-knockdown cell lines, the target cells were infected with 1 × 10⁸ lentivirus-transducing units with 6 μg/mL polybrene (Sigma-Aldrich, St. Louis, MO, USA). The infected cells were then screened with 2.5 μg/mL puromycin after 72 h. The efficiency of the knockdown or overexpression was verified by western blotting. The plasmids containing FOXK2 (NM_004514.3, 4002) and PDK2(NM_002611.4, A3968) and a negative control plasmid were obtained from FulenGen Ltd., Co. (Guangzhou, China). The sequences of FOXK2-HA, FOXK2-Δ(54-128)-HA, FOXK2-Δ(129-171)-HA, FOXK2-Δ(300-371)-HA, and PDK2-Flag are shown in Supplementary Data.
RNA isolation and quantitative real-time PCR
Total cellular RNA was extracted using TRIzol reagent (Takara). A PrimeScript RT-PCR kit (Takara) was used to perform the RT according to the protocol. SYBR Premix Ex Taq (Takara) on a 7500 real-time PCR system (Applied Biosystems) was used to determine the mRNA expression at the following cycling settings: one initial cycle at 95 °C for 10 s followed by 40 cycles of 5 s at 95 °C and 31 s at 60 °C. Data were normalized to 18S RNA expression and represented as the average of three repeated experiments. Prime sequences used for FOXK2, GLUT1, HK2, GPI1, PFK1, ALDOA, GAPDH, PGK2, PGAM2, ENO1, PKM2, LDHA, PDK2 and 18 s detection are shown in Supplementary Table 1.
Western blotting
Total cellular protein was extracted using a total protein extraction buffer (Beyotime, China) according to the manufacturer’s instructions. Equal amounts of proteins were loaded onto 10% Tris-glycine sodium dodecyl sulfate‒polyacrylamide gel electrophoresis gels (Bio-Rad Laboratories, CA, USA). Then the separated proteins were transferred onto nitrocellulose membranes (Millipore, MA, USA). After blocking with 10% nonfat milk, the membranes were incubated with a primary antibody at 4 °C overnight. The membranes were further incubated with secondary antibody and protein signals were detected with the Odyssey imaging system (LI-COR Biosciences, Lincoln, NE). Primary antibodies against FOXK2, GLUT1, HK2, GPI1, PFKL, ALDOA, GAPDH, PGK1, PGAM1, ENO1, PKM2, LDHA, PDK2 and β-Actin used for detection are shown in Supplementary Table 2.
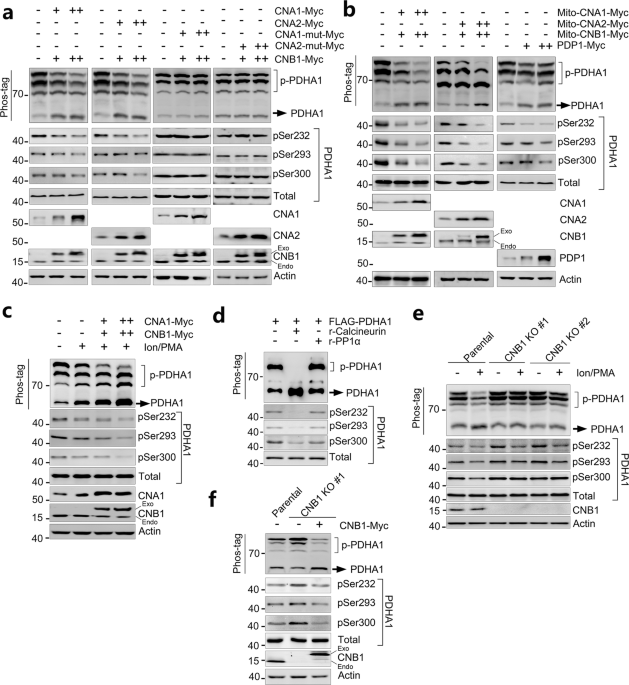
The phos-tag gels contained 20 μM Phos-tag (APExBIO, F4002) and 40 μM MnCl2. Before transferring onto nitrocellulose membrane, the phos-tag gel was immersed in transmembrane buffer containing 10 mM EDTA and washed to eliminate manganese ions.
Cell viability assay
The cells were plated in 96-well plates at a density of 3000 cells per well with 100 μl of complete culture medium and cultured for 2-5 days. Each group contained five wells. 10 μl Cell Counting Kit-8 (CCK-8, WST-8, Dojindo, Japan) solution was added to each well after 24 h, 48 h, 72 h and 96 h. CCK-8 was metabolized to produce a colorimetric dye that was read at 450 nm using a microplate reader.
Cell migration
In the migration assay, 2.5 × 10⁴ cells were seeded into the upper chamber of the Transwell plate (Millipore, USA). Cells were allowed to migrate for 24 h at 37 °C. The migrated cells were then fixed and stained with 0.1% crystal violet, six randomly selected fields were photographed, and the cell numbers were counted.
In vivo tumor xenograft model
Six-week-old female athymic nude (nu/nu) mice (SLAC, Shanghai, China) were randomly divided into four groups and injected subcutaneously in the right flank with the stable single cell clones of OVCAR8-sh and control cells at 5 × 10⁶ cells in 100 μl PBS medium for each nude mouse. We measured tumor volume once a week. After the mice were killed. The tumors were dissected and fixed with phosphate-buffered neutral formalin for standard histologic examination. The mice were manipulated and housed according to protocols approved by the East China Normal University Animal Care Commission.
Seahorse analyses
The assays for extracellular acidification rate (ECAR) and oxygen consumption rate (OCR) in the cultured cells were performed with the Seahorse XF96 Flux Analyzer (Seahorse Bioscience, Agilent) according to the manufacturer’s instructions. Briefly, OVCAR8 and ES-2 cells were seeded in an XF96-well plate at a density of 1 × 10⁴ per well with the indicated treatments. The medium was replaced with the assay medium 1 h before the assay. For the glycolytic stress test (Seahorse Cat. #103020-100), 10 mM glucose, 1 μM oligomycin and 50 mM 2-deoxyglucose (2-DG) were injected into the wells. For the mitochondrial stress test (Seahorse Cat. #103015-100), 1 μM oligomycin, 1 μM FCCP, 0.5 μM rotenone and 0.5 μM antimycin A were added to the wells. The above experiments were performed in triplicate and repeated twice.
Chromatin immunoprecipitation (ChIP) assay
ChIP assays were performed using a Pierce Agarose ChIP Kit (Thermo, 26156) according to the manufacturer’s instructions. Antibodies against FOXK2 (Abcam, ab5298, 4 μg per ChIP) were used for immunoprecipitation. Quantitative analysis of ChIP-derived DNA was performed by real-time qPCR analysis (primers in Supplementary Table S3). The assays were performed in triplicate.
Plasmid construction and dual-luciferase reporter assay
HK2, GPI, GAPDH, PGK1, PKM2, LDH and PDK2 promoter-luciferase reporter plasmids containing the promoter region were constructed in the pGL4.10/pGL3B plasmid. Wild-type and mutant promoter luciferase constructs were verified by DNA sequencing. A dual luciferase reporter assay (Promega, WI, USA) was performed according to the manufacturer’s instructions.
Co-immunoprecipitation (Co-IP) Assay
Cells were lysed in IP buffer (P0013, Beyotime) containing protease inhibitors (B14001, Selleck) and phosphatase inhibitors (B15001, Selleck). Protein A/G beads (Santa Cruz Biotechnology) were preincubated with antibody and IgG for 30–60 min on a spinning wheel. The bead-antibody complexes were then suspended with protein lysate. All Co-IP was performed overnight on a spinning wheel at 4 °C. The beads were washed 3 times with extraction buffer and were collected by centrifugation at 5000 rpm. The immunoprecipitants were subjected to western blotting.
Immunofluorescence (IF)
Ovarian cancer cells were planted in 8-well chambers (Ibidi, Germany) for IF. We fixed cells with 4% polyformaldehyde (30 min), permeabilized them with 0.1% Triton X-100 (10 min) and blocked with 10% BSA (1 h) at room temperature. All cells were incubated with the primary antibodies at room temperature for 2 h and then labeled with Alexa Fluor-488-conjugated Alexa (1:400, Rabbit, Sigma, USA) and Fluor-594-conjugated secondary antibodies (1:400, Mouse, Sigma, USA) at room temperature. DAPI was used to stain the nucleus for 5 min (Sigma, USA). Confocal microscopy (LSM 510, METALaser scanning microscope, Zeiss) was used to acquire the images. The primary antibodies used for FOXK2 and PDK2 detection are shown in Supplementary Table 2.
In vitro kinase assay
Immunoprecipitation (IP) of FOXK2 and PDK2 followed the same steps as the Co-IP assay to purify FOXK2 and PDK2 proteins. Equal aliquots of FOXK2 and PDK2 proteins were then subjected to kinase reactions. Kinase reactions were performed in kinase buffer (Cell Signaling Technology, #9802), for 30 min at 30 °C, with 200 µM ATP (Cell Signaling Technology, #9804). Then we used ADP-Glo™Kinase Assay (Promega, V6930) to measure kinase activity by quantifying the amount of ADP produced during a kinase reaction according to the manufacturer’s instructions. In addition, reactions were then stopped by the addition of 4X SDS‒PAGE buffer and loaded for separation on a 10% SDS‒PAGE gel.
Liquid chromatography tandem mass spectrometry (LC-MS/MS)
Sample Preparation: Gel pieces were cut from SDS PAGE, destained in 100 mM NH4HCO3 with 30% Acetonitrile and washed with Milli-Q water for10 min until the gels were destained. The spots were then lyophilized in a vacuum centrifuge. The in-gel proteins were reduced with dithiothreitol (10 mM DTT/100 mM NH4HCO3) for 30 min at 56 °C, then alkylated with iodoacetamide (200 mM IAA/100 mM NH4HCO3) in the dark at room temperature for 20 min. Gel pieces were briefly rinsed with 100 mM NH4HCO3 and I, respectively. Gel pieces were digested overnight in 12.5 ng/μl trypsin in 25 mM NH4HCO3. The peptides were extracted three times with 60% I/0.1% TFA. The extracts were pooled and dried completely by a vacuum centrifuge.
LC-MS/MS: The peptide of each sample was desalted on C18 Cartridges (Empore™ SPE Cartridges, Sigma), then concentrated by vacuum centrifugation and reconstituted in 10 µl of 0.1% (v/v) Formic acid. MS experiments were performed on a Q Exactive HF mass spectrometer that was coupled to Easy nLC (Thermo Scientific). Peptide was first loaded onto a trap column (100 μm*20 mm, 5 μm, C18) with 0.1% formic acid, then separated by an analytical column (75 μm*100 mm, 3 μm, C18)) with a binary gradient of buffer A (0.1% Formic acid) and buffer B (84% acetonitrile and 0.1% Formic acid) at a flow rate of 300 nL/min over 60 min. The gradient was set as following: 2–7% buffer B from 0 min to 3 min, 7–35% buffer B from 3 min to 48 min, 35–90% buffer B from 48 min to 53 min, 90% buffer B kept till to 60 min. After peptide segment separation, DDA (data dependent collection) mass spectrometry analysis was performed using a Q-Exactive Plus mass spectrometer (Thermo Scientific).MS data was acquired using a data-dependent top20 method dynamically choosing the most abundant precursor ions from the survey scan (300–1800 m/z) for HCD fragmentation.The full MS scans were acquired at a resolution of 70,000 at m/z 200, and 17,500 at m/z 200 for MS/MS scan. The maximum injection time was set to for 50 ms for MS and 50 ms for MS/MS. Normalized collision energy was 27 and the isolation window was set to 2.0 Th.
Database search: The MS data were analyzed using MaxQuant software version 1.6.1.0. MS data were searched against the UniProtKB Human database (173,343 total entries, downloaded 09/2019). The trypsin was selected as digestion enzyme. The maximal two missed cleavage sites and the mass tolerance of 4.5 ppm for precursor ions and 20 ppm for fragment ions were defined for database search. Carbamidomethylation of cysteines was defined as fixed modification, while Oxidation (M), Acetyl (Protein N-term) and Phospho (STY) were set as variable modifications for database searching. The database search results were filtered and exported with <1% false discovery rate (FDR) at peptide level and protein level, respectively.
Statistical analysis
Data are shown as means ± S.D. GraphPad Prism 10 was used to manipulate statistical analyses. Correlation of FOXK2 expression with categorical clinical variables in patients with OC was evaluated by χ2 test (SPSS 20.0 statistical software). After testing the homogeneity of variance, two-tailed Student’s t test was used to compare the results from different groups. Spearman rank correlation test was used to analyze the correlation between FOXK2 and glycolysis related genes. All experiments with cell lines were done in at least triplicates. P > 0.05 = NS, *P ≤ 0.05, **P ≤ 0.01, ***P ≤ 0.001, ****P ≤ 0.0001.

Comments (0)