
Remember me
Development and initial characterization of our CDK9 inhibitor, CDDD11-8 (Ki = 8 nM), was described in [30]. For in vitro assays, a 10 mM stock solution was prepared in 100% dimethyl sulfoxide (DMSO) and stored at −20 °C. Drug was diluted in cell culture media on day of treatment. For in vivo experiments, CDDD11-8 was freshly formulated in 0.1 M sodium acetate buffer (pH 4.5).
Cell linesThe MDA-MB-453 (HTB-131, RRID:CVCL_0418), MDA-MB-231 (HTB-26, RRID:CVCL_0062), MDA-MB-468 (HTB-132, RRID:CVCL_0419) and HEK 293 T/17 (CRL-11268G-1, RRID:CVCL_UE07) cell lines were obtained from the American Type Culture Collection (ATCC, USA) and the MFM-223 line (ACC-420, RRID:CVCL_1408) from the DSMZ-German Collection of Microorganisms and Cell Cultures (Germany, RRID:SCR_001711). All cell culture reagents were purchased from Sigma-Aldrich (USA). MDA-MB-453, MDA-MB-231, MDA-MB-468, and 293 T/17 cells were maintained in DMEM High Glucose medium supplemented with 10% (v/v) FBS and 2 mM L-Glutamine. MFM-223 cells were maintained in EMEM supplemented with 10% FBS, 2 mM L-Glutamine and 1x Insulin–Transferrin–Sodium Selenite Supplement. Cell lines were cultured at 37 °C in a humidified incubator containing 5% CO2, confirmed negative for mycoplasma contamination via testing with an IP-protected Mycoplasma spp. detection assay developed in house and authenticated by short tandem repeat profiling (CellBank Australia (RRID:SCR_013086)).
ImmunofluorescenceCells were seeded at 70–80% confluence onto sterilized 22 mm2 coverslips in a 6-well plate then fixed in 10% neutral buffered formalin (10 min). Fixed cells were washed in PBS, permeabilized with 0.05% Triton X-100 (1 h), then incubated overnight at 4 °C with a CDK9 antibody (Cell Signalling Technology Cat# 2316, RRID:AB_2291505, 1:100) delivered in 10% goat serum/PBS blocking buffer. Cells were subsequently incubated in the dark at RT (1 h) with an Alexa Fluor® 488 Goat anti-Rabbit IgG (Life Technologies Cat# A-11029, RRID:AB_2534088, 1:400) secondary antibody, then with an Alexa Fluor® 568 Phalloidin (Invitrogen, Cat# A-12380, 1:400) primary antibody (20 min), followed by a DAPI (Thermo Fisher Scientific Cat# D1306, RRID: RRID:AB_2629482, 1:1000) nuclear counterstain (1 min). After washing, coverslips were mounted onto glass slides using fluorescent mounting media (DAKO) and sealed with nail varnish. Images were captured using an Olympus IX73 inverted optical fluorescence microscope (RRID:SCR_020346), using a 100X objective with immersion oil. Nuclei (DAPI), CDK9 (AF488) and Phalloidin (F-actin; AF568) were visualized using Ultra-violet (UV), Intermediate blue (IB) and Intermediate green (IG) long-pass filters, respectively.
Plasmid construction and lentivirus productionThe pDRM18, pDRM98, pDRM166, pDRM209, pDRM210, pJS137, and pJS299 plasmids were constructed by Gibson assembly using standard procedures. All use the MND promoter [59] to express multiple transgenes from a single open reading frame containing picornaviral 2 A linkages. pDRM18 (“LTN”) expresses the firefly luciferase gene (luc), E2A, tdTomato fluorescent protein, P2A, and the neomycin resistance gene (aph). pDRM98 (“mKate”) expresses nuclear localisation sequence (NLS)-tagged mKate2 fluorescent protein, P2A, and the blasticidin resistance gene (BSD). pDRM166 (“LKB”) expresses luc, P2A, the NLS-tagged mKate2 fluorescent protein, P2A and BSD. pDRM209 (“LTP”) expresses luc, E2A, tdTomato, T2A, and the puromycin resistance gene (pac). pDRM210 (“LGP”) expresses luc, E2A, enhanced green fluorescent protein (EGFP), F2A and pac. pJS137 (“HCM”) expresses the hygromycin resistance gene (hph), P2A, the CCND1 open reading frame, T2A, and the MYC open reading frame with an N-terminal 3x hemagglutinin (HA) tag and a T58A activating mutation. pJS299 (“BBP”) expresses BSD, F2A, the BMI1 open reading frame, E2A, and the PIK3CA open reading frame with an N-terminal 3x Flag tag and a H1047R activating mutation. Further details are available at Addgene (#174720–174723 & #183502). Lentiviral particles were produced by transfection of 293 T/17 cells with vector plasmid and packaging plasmids (psPAX2, Addgene, #12260, RRID:Addgene_12260; pMD2-G, Addgene, #12259, RRID:Addgene_12259) using polyethylenimine or calcium phosphate transfection as described [60]. Conditioned medium containing viral particles was harvested and concentrated ~200-fold using Vivaspin20 columns (GE Healthcare), according to manufacturer’s instructions. All breast cancer models used in this study were infected with concentrated lentivirus at a multiplicity of 1–2 infectious units per cell. Transduced cells were selected using the relevant antibiotic, supplemented into culture media at standard concentrations and durations as appropriate.
Proliferation and apoptosis assaysCell lines were transduced with lentivirus as described above to stably express nuclear-localized mKate2, enabling live cell imaging. Cells were plated at a density of 4–5 \(\times\) 103 cells per well in 96-well tissue culture plates (CoStar), with a minimum of 5 replicate wells per experimental condition. Following a 24 h incubation period, the media was replaced with media containing IncuCyte® Caspase-3/7 Green Apoptosis Assay Reagent (final concentration 5 µM, Sartorius, #4440). Concurrently, cells were treated with either vehicle (DMSO) or CDDD11-8. Plates were imaged on the Sartorius IncuCyte S3 Live Cell Analysis System (RRID:SCR_023147) for 5 d, capturing images in the red and green channels using a 10\(\times\) objective. Resultant images were analysed to determine the number of live (red; mKate2) and dead (green; Caspase-3/7) cells using the associated IncuCyte S3 software. Image analysis was trained using six representative images from both low and high confluence, vehicle and CDDD11-8 treated cells. Three independent proliferation assays were conducted for each cell line to determine a robust half-maximal inhibitory concentration (IC50).
Cell cycle analysesCell lines were treated with vehicle or CDDD11-8. Following 3–5 d of treatment, cells were washed once and fixed in 70% ethanol at 4 °C overnight. Fixed cells were washed once with DPBS and stained for 30 min at RT with propidium iodide (PI) solution (50 μg/mL PI, 100 µg/mL RNase A, 0.1% Triton X-100). At least 1 × 10⁵ PI-stained cells were sorted using a FACS Canto II with BD CellQuest Pro software (BD Biosciences, RRID:SCR_014489) using standard procedures. Data was processed using FlowJo v10.6 (RRID:SCR_008520). Each graph was scaled to the mode, corresponding to cells in G1 phase. A minimum of two independent experiments were performed for each cell line, with three technical replicates per condition.
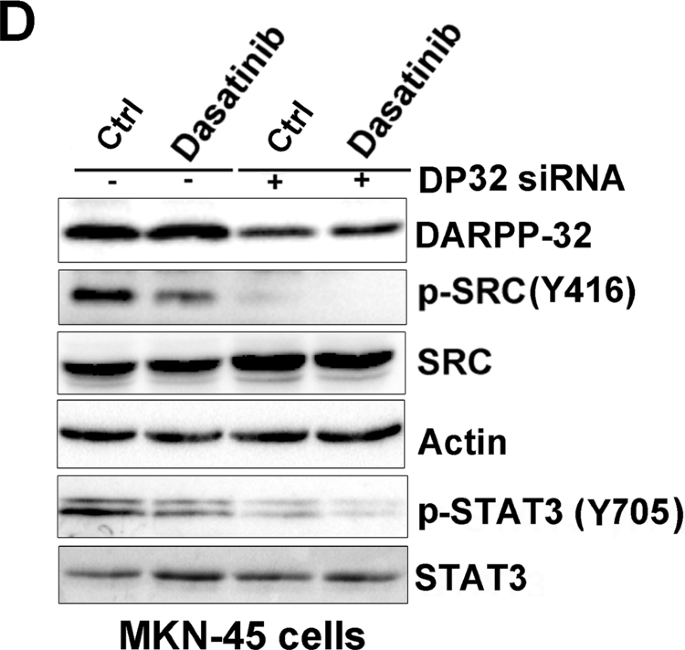
Western blottingCell lines were seeded in 6-well tissue culture plates (Corning) at ~70% confluency and allowed to attach for 48 h before treatment with vehicle or CDDD11-8 for 6 h. Cells were harvested in RIPA buffer (50 mM Tris-HCl pH 8.0, 150 mM NaCl, 0.5% sodium deoxycholate, 0.1% SDS, 0.1% Triton X-100) supplemented with 1x cOmplete Protease Inhibitor (Roche) and 1x HALT Phosphatase Inhibitor (Thermo Scientific). Protein concentration was quantified with a Pierce BCA protein assay (Thermo Scientific). Protein lysates (40 µg) were denatured in 1x loading dye (0.27 M Tris, 10.3% SDS, 6% β-mercaptoethanol, 35% glycerol, and 0.05% Bromophenol blue) at 95 °C for 5 min then loaded into 4–12% Bis-Tris gradient SDS-PAGE gels run with 1x MOPS buffer (BIO-RAD). Immunoblotting was performed using standard protocols and nitrocellulose membranes (GE) probed with the following primary antibodies: CDK9 antibody (Cell Signalling Technology Cat# 2316, RRID:AB_2291505, 1:1,000), RNA Pol II CTD repeat YSPTSPS (Abcam Cat# ab817, RRID:AB_306327, 1:1,000), RNA Pol II CTD repeat YSPTSPS phospho Ser2 (p-Pol II Ser2, Abcam Cat# ab193468, RRID:AB_2905557, 1:5000), c-MYC (Cell Signalling Technology Cat# 9402, RRID:AB_2151827, 1:1,000), MCL-1 (Cell Signalling Technology Cat# 5453, RRID:AB_10694494, 1:1000) and GAPDH (Millipore Cat# MAB374, RRID:AB_2107445, 1:2000). Detection of primary antibodies was performed using HRP-conjugated anti-mouse (DAKO Cat# P0161, RRID:AB_2687969, 1:1,000) or anti-rabbit (DAKO Cat# P0448, RRID:AB_2617138, 1:1,000) secondary antibodies as appropriate. Signals were visualized with Clarity Western ECL Substrate using a ChemiDoc MP imaging system (BIO-RAD, RRID:SCR_019037). Densitometry was performed on unsaturated images using ImageLab software (BIO-RAD) and normalized to GAPDH. Experiments were performed in triplicate and two independent experiments were performed for each cell line.
RNA isolation and quantitative RT-PCRCell lines were treated with vehicle or CDDD11-8 for 4 h prior to harvest and RNA isolated with TriReagent (Sigma-Aldrich) using manufacturer protocols. RNA was DNase treated using the Turbo DNA-Free Kit (Thermo Fisher Scientific) and quantified using a Nanodrop 1000 spectrophotometer (Thermo Fisher Scientific). Reverse transcription was performed on 1 µg RNA using the iScript Select cDNA Synthesis Kit (BIO-RAD). Quantitative real time RT-PCR was conducted with iQ SYBR Green Supermix (BIO-RAD) using the CFX384 Real-Time PCR Detection System (BIO-RAD). Gene expression was determined by the 2-ΔΔCt method and normalized to GAPDH expression. Each condition was represented in triplicate and two independent experiments were performed for each cell line.
Chromatin immunoprecipitation and associated bioinformatics analysesChromatin immunoprecipitation (ChIP)-seq experiments were performed as previously described [61]. In brief, MDA-MB-453 cells were seeded at ~75% confluency into 15 mm2 culture dishes and incubated for 3 days before treatment (4 h) with vehicle or CDDD11-8 (600 nM). Two biological replicate experiments were performed representing consecutive passages of cells. Each ChIP was performed with 10 µg RNA Polymerase II antibody (Santa Cruz Biotechnology Cat# sc-47701, RRID:AB_677353) and 100 µL Protein A Dynabeads (Invitrogen). Recovered DNA was amplified using the NEBNext Ultra II DNA Library Prep Kit (NEB) following manufacturer’s protocols. DNA libraries were sequenced on the Illumina NovaSeq 6000 Sequencing System (RRID:SCR_016387) to a minimum of 60 million 150 bp paired-end reads per sample. Reads were aligned to human assembly GRCh37 (hg19) using Bowtie 2 (RRID:SCR_016368) [62]. RNAPII peaks were called for each sample with MACS2 (RRID:SCR_013291) [63] using default settings, against a paired chromatin input. Peaks were annotated to UCSC.hg19.knownGene, and consensus peaks (representing peaks called in both replicates per condition) intersecting promoters (±300 bp of a transcription start site) were subject to differential enrichment analysis using DiffBind (RRID:SCR_012918) [64]. Differentially enriched promoters were defined using an FDR of < 0.05. In the case of multiple transcripts, peaks associated with the longest isoform were retained. Replicate Spearman correlation plots, read density plots, and heatmaps were generated with deepTools (RRID:SCR_016366) [65], using the public server at usegalaxy.org (RRID:SCR_006281) [66]. Genome coverage was visualized using Integrative Genomics Viewer (IGV, RRID:SCR_011793) [67]. Pausing index analyses were performed as described [68]. For each transcript, enrichment at the proximal promoter (defined over a window 50 bp upstream and 300 bp downstream of the TSS) was compared to enrichment over the entire gene body (defined as 300 bp downstream of the TSS to 3 kb past the TES). Genes <3 kb from each other, or those <1 kb in length were excluded from analysis. The pausing index was calculated as the log2 ratio between the read count per length of the proximal promoter over the read count per length of the gene body. A two-sided, paired Wilcoxon test was used to compare the RNAPII pausing index between Vehicle and CDDD11-8 treatment. Gene ontologies were performed with Goseq (RRID:SCR_017052) [69] and the HALLMARK gene set from the Molecular Signatures Database (RRID:SCR_016863) [70]. A hypergeometric distribution was used to analyse RNAPII promoter peaks gained with CDDD11-8 treatment against a background of all unchanged or decreased promoter peaks. Significance was determined using an FDR < 0.05. Homer de novo motif analysis (RRID:SCR_010881) was performed on differential peaks (CDDD11-8 vs DMSO).
Patient-derived breast organoid modelsAll experiments involving patient-derived organoids (PDOs) of breast tissue were conducted in accordance with national and international ethical guidelines on human and animal research. Tissue was collected from women undergoing breast surgery after providing informed, written consent (Approval #AC-2017–3070, MESR, France). The BCMP model is a genetically defined organoid model derived from normal human breast tissue obtained from a reduction mammoplasty surgery and engineered to overexpress four oncogenes (BMI1, CCND1, MYCT58A, and PIK3CAH1047R). Organoids of genetically unmodified breast epithelial cells were also generated from two independent reduction mammoplasty tissue samples. The MgA1 model was derived from a patient with a small TNBC tumour surrounded by pre-malignant microglandular adenosis. Tissue digestion and lentiviral transduction were performed as described [71]. Briefly, fresh surgical specimens were transferred to the laboratory in tissue culture medium, then macroscopically dissected and minced into <1 mm3 pieces. Tissue fragments were digested at 37 °C with 1 mg/mL collagenase type IV (Gibco) in organoid medium containing 10 µM Y-27632 Rho kinase inhibitor (Selleck) in a 6-well tissue culture plate, with occasional mixing by pipetting. Digestion was monitored using a phase contrast microscope (Olympus) and deemed complete when the tissue was reduced to small clusters of cells free of collagen fibrils. Cell-free DNA was then digested for <5 min with 100 µg/mL DNase I (Sigma), after which cell clusters were washed three times in Advanced DMEM/F-12 (Gibco) containing 10 µM Y-27632. For BCMP, the dissociated cell population was then enriched for mammary epithelial cells using the EasySep Human EpCAM Positive Selection Kit II (Stem Cell Technologies), following manufacturer’s protocols.
Lentiviral infections were performed in Ultra-Low Attachment plates (Corning) by overnight incubation at 37 °C and 5% CO2. After infection, cells were washed several times to remove residual lentivirus. BCMP was infected with the LGP (pDRM210) lentiviral vector for monitoring in vivo growth by luc bioluminescence, in vitro growth by GFP fluorescence, and to allow for selection of transduced cells with puromycin. BCMP was also infected with the HCM (pJS137) and BBP (pJS299) lentiviral vectors to allow stable overexpression of BMI1, CCND1, MYCT58A, and PIK3CAH1047R oncogenes, and to allow for selection of transduced cells with hygromycin and blasticidin. MgA1 was infected with the LTN (pDRM18) lentiviral vector for monitoring in vivo growth by measuring bioluminescence (luc), and monitoring of in vitro growth by measuring tdTomato fluorescence, and to allow for selection of transduced cells with hygromycin and neomycin. The MgA1 model was initially propagated inside the mammary ducts as a patient-derived xenograft (PDX) in NSG mice (Approval #4033, MESR, France) using methodology described below. A palpable tumour formed after 6 months in the first xenograft passage, and after 3 months in the second passage. The MgA1 organoid line was derived from the second in vivo xenograft passage by repeating the digestion process described above on the excised tumour.
Organoids of advanced breast cancer generated from established patient-derived xenografts (PDXs), designated PDxO, were obtained from the Huntsman Cancer Institute (HCI) Preclinical Research Resource core facility. Clinically, the HCI-010 model represents a pre-treated metastatic basal-like TNBC lesion, the HCI-012 model a pre-treated metastatic HER2-amplified lesion and the HCI-016 model a metastatic basal-like TNBC lesion of unknown treatment history as previously described [44]. PDxO models were infected with the LKB (pDRM166) lentiviral vector for monitoring in vivo growth by luc bioluminescence, in vitro growth by mKate2 fluorescence, and to allow for selection of transduced cells with blasticidin.
Patient-derived breast organoid culturePDOs and PDxOs were suspended in 100% Matrigel (Corning) and plated in tissue culture plates (Corning) in domes of up to 20 µL each. Domes were allowed to solidify by plate inversion for 30 min at 37 °C then overlaid with organoid medium and cultured at 37 °C and 5% CO2. The BCMP and normal breast epithelial cell organoid medium contains Advanced DMEM/F-12 (Gibco) supplemented with 0.1 mg/mL Primocin (Invivogen), 1x GlutaMax (Life Technologies), 10 mM HEPES (Life Technologies), 10% R-Spondin-1 conditioned medium (in house), 10% Noggin-conditioned medium (in house), 1.25 mM N-Acetyl-L-cysteine (Sigma), 10 mM Nicotinamide (Sigma), 0.5 μM A83-01 (R&D), 1x B27 (Life Technologies), 1 µM PGE2 (R&D), 0.5 μM SB202190 (Sigma), 5 nM Heregulinβ−1 (PeproTech), 5 ng/mL FGF7 (PeproTech), 20 ng/mL FGF10 (PeproTech), 10 ng/mL Amphiregulin (PeproTech), and 10 µM Y-27632 (Selleck). Medium for MgA1, HCI-010 and HCI-016 organoids contains Advanced DMEM/F-12 (Gibco) supplemented with 0.1 mg/mL Primocin (Invivogen), 1x GlutaMax (Life Technologies), 10 mM HEPES (Life Technologies), 5% FBS (Sigma), 10 ng/mL human EGF (Sigma), 1 µg/mL hydrocortisone (Sigma), and 10 µM Y-27632 (Selleck). HCI-012 organoid culture medium is identical that used for HCI-010 and HCI-016, with the addition of 10 nM Heregulin β1 (PeproTech). Organoid medium was replaced 2–3 x weekly, and PDOs or PDxOs were passaged when their growth began to plateau, as indicated by fluorescence intensity. BCMP, HCI-010, HCI-016 and HCI-012 models were passaged by culture media aspiration, followed by Matrigel digestion using TrypLE (Life Technologies) for 3–4 min. MgA1 was passaged by spiking 0.25 U/mL Dispase I (Sigma) into the culture media, pipetting the Matrigel vigorously, and incubating at 37 °C until organoids had been completely digested away from the Matrigel (~3 h). After TrypLE or Dispase treatment, organoids were centrifuged and washed in Advanced DMEM/F-12 + 10 µM Y-27632, ahead of resuspension and plating in an appropriate volume of cold Matrigel as described above. MgA1 was split using a ratio of 1:1–2, BCMP was split at a ratio of ~1:8, and PDxO models were split at a ratio of 1:5–6. PDO/PDxO growth rate was routinely monitored by manual fluorescent imaging with a 2X objective on an Olympus IX71 microscope, with the total fluorescent intensity quantified using Fiji (ImageJ). The BCMP and cancer-derived organoids were established and used within 15 serial passages whereas organoids of normal breast epithelial cells were established and used within 1–3 passages.
Organoid proliferation assaysOrganoids were plated in 2 µL Matrigel domes in 96-well tissue culture plates (Corning), with a minimum of 8 replicate wells per condition. After plating, organoids were cultured for a minimum of 24 h then treated with vehicle or CDDD11-8. Treatments were renewed every three days. BCMP and PDxO organoid growth was monitored using live cell imaging (Incucyte S3, Sartorius) at 4X magnification, capturing red (MgA1, HCI-010, HCI-012, HCI-016) or green (BCMP) fluorescence. The total fluorescent intensity was calculated as a fold change in fluorescent intensity relative to time 0 for each Matrigel dome. Since organoids of normal breast epithelial cells were not labelled with mKate, viability was assessed using a CellTiter-Glo 3D Cell Viability Assay (Promega, # G9681) on Day 0 and Day 10 of treatment and luminescence quantified using a Fluostar Omega microplate reader (BMG Labtech). A minimum of two independent experiments were performed for each organoid model to ensure data represents a consistent response.
Ex vivo culture of patient-derived explants of normal human breast tissuesNormal, non-malignant human breast tissues were collected following informed consent from women undergoing breast reduction surgery at the Flinders Medical Centre, Adelaide, South Australia (#H-2015-175). Tissues were cultured ex vivo as patient-derived explants (PDEs) as previously described [40, 72]. In brief, glandular tissue was macroscopically dissected into ~1 mm3 pieces and randomly placed onto gelatine dental sponges (Ethicon) pre-soaked in culture media into a 24-well tissue culture plate (Corning). Wells were then filled with 500 µL culture media containing phenol red-free RPMI-1640 media (Gibco) supplemented with 10% FBS, 10 µg/mL human recombinant insulin (Sigma), 10 µg/mL hydrocortisone (Sigma), and 1X anti-mycotic/anti-biotic (Sigma). PDEs were incubated on sponges at 37 °C with 5% CO2. After 24 h pre-culture, the medium was replaced with fresh culture medium supplemented with vehicle or CDDD11-8, followed by culture for a further 48 h. This time frame was sufficient to induce changes to the viability and proliferative capacity of breast epithelial cells within PDEs based on pilot studies of a non-selective CDK9 inhibitor (CDKI-73) with similar structure to CDDD11-8 (data not shown), consistent with an independent study showing uptake of a small molecule non-steroidal inhibitor into similarly cultured prostate PDEs after 6 h, with maximal effect at 48 h of treatment [73]. Four tissue pieces from each reduction mammoplasty case were randomly allocated to each treatment on a single sponge. Cultured PDEs were fixed in 10% neutral-buffered formalin at 4 °C overnight, and subsequently paraffin-embedded as per standard protocols.
Mammary intraductal (MIND) xenograftsAnimal experiments were approved by the University of Adelaide Animal Ethics Committee (#M-2018-088). Female NOD.Cg-Prkdcscid Il2rgtm1Wjl/SzJ (NSG) mice, aged 8–12 weeks old, were socially housed in individually ventilated cages, in temperature- and light cycle-controlled rooms located within the specific pathogen-free Adelaide Health and Medical Sciences Biomedical Research Facility. Mice were provided with ad libitum access to food, water, and nesting materials, and were monitored for general wellbeing at least once daily, according to a clinical record sheet.
The MDA-MB-453 cell line was infected with LTP (lentiviral vector pDRM209) and selected using puromicin, while the MDA-MB-468 cell line was infected with LKB (lentiviral vector pDRM166) and selected using blasticidin, to enable bioluminescent monitoring of in vivo xenograft growth. Transduced cell lines were confirmed as negative for residual lentivirus by p24 ELISA (Takara Bio) prior to in vivo use. MDA-MB-453 (2 × 10⁵) or MDA-MB-468 cells (2 ×10⁵) were resuspended in 10 µL media and injected into the fourth inguinal mammary ducts of NSG mice (n = 20) as described [37, 38]. For the MDA-MB-453 experiment, mice were injected unilaterally 5 d post-injection and allocated by simple randomization to receive either vehicle (0.1 M sodium acetate, pH 4.5; n = 10 mice) or CDDD11-8 (150 mg/kg/day; n = 10), delivered daily by oral gavage for 15 consecutive days. For the MDA-MD-468 experiment, mice were injected bilaterally and randomized for treatment 19 days post-injection, receiving vehicle (n = 5) or CDDD11-8 (200 mg/kg/day; n = 5) delivered daily by oral gavage for 15 consecutive days. Tumour growth was monitored using the IVIS Lumina X5 In Vivo Imaging System (Perkin Elmer, RRID:SCR_020397). IVIS imaging was conducted five days after injection to confirm the presence of tumour cells and every six days after treatment commencement. Bioluminescence (photons/sec) was quantified using a standardized region of interest size for each image. Following 15 d treatment, organs (spleen, liver, and xenografted mammary glands) were harvested, formalin fixed, and paraffin embedded (FFPE) as per standard protocols.
Histology and immunohistochemical stainingFFPE tissue blocks were sectioned on the RM2235 manual rotary microtome (Leica) at 4 µm. Sections were baked onto adhesive microscope slides (TRAJAN) for a minimum of 60 min at 60 °C before xylene de-paraffinisation and dehydration with 100% ethanol. Histology slides were stained with Lillie-Mayer’s haematoxylin (Australian Biostain), differentiated with 0.3% acid alcohol solution, and briefly counterstained in 1% alcoholic eosin/phloxine (Australian Biostain). For immunohistochemistry, slides were incubated in 0.9% hydrogen peroxide (Chem-Supply) to quench endogenous peroxidase activity and then subjected to heat‐induced epitope retrieval in 10 mM citrate buffer (pH 6.5) within a Decloaking Chamber (BioCare Medical). Slides were subsequently blocked for 10 min with Avidin/Biotin kit (Invitrogen) and then with 5% goat serum for 30 min, followed by incubation with a Ki-67 antibody (Agilent Cat# M7240, RRID:AB_2142367, 1:400) or a myeloperoxidase (MPO) antibody (Agilent Cat# A039829-2, RRID:AB_2335676, 1:1000) overnight at 4 °C inside a humidified chamber. Slides were then incubated with biotinylated secondary antibody (Goat Anti-Mouse Immunoglobulins/Biotin, Agilent Cat# E0433, RRID:AB_2687905, 1:400 for Ki-67; Goat Anti-Rabbit Immunoglobulins/Biotin, Thermo Fisher Scientific Cat# 31823, RRID:AB_228345, 1:500 for MPO), and subsequently with streptavidin-conjugated tertiary antibody (Streptavidin/HRP, Agilent, #P0397, 1:500), each for 1 h at RT. Stained slides were developed using 3‐3′‐diaminobenzidine chromogen (Sigma), and counter-stained with hematoxylin prior to mounting. Appropriate positive and negative controls were included in all assays. Slides were scanned using a NanoZoomer Digital Slide Scanner (Hamamatsu, RRID:SCR_022537). Ki67 staining was quantified on PDEs by manual counting of all fields containing epithelial cells (n = 500 – 3,000 counted cells per specimen). MPO staining was quantified using QuPath software (RRID:SCR_018257), in which positive cells were scored in entire tissue sections representing the spleens of mice from Vehicle (n = 5) and CDDD11-8 (n = 5) treated mice.
Statistical analysesCell line and organoid proliferation assays (and apoptosis assays, where relevant) were analysed using a two-way repeated measures ANOVA, followed by Dunnett’s multiple comparison test. IC50 values were determined for each independent proliferation assay using a four-parameter logistic function. IC50 values for each cell line, representing three independent experiments, were compared using an ordinary one-way ANOVA followed by Tukey’s multiple comparisons test. Cell cycle and RT-PCR data was analysed using an ordinary two-way ANOVA followed by Dunnett’s multiple comparisons test, comparing each CDDD11-8 dose to that of the vehicle. Organoid IC50 data was compared between models using a sum-of-squares F-test. Tumour xenograft growth data was analysed after log transformation using a two-way repeated measures ANOVA followed by Šídák’s multiple comparisons test, with nonlinear least squares regression model (curve fit) to determine the line of best fit for each treatment group. Endpoint (day 15) mouse bodyweight data was matched to treatment entry weight (day 0) for each mouse and compared between treatment groups using an unpaired, two-sided t-test with Welch’s correction. PDE data was analysed using a one-way repeated measures ANOVA followed by Dunnett’s multiple comparisons test. Unless specified, all data were analysed with Geisser-Greenhouse correction (no assumption of equal variance). All data are expressed as the mean ± S.E.M. A value of p < 0.05 was considered statistically significant unless otherwise stated.
Comments (0)