Patients
This prospective trial evaluated the performance of baseline and interim [18F]FDG-PET/MRI in patients with primary esophageal squamous cell carcinoma undergoing definitive therapy. Patients with a histological diagnosis of primary esophageal squamous cell carcinoma scheduled to receive definitive chemoradiotherapy or neoadjuvant chemoradiotherapy followed by surgery were eligible. We excluded pregnant or lactating patients, patients who had M1 disease, or those with contraindications of MRI. The enrolled patients received both [18F]FDG-PET/CT and [18F]FDG-PET/MRI before treatment (baseline) and after receiving 20 Gy of radiotherapy (interim). Baseline scans were completed within the initial two weeks before the commencement of treatment. Interim PET scans were conducted approximately two weeks after the initiation of treatment. This study was approved by the Institutional Review Board of Chang Gung Memorial Hospital and conducted in accordance with the Declaration of Helsinki. All patients provided written informed consent before participating and could withdraw from the study at any time. This trial was registered at Clinicaltrials.gov (identifier NCT05855291 and NCT05855278).
[18F]F-FDG-PET/MRI
[18F]FDG -PET/MRI was conducted following [18F]FDG-PET/CT on the same day. Before [18F]FDG-PET/CT imaging, the patients fasted for at least 6 h. The scan was performed with a Biograph mCT scanner. The emission images were acquired from the vertex to the mid-thigh region within 50 to 70 min following the administration of [18F]FDG (370 MBq). Each table position was scanned for 1.5 min. Following the completion of the PET/CT scan, the patient was transferred to the PET/MRI machine for the subsequent scan, with an average time lapse of 39 min between the two imaging sessions. Accordingly, the time interval for patients to undergo PET/MRI scanning was around 114 min after tracer administration. PET/MRI imaging was conducted using a Biograph mMR system manufactured by Siemens Healthcare in Erlangen, Germany. This scanner utilized A 3-T magnetic field strength and incorporated total imaging matrix coil technology, which allowed for comprehensive body coverage using multiple integrated radiofrequency surface coils. Additionally, the system featured a fully operational PET component with avalanche photodiode technology, which was integrated within a magnetic resonance gantry. The examination protocol involved a comprehensive scan of the entire body, with a specific focus on the thoracic region. To begin, a coronal fast-view T1-weighted MR localizer sequence was conducted to obtain scout images (Table 1). Subsequently, a whole-body PET scan was performed from the head to the upper thigh, covering 4-bed positions. Each bed position had an acquisition time of 4 min. Simultaneously, a whole-body T2-weighted MRI was conducted in the same 4-bed positions. This involved using a sagittal short tau inversion recovery (STIR) sequence and a transverse breath-holding half-Fourier single-shot turbo spin-echo (HASTE) sequence. In addition, whole-body diffusion-weighted imaging (DWI) was acquired with 2 b values (i.e., 50 and 1000 s/mm2) in transverse plane. Subsequently, regional PET and MRI were performed simultaneously. Regional PET was performed with an acquisition time of 10 min, whereas dedicated MRI of the thoracic/esophageal region (from the lower neck to upper abdomen) was performed with T2-weighted BLADE sequence with fat saturation in coronal and axial projections, T1-weighted volumetric interpolated breath-hold examination (VIBE) sequence in transverse plane, and corresponding axial DWI (b = 50, 1000 s/mm2). Following DWI, axial dynamic contrast-enhanced MRI (DCE-MRI) using a three-dimensional (3D) T1-weighted spoiled gradient-echo sequence was obtained by intravenously injecting a standard dose (0.1 mmol/kg body weight) of gadopentetate dimeglumine (Gd-DTPA; Magnevist; Bayer-Schering, Burgess Hill, UK) at a rate of 3 mL/s. The temporal resolution was 6.8 s, with a total acquisition time of 272 s (40 phases). After DCE-MRI, contrast-enhanced MRI using a T1-weighted VIBE sequence with fat saturation was conducted for a dedicated regional scan in axial, coronal, and sagittal projections and a final whole-body scan in transverse plane. The PET data were reconstructed using an ordinary Poisson ordered subset expectation maximization, with three iterations, 21 subsets, and a 4-mm Gaussian post-processing filter, into 344 × 344 matrices.
Table 1 MRI sequences parameters used for integrated PET/MRI
Since MRI scans can produce artifacts that affect imaging interpretation, reducing artifacts is crucial. For DCE-MRI, we optimized temporal resolution and used parallel imaging techniques to lessen scan time and motion artifacts. Saturation bands were placed outside the imaging area to minimize flow artifacts. In DWI, we utilized Echo Planar Imaging (EPI) correction methods to mitigate geometric distortions and employed proper shimming to correct for magnetic field inhomogeneities. Furthermore, we instruct patients on breath-holding and ensure their comfortable position to reduce patient-related artifacts, such as voluntary motion. We also suggest pain relievers for those experiencing CRT-related esophageal discomfort to minimize disruptions.
Treatment protocol
The disease staging and treatment protocols underwent a thorough review and validation process by the esophageal cancer committee at our institution. Patients were staged according to the 8th American Joint Committee on Cancer (AJCC) staging criteria. The patients received neoadjuvant CRT with surgery or definitive CRT depending on the treatment protocol of our hospital. If the clinical stage was T2N0M0 or above, patients were given the option of receiving neoadjuvant CRT followed by esophagectomy. Patients who were deemed unsuitable for surgery due to significant comorbidities, tumors in the cervical area, or personal refusal of surgery were administered definitive CRT. This study utilized two chemotherapy regimens, namely TC (paclitaxel and carboplatin) and PF (cisplatin and 5-fluorouracil). The TC regimen consisted of a weekly combination of carboplatin and paclitaxel. On the other hand, the PF regimen involved the administration of 5-fluorouracil for four consecutive days, along with cisplatin, repeated every three weeks. Concurrent radiotherapy was administered at a dosage range of 45–60 Gy for definitive CRT and 40–45 Gy for neoadjuvant CRT.
Post-therapy surveillance
The surveillance protocol consisted of regular follow-up visits at intervals of three months for the initial two years, followed by visits every six months during the third and fourth years, and subsequently every 6–12 months. Additionally, the patients underwent contrast-enhanced CT scans every six months for the first two years, and then annually thereafter. Endoscopy was performed if the patient had symptoms of dysphagia.
Image analysis
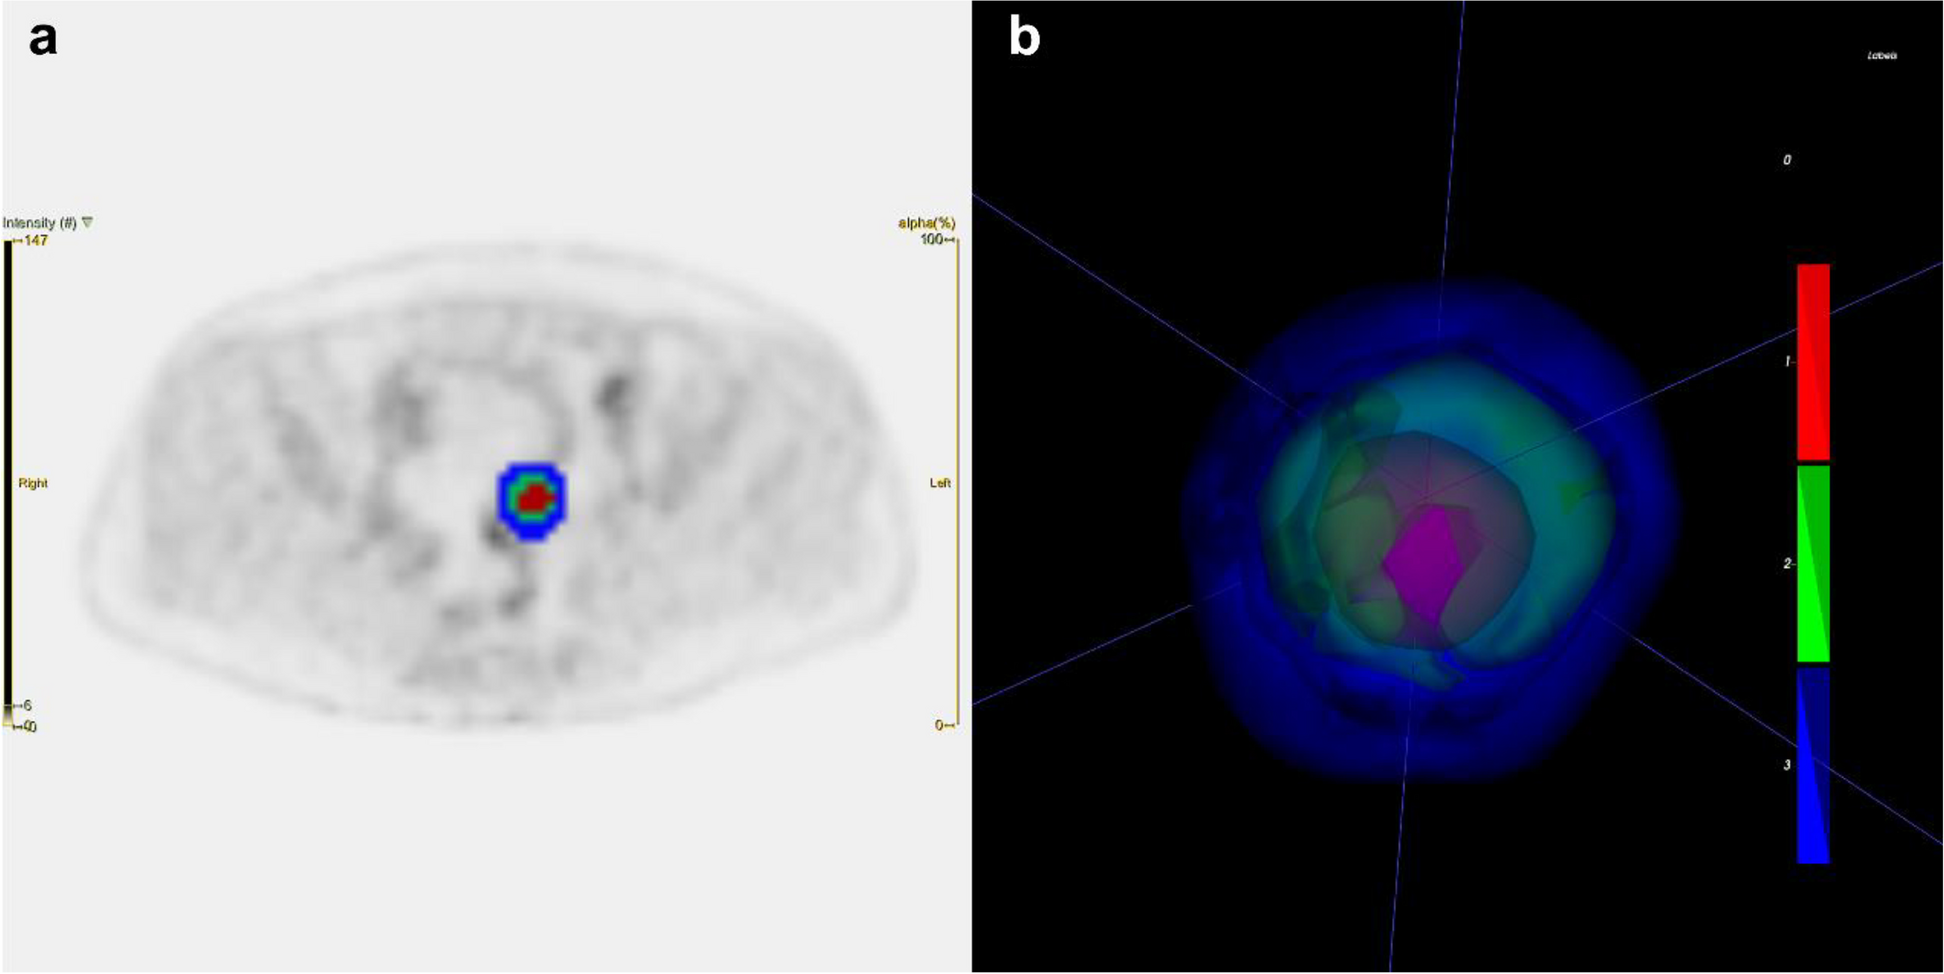
Tumor segmentation in the PET images was performed using the PMOD software package (PMOD Technologies Ltd., Zurich, Switzerland). First, boundaries were drawn by an experienced nuclear medicine physician (blinded to the clinical data), large enough to include the primary tumor in the axial, coronal, and sagittal [18 F]FDG-PET scans. The volumes of interest (VOIs) were carefully examined and confirmed by an experienced nuclear medicine physician. Subsequently, the boundaries of the tumors were determined using 40% of the maximum standardized uptake value (SUV) within the VOI [10]. Finally, the SUV and total lesion glycolysis (TLG) of the lesion were automatically calculated using the software.
All MRI datasets of each patient were meticulously evaluated by an experienced radiologist. With the aid of T2-weighted, T1-weighted post-contrast, and DWI, the relevant images depicting esophageal cancer within the T2-weighted and DCE thoracic/esophageal datasets were identified and selected. Using our in-house software written in MATLAB 7.0 (The Mathworks, Natick, MA, USA), the radiologist manually demarcated the region of interest (ROI) of the tumor within each selected T2-weighted and DCE image. Each ROI was drawn carefully to avoid areas with liquefaction, necrosis, or air-filled pockets to the best extent possible. Those clearly identified esophageal cancers despite artifacts were taken into ROI drawing; however, those poorly visualized cancers because of artifacts were excluded from ROI drawing.
These manually delineated ROIs were then automatically superimposed onto the corresponding apparent diffusion coefficient (ADC) and DCE-derived pharmacokinetic maps by our software. A tumoral histogram is subsequently generated from the ROI on each ADC and pharmacokinetic map. By integrating all individual histograms derived from the ADC and pharmacokinetic maps, our software yielded a comprehensive ADC histogram and various pharmacokinetic colormaps representing the entire esophageal cancer of each patient. The extended Kety model was used in a voxel-wise manner for pharmacokinetic analysis [11]. The arterial input function was extracted using a blind source separation algorithm [12]. The ROIs were manually drawn on the DCE-MRI by the same head and neck radiologist. The following pharmacokinetic parameters were calculated: volume transfer constant (Ktrans), rate constant (Kep), extravascular extracellular volume fraction (Ve), and initial area under the curve (iAUC).
In the course of chemoradiotherapy, changes in the biomarker SUV, TLG, Ktrans, Kep, Ve, or iAUC were calculated as: Δbiomarker = 100 x [biomarker value on the interim PET/MRI – biomarker value on the baseline PET/MRI] / biomarker value on the baseline PET/MRI.
Clinical response
The clinical response was assessed through an impartial evaluation of contrast-enhanced CT images obtained three months post-treatment, in comparison to the initial scans. Tumor response was determined on CT scans using the Response Evaluation Criteria in Solid Tumors (RECIST) version 1.1, with classifications including complete response (CR), progressive disease (PD), partial response (PR) or stable disease (SD) [13]. Patients who achieved PR, SD, or PD were classified in the non-complete response group.
Statistical analysis
In this study, the clinical response was used as the benchmark for evaluating treatment response. The efficacy of PET/MRI in predicting treatment outcomes was assessed through the computation of the area under the receiver operating characteristic (ROC) curve. To determine the statistical significance of the predictive power, the 95% confidence intervals (CI) for the area under the curve (AUC) and the significance level (P value) of the test were calculated using bootstrap techniques with 1,000 replicates. The Delong method was utilized to evaluate the statistical significance of the observed area under the curve (AUC) in comparison to a null hypothesis of 0.5. A one-sided P value was calculated to determine the significance of the observed AUC [14]. We examined a range of sequential cut-off points for each imaging biomarker. The threshold corresponding to the lowest p-value was selected as the optimal cut-off point for subsequent analyses. Progression-free survival (PFS) was determined by measuring the time from the date treatment initiates to the occurrence of disease progression or recurrence. Overall survival (OS) was determined by measuring the time from the date of diagnosis to either death from any cause or the last follow-up. The relationship between PET/MRI parameters and survival outcomes was visually represented using Kaplan-Meier product limit curves and evaluated using the log-rank test. Variables showing a p-value significance of < 0.05 following univariate analyses were considered for inclusion in the multivariate Cox regression model using a backward elimination approach. The prognostic model, derived from baseline and interim PET/MRI biomarkers, was established using independent risk factors. Internal validation of the models was carried out through the bootstrapping technique, involving the generation of 1000 bootstrap samples from the original dataset with replacement. The bootstrapping procedure was executed using the R programming language. All statistical analyses were conducted using MedCalc version 19.1.5 and SPSS software version 20. Statistical significance was operationally defined as a two-tailed P value that was found to be less than 0.05.


留言 (0)