
Remember me


This study complies with the principles of the Declaration of Helsinki and was approved by the Ethics Committee of the Affiliated Hospital of Qingdao University (Approval Number: QYFY WZLL 27218).
During January 2019 to December 2022, 466 patients with stage I LAC who received complete resection of the primary lung tumor and standard lymph node dissection at our hospital were retrospectively analyzed for data collection, including 161 males and 305 females (median age, 62 years; interquartile range, 55–67 years).
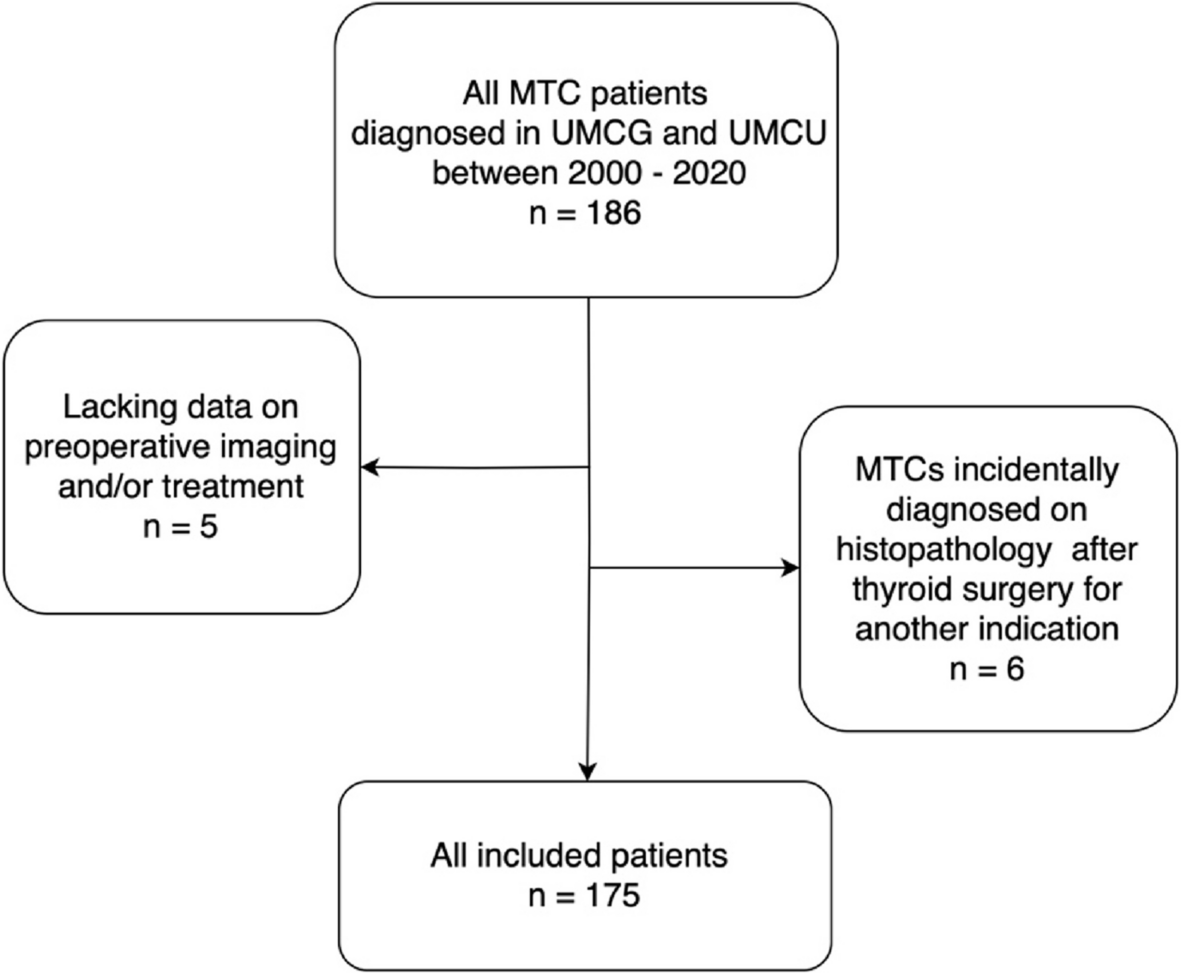
Inclusion criteria: The 2-[18F] FDG PET/CT was performed within 2 weeks preoperatively; the maximum diameter of lesions in CT images ≤4 cm; and the postoperative pathology confirmed the LAC without lymph node metastases and a clear STAS status. Patients received tumor-related treatment before operation (n = 4), patients with multiple lesions (n = 7), incomplete clinical data (n = 9), or previous history of other malignancies (n = 11) were excluded (Fig. 1).
Fig. 1
Flow chart of the inclusion and exclusion criteria. STAS, spread through air space
According to the postoperative pathological results, all patients were classified as either STAS-positive or STAS-negative. The patients were grouped into a training cohort (January 2019 to December 2020; 232 cases), a validation cohort (January 2021 to December 2021; 122 cases), and a test cohort (January 2022 to December 2022; 112 cases) based on the date of surgery.
Clinical data collectionClinical information was obtained through an electronic medical record system, including age, sex, localization, and serum levels of carcinoembryonic antigen (CEA) within 3 weeks prior to surgery.
Imaging method and image analysisThe 2-[18F] FDG radiotracer was prepared using a cyclotron (Sumitomo Heavy Industries, Ltd. Tokyo, Japan) automated synthesis module, with radiochemical purity > 95% and pH 4–8. Patients were injected with 5.5–6.6 MBq/kg (0.1 mCi/kg) of 2-[18F] FDG under the premise of fasting for at least 6 hours and plasma glucose of less than 11.1 mmol/L. One hour later, the bladder was emptied and then PET/CT images were collected. 2-[18F] FDG PET/CT was performed on a GE Discovery VCT PET/CT scanner, with the scanning range from the skull base to the mid-thigh level. A CT scan (scanning parameters: slice thickness 5 mm, tube current 110 mA, tube voltage 120 kV, frame rotation speed 0.7 r/s, bed speed 29.46 cm/s, matrix 512 × 512) was done first, followed by a PET scan (scanning parameters: matrix 128 × 128, 8–9 bed positions, 1.5–3.0 min/bed position). CT and PET images, which were reconstructed with decay correction and ordered subset expectation maximization (OSEM) algorithms were fused and reviewed on a Xeleris workstation. In addition, all patients involved underwent deep-inspiration breath-hold chest thin-slice CT scan (scanning parameters: layer thickness 1.25 mm, matrix 512 × 512); preset lung window (window width 1200 Hounsfield units (HU), window level − 700 HU).
The morphologic characteristics on CT and SUVmax of the lesions were independently analyzed by two Nuclear Medicine physicians who had more than 5 years of experience in the interpretation of PET/CT images. In cases where there is a disagreement between them, a physician with over 10 years of experience would join them, and they eventually came to a consensus through discussion. They were blinded to pathological details when reading the images. The lesion density was classified into three subtypes: pure ground-glass, part-solid, and solid. Other morphologic characteristics included CT long diameter, lobulation, spiculation, satellite, air bronchogram, vessel convergence, and bronchial truncation.
Adjudication of STAS statusHematoxylin-eosin (HE) sections and immunohistochemical sections of all histological samples of lung tissue were observed under a light microscope. When micropapillary clusters, solid nests, or single tumor cells are observed beyond the edge of the tumor into air spaces in the surrounding lung parenchyma, STAS is diagnosed after being checked correctly by two thoracic pathologists [3].
Statistical analysisIBM SPSS v26.0 and GraphPad Prism v9.5.1 were used for statistical processing and graphing. We express quantitative variables as mean ± standard deviation (−X ± SD) or median (quartile) [M (Q1, Q3)] and qualitative variables as frequencies (percentages). The categorical data were analyzed using χ2 test. Because all measurement data did not meet the normal distribution, Mann–Whitney U test was used for analysis. Independent predictors of STAS were selected by univariate and multivariate logistic regression analyses performed on the clinical data, CT features, and SUVmax in the training cohort. Subsequently, a prediction model was built using the independent predictors by logistic regression and validated through the three chronologically separated cohorts. Model performance was assessed using receiver operating characteristic (ROC) curves and calculations of area under the curves (AUC). The Hosmer-Lemeshow test was employed to measure the goodness-of-fit. All mentioned P-values were two-tailed and a Ρ < 0.05 was considered statistically significant.
Comments (0)