
Remember me


We retrospectively evaluated patients with PCNSLs or GBMs who underwent MRI examination between January 2019 and December 2022 at our institution. This retrospective study (approval no. 220126) was approved by our Institutional Review Board, and the need for written informed consent was waived because of the retrospective nature of this study.
Consecutive pathologically proven PCNSLs or GBMs based on the 2021 World Health Organization classification [20] were included in this study. All GBMs were diagnosed based on an integrated diagnosis, combining histology and a glioma-tailored next-generation sequencing panel developed by our institution [21]. The exclusion criteria were as follows: (a) lack of preoperative MRI, including DWI with both OGSE and PGSE sequences; (b) poor image quality; (c) masses smaller than 1 cm; (d) previous surgical resection or irradiation; or (e) lack of contrast-enhancing lesions.
In patients with multiple lesions, the largest mass was examined by MRI.
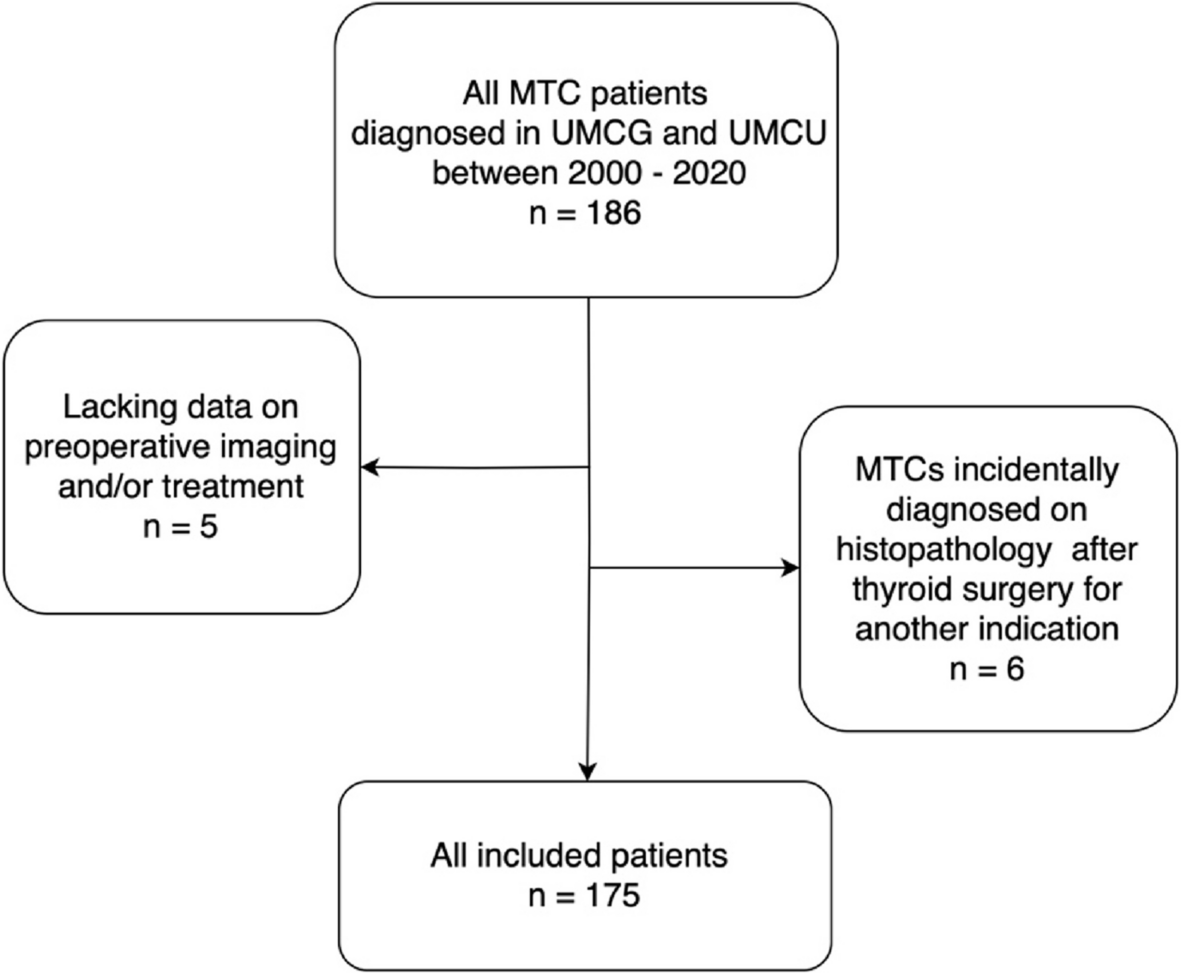
In this study, 158 consecutive patients (35 with PCNSLs and 123 with GBMs) were considered for inclusion. Seventy-one patients were excluded because of the absence of preoperative MRI, including both OGSE and PGSE DWI scans (11 with PCNSLs and 50 with GBMs), mass smaller than 1 cm (one with PCNSL), poor image quality caused by artifacts in the DWIs (three with GBMs), previous surgical resection or irradiation (two with GBMs), or the lack of contrast-enhancing lesions (two with PCNSLs and two with GBMs). We finally analyzed 21 patients with PCNSLs (15 men and six women; age range 40–87 years; mean age, 70 ± 13 years; 19 with primary diffuse large B-cell lymphoma of the central nervous system, and two with T-cell lymphomas) and 66 patients with isocitrate dehydrogenase-wildtype GMBs (36 men and 30 women; age range 15–92 years; mean age, 70 ± 13 years) (Fig. 1). All patients were diagnosed histopathologically after total or partial surgical resection. All patients were biopsy naive and had not received any treatment before MRI examination. No significant difference in the mean age (p = 0.71) or sex distribution (p = 0.21) was observed between patients with PCNSLs and those with GBMs.
Fig. 1
The diagram indicating the inclusion and exclusion criteria and the flow of the inclusion of eligible patients in this study
In a previous study, we compared glioblastoma and metastatic brain tumors using the time-dependent diffusion MRI [22]. Patients with glioblastoma analyzed in the present study include 65 patients with glioblastoma used in our previous study.
MRI acquisitionAll patients were examined on a 3 T MR scanner (MAGNETOM Prisma; Siemens Healthcare; maximum gradient amplitude = 80 mT/m, maximum slew rate = 200 T/m/s for each gradient axis with a 20-channel head radiofrequency receive coil). DWI was scanned with research sequences for the OGSE DWI using b-values of 0 and 1,500 s/mm2 (number of repeated scans: 1 and 4, respectively) and three diffusion encoding directions. OGSE diffusion encoding used trapezoid-sine waveforms [23]. An effective diffusion time (Δeff) of 7.1 ms (frequency = 50 Hz; diffusion gradient pulse duration [δ] = 8.5 ms) was used. PGSE DWI was also performed with b-values of 0 and 1,500 s/mm2 (number of repeated scans: 1 and 4, respectively) and three diffusion encoding directions. The Δeff for the PGSE encoding was 44.5 ms (diffusion gradient separation [Δ] = 59.8 ms; δ = 46.1 ms). The two sequences used the same parameters, as follows: repetition time (TR), 4,600 ms; echo time (TE), 120 ms; field of view (FOV), 230 × 230 mm2; matrix size, 72 × 72; and slice thickness, 5 mm. The acquisition times were 1 min and 13 s for PGSE DWI and 1 min and 19 s for OGSE DWI. Figure 2 shows the pulse sequence diagrams for PGSE and OGSE.
Fig. 2
Schematic representation of the diffusion gradient waveforms for pulsed gradient spin-echo (PGSE) (left) and oscillating gradient spin-echo (OGSE) (right). G = gradient vector; Δ, diffusion gradient separation; δ, diffusion gradient pulse duration; EPI, echo planar imaging; TE, echo time
Post-contrast 2D T1-weighted spin-echo images were obtained using the following parameters: TR, 410 ms; TE, 10 ms; number of excitations, 1; matrix, 304 × 304 (reconstructed to 512 × 512); number of slices, 24; slice thickness, 5 mm; interslice gap, 1 mm; FOV, 230 × 230 mm2; and scan time, 2 min and 46 s. These images were used as the anatomical reference in delineating the region of interests (ROIs). Our routine MRI for central nervous system lesions included the following pre-contrast sequences (Table 1): 2D T1-weighted spin-echo imaging, 2D T2-weighted turbo spin-echo imaging, 2D fluid-attenuated inversion recovery (FLAIR) imaging, and 3D susceptibility-weighted imaging. Pre-contrast T1-weighted images were used to confirm contrast enhancement.
Table 1 Imaging parameters of pre- and post-contrast conventional MRI sequencesGenerating diffusion parametric mapsADC values were calculated assuming the mono-exponential signal decay between lower and higher b-values.
According to previous studies [24, 25], we evaluated the ADC change (cADC) and the relative ADC change (rcADC) between OGSE (short diffusion time) and PGSE (long diffusion time). cADC and rcADC maps were generated via pixel-by-pixel calculation using the following formulas:
$$\begin\mathrm=}_}- }_}\\ \begin\mathrm=\frac}_}- }_}\right)}}_}}\times 100 \left(\%\right)\end\end$$
where ADC7.1 ms and ADC44.5 ms are the ADC values obtained using the OGSE and PGSE sequences, respectively.
ROI-based measurementAll images were analyzed using commercially available software (Vitrea; Canon Medical Systems Corporation). The ADC maps were co-registered with the post-contrast T1-weighted images using the rigid body registration. Two independent radiologists (T.H. and Y.K., with 8 and 4 years of radiological experience, respectively), who were blinded to the patients’ clinical and pathological data, performed the ROI analysis. The ROIs were drawn manually on a postcontrast T1-weighted image with the largest tumor diameter, including enhancing region and avoiding necrosis and fluid, and on the corresponding FLAIR image, including non-enhancing peritumoral regions with a FLAIR high signal intensity, and copied them on the corresponding ADC, cADC, and rcADC maps. The mean ADC44.5ms (ADC44.5msmean), ADC7.1ms (ADC7.1msmean), cADC (cADCmean), and rcADC (rcADCmean) were calculated for the entire ROI. Furthermore, the fifth and 95th percentile values of ADC44.5ms (ADC44.5ms5th and ADC44.5ms95th), ADC7.1ms (ADC7.1ms5th and ADC7.1ms95th), cADC (cADC5th and cADC95th), and rcADC (rcADC5th and rcADC95th) were calculated; this method was considered to represent the lowest and highest robust values [26]. The average ROIs size of the enhancing and the peritumoral regions were 587 ± 700 mm2 and 870 ± 668 mm2, respectively, for PCNSLs, and 651 ± 485 mm2 and 611 ± 605 mm2, respectively, for GBMs.
Statistical analysisThe D'Agostino–Pearson normality test was used to check the normality assumption for all parameters in all groups. The Mann–Whitney U test was used to compare the mean age between those with PCNSLs and those with GBMs, and the chi-square test was used to determine sex distribution. The intraclass correlation coefficient (ICC) was used to determine the interobserver agreement between the two observers on parametric measurements. Excellent agreement was defined as ICC > 0.74 [27]. The measurements from the two observers were averaged for each case and were used for further analysis. The ADC values were compared among the different diffusion times using the paired-t test or Wilcoxon signed-rank test. The mean and the 5th and 95th percentile values of ADC44.5 ms, ADC7.1 ms, cADC, and rcADC were compared between PCNSLs and GBMs using the unpaired-t test or Mann–Whitney U test. Receiver operating characteristic (ROC) analysis was performed to determine the optimum threshold for tumor differentiation and to calculate the area under the ROC curve (AUC), sensitivity, specificity, and accuracy for identifying GBM. The best-performing indices were decided for ADC44.5 ms, ADC7.1 ms, cADC, and rcADC. DeLong’s test was used to compare the AUCs of the best-performing indices. The Bonferroni correction was performed to correct multiple comparisons. A commercially available software package (MedCalc, version 15.10.0; MedCalc statistical software) was used for statistical analysis. Differences with p-values of < 0.05 were considered statistically significant.
Comments (0)