
Remember me


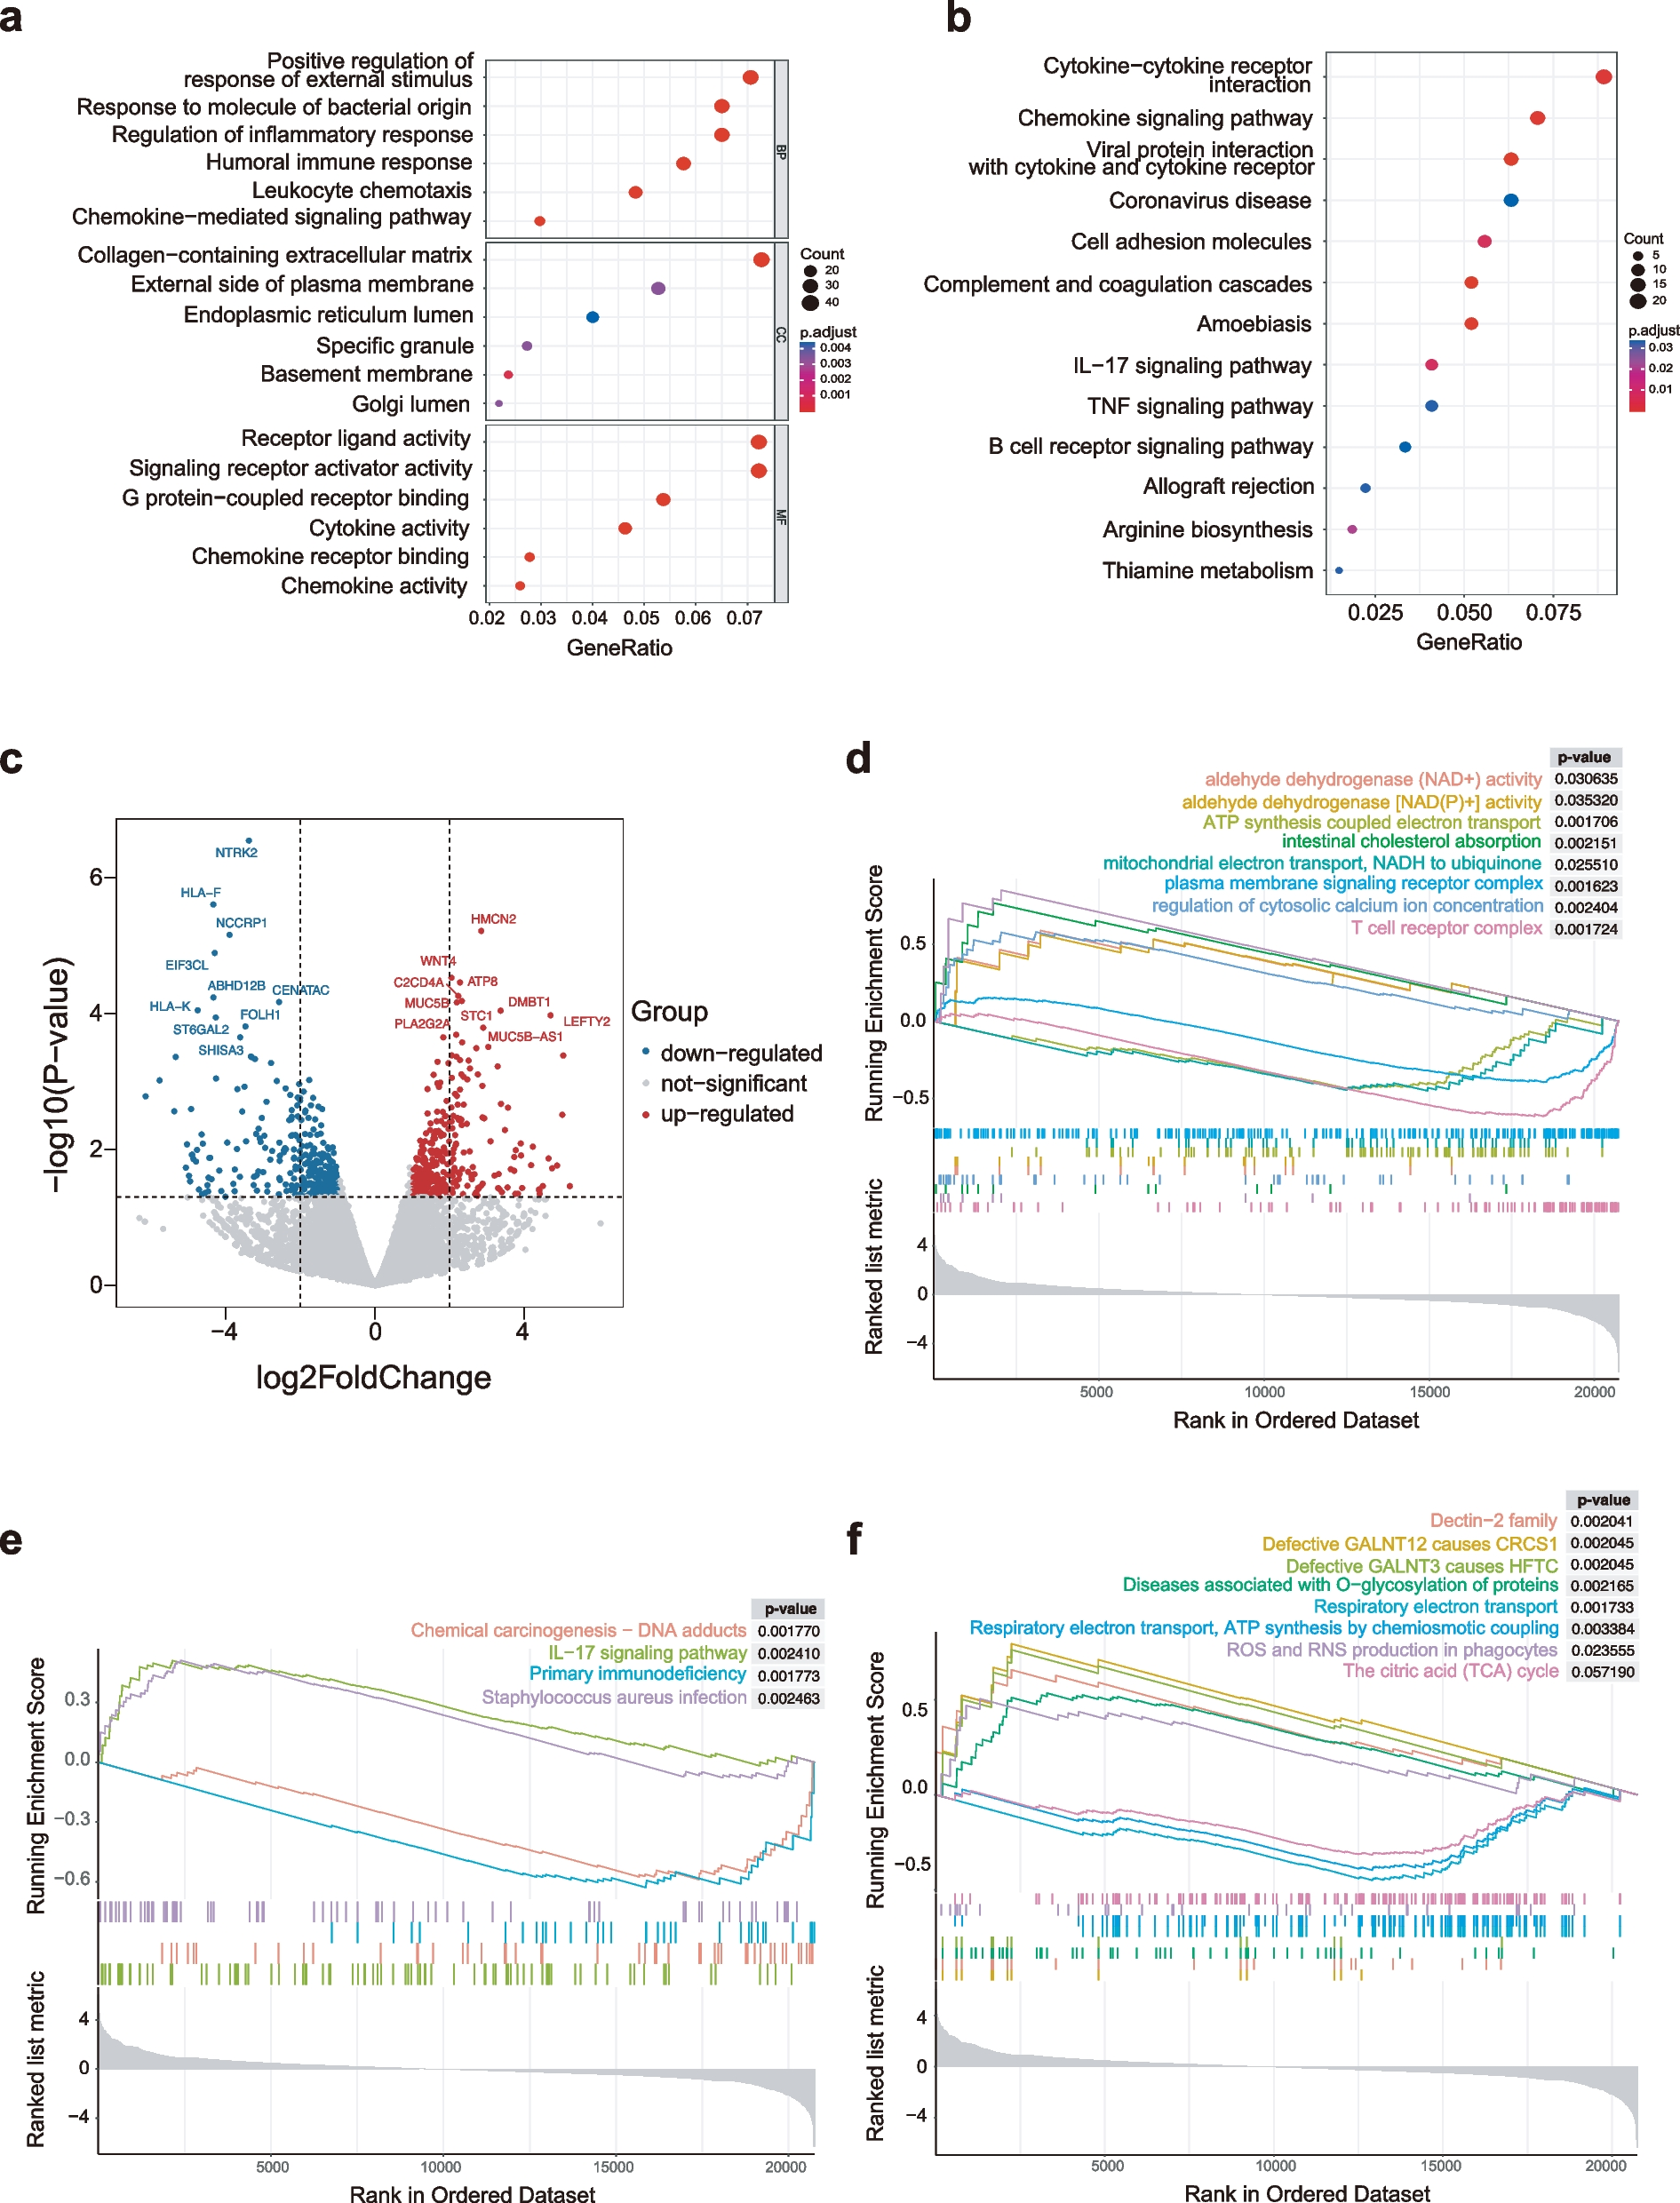

Figure 2 depicts the workflow of the data analysis. The process is divided into data retrieval, normalization, statistical testing for DEGs, gene enrichment analysis and single cell RNAseq. Meanwhile, we divided the mouse and human lung genomic data into a test and validation set and performed independent computational analysis.
Fig. 2
CONSORT flow diagram of genomic data analysis for the mouse and human pulmonary genomes. We structured the process into data retrieval, normalization, linear regression and other statistical testing to obtain significant DEGs (DeSeq, LIMMA), gene ontology and gene enrichment analysis and validation of results by single cell RNAseq
Mouse genomic data setsWe considered 89 individual mouse genomic data sets for in-depth evaluation (GEO database GSE83594, GSE66721, GSE55162, GSE34378, GSE38754, GSE23016, GSE25640, GSE18341, GSE15999, GSE14525, GSE11662, GSE10246, GSE9954, GSE6591, GSE3100) and show the distribution of genomic data according to sex and age in supplementary Figure S1 and supplementary Table S1.
Based on N = 43 individual male and N = 46 female mice genomic data sets (supplementary Table S1), we searched for time dependent gene expression changes. The linear regression model fitted 105 significantly regulated genes. Note, we only considered DEGs which fulfilled the criteria: FDR adjusted p-value of 0.05 and a goodness of fit of R2 > 0.4. We also considered sex differences, and this revealed 690 (305 up, 385 down) and 170 (144 up, 26 down) genes specifically regulated among male and female mice. Note, 68 genes are common to both sex. We performed gene enrichment analysis, and for males enriched terms are hemostasis, positive regulation of cell adhesion, positive regulation of cell migration, regulation of MAPK cascades, platelet activation, ECM organization, chemotaxis, blood vessel development, adaptive immune system. Likewise, for females enriched terms are inflammatory response, leukocyte chemotaxis, cell activation, nerutrophil degranulation, regulation of ERK1 and ERK2 cascade. Although we observed sex dependent gene expression changes with age, the gene ontology enriched terms are similar and alert to inflammation, immune response, ECM remodeling, cell adhesion among others. The Metascape enriched terms specifically for up- and down-regulated genes are shown supplementary Figure S2.
We also evaluated time dependent gene expression changes by excluding animals aged < 5 weeks. Independent of sex, the regression model fitted 90 DEGs whose expression changed with time. Moreover, we compared DEGs resulting from the two regression models, i.e. with and without animals aged 1–5 weeks and found 76% to be in common. Therefore, from the very beginning of life, 80 pulmonary genes (68 up, 12 repressed genes) are continuously regulated with age, and we show examples of significantly regulated genes (p < 0.05, R2 > 0.4) in supplementary Figure S3.
Additionally, we analysed the genomic data with the LIMMA package (= Linear Models for Microarray Data) and compared animals aged 1–5 weeks (N = 15), with animals aged 6–26 (N = 52) and 52–130 (N = 22) weeks. This revealed 120 and 134 genes, respectively as continuously up- and down-regulated with age. Furthermore, 38 genes are common when the results from the linear regression model and LIMMA were compared.
Human lung genomic test set dataWe retrieved RNA-Seq data of 107 histologically proven normal lung tissue samples from the TCGA repository, i.e. resection material from lung cancer patients (supplementary Table S2). The cohort consisted of individuals aged 42–86 years and based on normalized counts, the linear regression model fitted 237 significantly regulated genes (27 up and 210 down). We also analysed the RNAseq data with the DESeq2 package and compared individuals aged 42–50 (N = 5) to 71–86 (N = 40) years. This defined 1430 genes (716 up, 714 down) with a FC ≥ 1,5 and an FDR adjusted p-value < 0.05. Note, 56% of genes coming from the linear regression model overlap with significantly regulated genes as defined by the DESeq2 method (supplementary Figure S4).
Human lung genomic validation data setWe retrieved genomic data sets of histologically normal lung tissue from 23 human sudden death donors (GSE1643) in addition to 284 individuals who underwent lobectomy for lung adenocarcinoma (GSE71181). We only considered genomic data of histologically proven normal lung parenchyma. Together, the validation set consisted of 307 individual genomic data sets (supplementary Table S2). Based on linear regression analysis the model fitted 857 up- and 816 down-regulated genes.
Moreover, we used LIMMA to identify significantly regulated genes and compared two age groups, i.e. 21–50 years (N = 27) and 71–85 years (N = 89). We applied the criteria FC ≥ 1,5 and an FDR adjusted p-value < 0.05 and this defined 20 and 4 genes, respectively as significantly up- and down-regulated. Furthermore, all genes identified by LIMMA are significant in the linear regression model.
Lastly, we compared the human test and validation set, and based on the regression model findings 26 genes are commonly regulated.
Gene ontology and gene set enrichment analysis (GSEA)We used two different approaches to group DEGs based on gene cluster analysis and gene ontology terms. Depicted in Fig. 3A and B are the Z-scores for all 89 data sets and for 74 mice aged 6–26 and 52–130 weeks. We show significantly regulated genes obtained by the linear regression model and discuss their relevance for aging below. Similar, Fig. 3C and 3D are heatmaps for a subset of human test (N = 17) and validation sets (N = 51). With mice and the human test set, the data are mostly separated by age while for the human validation set some adult lung samples are intermingled with the aged ones.
Fig. 3
Heatmaps of age-related gene expression changes in the mouse and human lung. A Examples of significantly regulated genes from the linear regression model. The data are based on 89 individual mouse samples and the dendrogram separates the different age groups. B Examples of significantly regulated genes from the linear regression model. The data are based on 74 mice aged 6–26 and 52–130 weeks, and the dendrogram separates the different age groups. C Examples for significantly regulated genes from the linear regression model for the human test set. Note, we selected 17 individuals based on the maximum difference in age, i.e. < 50 years and > 80 years. D Examples for significantly regulated genes from the linear regression model for the human validation set. Note, we selected 51 individuals based on the maximum difference in age, i.e. < 50 years and > 80 years
Depicted in Fig. 4A&4B are enriched GO terms for mice aged 6–130 weeks. We separated up- and down-regulated genes and analyzed the data with Metascape, David and g:Profiler. We only considered enriched terms with a FDR adjusted p-value < 0.05. Based on 579 age increased gene expression changes as determined by the regression model (p < 0.05, R2 > 0.2), we identified 26 overlapped terms between the Metascape, David and g:Profiler (Fig. 4A). 579 upregulated genes mapped to the terms cell activation, inflammatory response, regulation of cytokine production, endocytosis, calcium-mediated signaling, positive regulation of angiogenesis, lipopolysaccharide-mediated signaling pathway (Fig. 4A). Similar, we mapped 223 repressed genes (Fig. 4B) to GO terms, and although less than 10% overlapped (supplementary Figure S5) most terms were similar. Among the common GO terms, we wish to highlight ECM organization, cell adhesion, blood vessel development, collagen fibril organization, transmembrane receptor protein tyrosine kinase signaling pathway and transforming growth factor beta receptor signaling pathway. Moreover, we considered GO terms overlapped by two different annotation tools, and given the focus of our study, i.e. genes regulated in the aging lung, we selected top GO terms linked to lung biology (Fig. 4B). About 102 and 140 down-regulated genes, respectively overlapped between Metascape and g:Profiler and David and g:Profiler and significantly enriched terms are regulation of cellular response to growth factor stimulus, regulation of cell-substrate adhesion, vasculature development, positive regulation of integrin/mediated signaling pathway, cell-substrate adhesion, cell junction organization, regulation of signal transduction and cell migration.
Fig. 4
Enrichment analysis of age-related gene expression changes. Based on the linear regression model we identified significantly regulated genes in the aging lung of mice and humans. A Shown are significantly enriched GO terms for upregulated genes of N = 74 individual mice aged 6–130 weeks. B Shown are significantly enriched GO terms for down-regulated genes of N = 74 individual mice. C Shown are significantly enriched GO terms for upregulated genes of N = 307 individual human donors aged 21 – 85 years. D Shown are significantly enriched GO terms for down-regulated genes of N = 307 individual human donors aged 21 – 85 years. Abbreviations: SP (signaling pathway), GF (growth factor), R.(receptor), res. (response), act.(activation), con. (concentration), pos. (positive), reg. (regulation), sig. (signaling), imm. (immune), org. (organization), net. (network)
Additionally, we performed gene enrichment analysis for the human validation set of N = 307 individuals. The linear regression model fitted 857 up and 816 down-regulated genes. Significantly enriched GO terms for age-dependent increased gene expression changes include extracellular matrix organization, positive regulation of cell motility and cell migration, leukocyte migration, inflammatory response, elastic fiber assembly, collagen fibril organization and positive regulation of apoptotic response (Fig. 4C). Likewise, for repressed genes and based on DAVID annotations, enriched terms are tight junction assembly, cellular response to reactive oxygen species, PPAR signaling pathway and lipid transport (Fig. 4D).
Mouse gene set enrichment analysisApart from GO terms, we performed gene set enrichment analysis (GSEA) for 89 mouse lung genomic data sets. The basic algorithm is described in [31] and based on the Kolmogorov–Smirnov test, which assesses the distribution of gene markers by comparing their position and distribution (rank order) in individual lung samples from young and aged animals. We report the normalized enrichment score (NES), p-value and adjusted p-value in supplementary Table S3, and according to NES, cell cycle, cell adhesion, collagen-fibril organization, extracellular matrix structural constituent and morphogenesis of epithelium are enriched in animals aged 1–5 (N = 15) as compared to 6–26 (N = 52) weeks. We likewise compared animals aged 6–26 (N = 52) vs 52–130 (N = 22) weeks, and the GSEA defined blood vessel development, basal lamina, integrin binding, cellular response to vascular endothelial growth factor stimulus, positive regulation of autophagy as significantly enriched. Conversely, fatty acid transport, platelet activation, scavenger receptor activity, extracellular space, B-cell activation and antigen processing and antigen processing and presentation of exogenous peptide antigen via MHC class II were enriched terms for aged animals.
Time resolved gene expression changes in the aged lung of miceWe searched for continuous gene expression changes and based on a linear regression model for 74 individual pulmonary genomic data sets (ages 6 – 130 weeks) we identified 77 up- and 13 down-regulated genes whose expression changed with age (Fig. 5A1 and 5D1 and supplementary Table S4). The results for all 89 individual mouse genomic data sets (ages 1–130 weeks) are summarized in supplementary Figure S6. The boxplots shown in Fig. 5A2 depict significantly increased gene expression changes, and the genes are grouped based on their functions. For instance, we observed 6 genes coding for adaptive immune response among 74 individual animals whose expression continuously increased with time (Fig. 5A2). Therefore, the boxplot comprises a total of 444 individual gene expression changes (= 74 animals × 6 genes). Strikingly, 49% of the continuously upregulated genes code for immune response, and apart from adaptive immune and inflammatory responses, we observed an age-related increased expression of genes coding for cellular response to chemokine and immunoglobulin production. Furthermore, the ontology terms highlighted leukocyte cell activation and regulation of cell adhesion, and shown in Fig. 5B are individual gene expression changes. To independently confirm the results, we interrogated single cell RNAseq data, and the results are summarized in Fig. 5C. Here we compared 12 week old animals with aged mice (= 96 weeks) and assessed the expression pattern of 37 immune response genes (Fig. 5C) in alveolar and interstitial macrophages, interstitial fibroblast, dendritic cells, CD4+ and CD8+ T-cells, B-cells as well as AT2, ciliated, club, goblet and NK cells. We confirmed an age-related induced expression of 27 genes and therefore validated 73% of immune response genes in RNAseq data of single cells isolated from lung tissue of mice. Note, the single cell RNAseq data comprises an average of 500–1000 cells (see GSE124872). The genomic data signify upregulation of gene markers linked to alveolar and interstitial macrophages, B-, CD4+ and CD8+ T cells. Indeed, a recent review highlighted the importance of age-related changes in the pulmonary adaptive and innate immune system [32].
Fig. 5
Continuous gene expression changes of the aging mouse lung. Based on the linear regression model for N = 74 individual mouse genomic data sets (mice aged 6–130 weeks), we identified 77 and 13 genes, respectively whose expression increased or declined with age (p < 0.05, R2 > 0.4). We independently confirmed their regulation by evaluating single cell RNAseq data of alveolar and interstitial macrophages, interstitial fibroblast, dendritic cells, CD4+ and CD8+ T-cells, B-cells as well as AT2, ciliated, club, goblet and NK cells. The full genes names are given in supplementary Table S4. Panel A1: Boxplot of 77 DEGs with increased expression over time. Panel A2: Boxplots of 37 uniquely upregulated genes coding for immune response. B Shown are individual immune gene regulation with age. The genes refer to the data shown in the boxplots of A2 for the various ontology terms. C Findings from RNAseq to independently validate the regulation of immune genes in resident cells of the lung. Panel D1: Boxplots of down-regulated genes. Panel D2: Boxplot for significantly down-regulated DEGs based on enriched gene ontology terms. E Regulation of 13 uniquely down-regulated genes with age. The genes refer to the data shown in the boxplots of D2 for the various ontology terms. Statistical testing is based on the “Kruskal–Wallis” test. *p < 0.05
Based on the David tool, 83% of the significantly upregulated genes can be grouped according to gene ontology terms. An additional 4% of upregulated genes were assigned to ontology terms defined by Metascape and the g:profiler, and the associated DEGs code for protein binding, immune response and extracellular space. For the remaining genes the software tools did not provide meaningful terms even though some important genes are worthy to mention. For instance, we observed significant regulation of alpha-N-acetyl-neuraminide alpha-2,8-sialyltransferase 6 (St8sia6), i.e. an enzyme that catalyzes the transfer of sialic acid to carbohydrates to influence cell–cell communication and adhesion. Its expression increased 1.8- and 3.3-fold in animals aged 6–26 and 52–130 weeks, respectively when compared to 1–5 week old animals. Another gene of interest is the membrane-spanning 4-domains, subfamily A, member 6B (Ms4a6b) which is expressed by regulatory T cells and functions as a co-stimulatory molecule to amplify antigen signals thereby modulating T-cell function [33, 34]. Indeed, this CD20 like precursor is induced (> 3-fold) when week 6–26 aged mice are compared to 1–5 week old animals. Its expression increased further when compared to aged animals. Another example refers to ecotropic viral integration site 2A, i.e. a leucine-zipper transmembrane protein [35] and protoncogene with multiple functions in tumor growth and inflammation [36, 37] as well as mitogenic MEK/ERK signaling in osteosarcoma [37]. Based on multi-omics network modeling Evi2a influenced ECM receptor interaction and focal adhesion [38], and we found Evi2a transcripts to continuously increase in expression. Additionally, the age-dependent regulation of the core component of nucleosome H4 clustered histone 17 (Hist1h4m) increased with age.
Apart from upregulated genes we searched for continuously down-regulated genes over time, and the results from the linear regression model are shown in Fig. 5D-E. Based on gene annotations the associated DEGs code for extracellular matrix and collagen fibril organization, respiratory system development, response to growth factors, blood vessel development and ossification (Fig. 5D). We classified 79% of continuously down-regulated DEGs with the David tool, and by querying the Metascape and the G:profiler software we assigned an additional 7% of DEGs to extracellular matrix structural components. Nonetheless, some DEGs were not allocated to specific ontology terms even though their regulation is of great significance. For instance, we found the gene coding for nicotinamide nucleotide transhydrogenase (Nnt), i.e. an enzyme that transfers protons to NAD+ and NADP+ repressed by 2-fold, respectively when animals aged week 1–5 were compared to aged mice. NADPH is a central cofactor for many biochemical processes and is required for the production of glutathione. Importantly, glutathione is one of the most important cellular defense lines in the detoxification of reactive oxygen species (ROS) [39] and also functions in inflammatory responses. Overexpression of Nnt in macrophages reduced intracellular ROS and the production of pro-inflammatory cytokines. Conversely, knockdown of Nnt increased intracellular ROS and inhibited cell proliferation [40]. Together, we consider the time dependent repression of Nnt as detrimental as it will dampen efficient ROS detoxification thereby contributing to cellular senescence.
A further example relates to Lys-Asp-Glu-Leu (KDEL) endoplasmic reticulum protein retention receptor 3 (Kdelr3), i.e. a seven-transmembrane-domain receptor localized within the Golgi complex. The binding of KDEL ligand to its receptor triggers phosphorylation of the Src-family of kinases, and the phosphorylation of p38 stimulates the activation of MAPKs [41]. Given that Kdelr3 was 2-fold repressed in aged mice, we consider this change in gene expression as an adaptive response to age-related stress responses and inflammation.
Similar, we found 2-fold repressed hephaestin in aged mice. The gene codes for an exocytoplasmic ferroxidase and plays an essential role in cellular iron homeostasis. Hephaestin favours iron export from cells and the protein is expressed in epithelial cells of the alveoli, type II pneumocytes, the bronchiole and endothelial cells [42]. Due to its role in iron transport, we considered the repression of hephaestin to be detrimental as malfunction of the protein will lead to an iron-overload of pneumocytes and the propagation of reactive oxygen species (ROS). The importance of hephaestin in lung cancer iron homeostasis was the subject of a recent report, and reduced expression of hephaestin is associated with poor prognosis for lung adenocarcinoma and squamous cell carcinoma [43].
Regarding the regulation of genes coding for extracellular matrix a complex picture emerges with some being time dependently repressed, notably matrix metalloproteinase (Mmp)-2, Mmp14, the disintegrin and metalloproteinase with thrombospondin motifs (Adamts)2, while others (e.g., Lrg1, Dcn) were upregulated especially in animals aged 6–26 week when compared to old ones. The marker genes code for MMP and ADAMTS, and these function in ECM remodeling which we discuss in the following paragraph.
Time resolved gene expression changes in the aged human lungWe searched for continuous gene expression changes in the pulmonary genome of the aging human lung and show in Fig. 6 the results for the validation set of 307 human lung samples. Given the primary aim of our study, we focused on the following GO terms for an age-related increase in gene expression changes: Naba core matrisome, extracellular matrix organization, degradation of the extracellular matrix, inflammatory response pathway and collagen fibril organization (Fig. 6A-B). The results for an age-related down-regulation of genes are shown in Fig. 6C-D. Here, we focused on the following GO terms: Cell morphogenesis, microtubule cytoskeleton organization, tight junction assembly, lipid transport and PPAR signaling.
Fig. 6
Gene expression changes of the aging human lung. Based on the linear regression model for N = 307 individual human genomic data sets (mice aged 21–85 years old), we identified 857 and 816 genes, respectively whose expression increased or declined with age (p < 0.05). Among the upregulated genes, 80 code for ECM remodeling, notably collagens (N = 13), proteoglycans (N = 7), matrix metalloproteinase (N = 4) and ECM-related glycoproteins (N = 33). We also include 10 genes coding for the inflammatory response pathway. Panel A1: Boxplot of 857 DEGs with increased expression over time. Panel A2: Boxplots of upregulated genes coding for ECM remodeling and immune response. B Regulation of individual genes with age. The genes refer to the data shown in the boxplots of A2 for the various ontology terms. Panel C1: Boxplot of 816 DEGs with decreased expression over time. Panel C2: Boxplots of down-regulated genes coding for cell morphogenesis, microtubule cytoskeleton organization, tight junction assembly, lipid transport and PPAR signaling. D Regulation of individual genes with age. The genes refer to the data shown in the boxplots of C2 for the various ontology terms
ECM remodeling in the aged lung of miceTo better understand the remodeling of extracellular matrix in the aging lung, we evaluated the expression of genes coding for collagens, proteoglycans, matrix metalloproteinase and their inhibitors in addition to glycoproteins over time. We considered the genomic data sets for N = 89 mice, and based on the linear regression model and the Limma statistical test we determined statistical significance for some ECM coding genes whose expression pattern followed a V-shape (Fig. 7A-C) in addition to continuously increased (Fig. 7D-F) and repressed transcript expression over time (Fig. 7G-I). Moreover, we identified a group of ECM coding genes which only increased in expression when 6–26 week old animals were compared to aged ones (Fig. 7F); in the same comparison some ECM coding genes declined in expression (Fig. 7I). Collectively, the genomic data informed on ECM remodeling in the aging lung (supplementary Table S5), and its increased deposition contributes to stiffness [44, 45].
Fig. 7
Age-dependent regulation of extracellular matrix coding genes. Shown is the regulation of 117 ECM coding gens in the lung of 89 individual mouse genomic data sets at different ages. These code for 28 collagens, 10 proteoglycans, 17 matrix metalloproteinase and 62 ECM-related glycoproteins. The data are expression values and the full genes names are given in supplementary Table S5. Note, significance testing is based on the LIMMA package. A V-shaped gene expression changes with age. The gene expression changes were significant among all age groups. B V-shaped gene expression changes with age. The gene expression changes were significant between mice aged 1–5 and 6–26 weeks. C V-shaped gene expression changes with age. The gene expression changes were significant between mice aged 6–26 weeks and old mice. D Continuously increased expression genes with age. The expression changes were significant between all age groups. E Continuously increased gene expression changes with age. The gene expression changes were significant between mice aged 1–5 and 6–26 weeks. F Continuously increased gene expression changes with age. The gene expression changes were significant between mice aged 6–26 weeks and old mice. G Continuously repressed gene expression changes with age. The expression changes were significant between all age groups. H Continuously repressed gene expression changes with age. The gene expression changes were significant between mice aged 1–5 and 6–26 weeks. I Continuously repressed gene expression changes with age. The gene expression changes were significant between week 6–26 and aged mice. *p < 0.05
V-shaped gene expression changes of ECM coding genes over timeLung development and its organ function is highly dependent on the coordinated expression of ECM genes. For instance, independent research identified interstitial collagen (collagen I and III) to achieve maximal expression levels at day 7th post partum, and this coincides with postnatal alveologenesis [45]. In the present study, several collagens followed a V-shape expression pattern, i.e. Col2a1, Col6a4, Col9a1, Col10a1, Col11a1, Col11a2, Col15a1 and Col25a1, and the majority codes for proteins of the lung scaffold. However, we were surprised to see the regulation of Col2a1, Col9a1, Col10a1, Col11a1 and Col11a2 in the lung given its major role in cartilage matrix biology. Notwithstanding, independent research reported a 4-fold upregulation of Col2a1 especially in aged mice [28] while in the present study a 2-fold upregulation was computed. Note, in the human lung upregulation of COL10A1 is part of the ECM remodeling, especially in lung cancer patients, and this collagen stimulates cell proliferation [46]. Alike, independent research revealed Col10a1 as 1.9-fold increased in aged mice [5], which is similar to our data, i.e. 2.2-fold. Furthermore, collagen type V and VI are structural components of the connective tissue of the surrounding vascular and bronchial walls [47, 48] and are enriched in fibers of fibrotic lesion [47]. With age their augmented expression resulted in more dense and thick ECM fibrils. Therefore, the accumulation of these collagens contributes to lung stiffness [47]. Similarly, the lamina reticularis of the airway becomes thickened by the enhanced deposition of collagen I and V which limits airway gas exchange. It is part of an airway remodeling that eventually results in damage of the alveolar walls and the occurrence of emphysema [49]. The formation of heterotypic fibrils also included collagen I and collagen III, i.e. major collagens of the pulmonary ECM which declined with age (Fig. 7G). In fact, collagen VI forms a unique beaded-filament structure [50] and acts as a binding element between collagen I/III fibrils and basement membranes [48, 51]. Additionally, collagen VI promotes cell adhesive properties of the ECM [52] and contributes to epithelial cell homeostasis [50]. During lung fibrosis the expression of collagen VI is increased and typically forms fibrils with collagen III [48].
In the present study, the transcript expression of Col6a4 increased whereas Col6a1, Col6a2 and Col6a3 decreased to a similar extent in aged mice (Fig. 7B and 7H), and independent research confirmed our findings at the protein level [5, 28]. Collagen VI is an essential basement membrane component, and Col15a1 acts as a biological ‘spring’ between the basement membrane and the interstitial border. It therefore contributes to the stabilization and protection of the pulmonary structure [53].
A further example relates to elastin which is highly expressed in the lung and required for alveogenesis. We compared neonatal mice to 6–26 week old ones and observed elastin mRNA expression declined by nearly 90% (Fig. 7G); and a similar finding was reported for the elastin protein in the lung of aged mice [28, 54]. Owing to its function in alveolar walls, a reduced elastin expression results in thinner and fragmented alveolar septa [55], and independent research showed a similar decline in elastin synthesis with age. As a result, a decreased tissue elastance was reported [28, 56], which leads to the regular airspace dilatation in the aging lung [57]. In fact, emphysema is characterized by reduced elasticity of the lung; however, the alveoli walls are destroyed mainly due to the degradation of elastin fibers [58]. Although lung compliance increases with age, the tissue elastance and tissue resistance decreases [56].
Continuously increased expression of ECM coding genes over timeShown in Fig. 7D-F are upregulated ECM coding genes, and panel A illustrates the highly significant 3.5-fold upregula
Comments (0)