Experimental animals
All experiments on rats were performed in accordance with the ARRIVE guidelines, the European Community Council (Directive 2010/63/EU), and current national legislation, conducted with approval from the National Food Administration of the Slovak Republic under no. Ro-3051-5/2021-220 and the Animal Care Committee of the Pavol Jozef Šafárik University in Košice. Wistar albino rats (strain Crl:WI, RRID:RGD_2308816) were obtained from Velaz (Prague, Czech Republic). The rats were housed under standard laboratory conditions with a 12-h photoperiod. The rats were fed a complete and balanced standard laboratory diet (Altromin International, Lage, Germany) and had ad libitum access to food and water. Experiments were performed on rats at postnatal day 8 (P8, neonatal period, n = 11), P29 (preadolescent period, n = 6), and P90 (young adult period, n = 6).
Tissue isolation
At each age, experimental animals were terminally anesthetized with an intraperitoneal overdose of sodium thiopental (500 mg/kg). Three rats per time point and experimental group were either (i) transcardially perfused with heparinized saline for gene expression analyses or (ii) transcardially perfused with heparinized saline followed by freshly prepared 4% paraformaldehyde in 0.1 M phosphate buffer (PB) at pH 7.4 for immunofluorescent labeling.
For immunofluorescence analyses, isolated lumbar segments (L3–L5) of spinal cord were postfixed in the same fixative at 4 °C for 24 h, followed by cryoprotection in 30% sucrose. Spinal cord samples were stored at 4 °C until further processing. Isolated tissue samples were cut to 40-µm-thick coronal sections using a freezing microtome (Leica CM1850, Leica Microsystems, Mannheim, Germany). For gene expression analyses, isolated segments of lumbar spinal cord (20–50 mg) were immediately immersed in TRI Reagent™ Solution (Invitrogen, Vilnius, Lithuania, #AM9738) and stored at − 80 °C until further analysis.
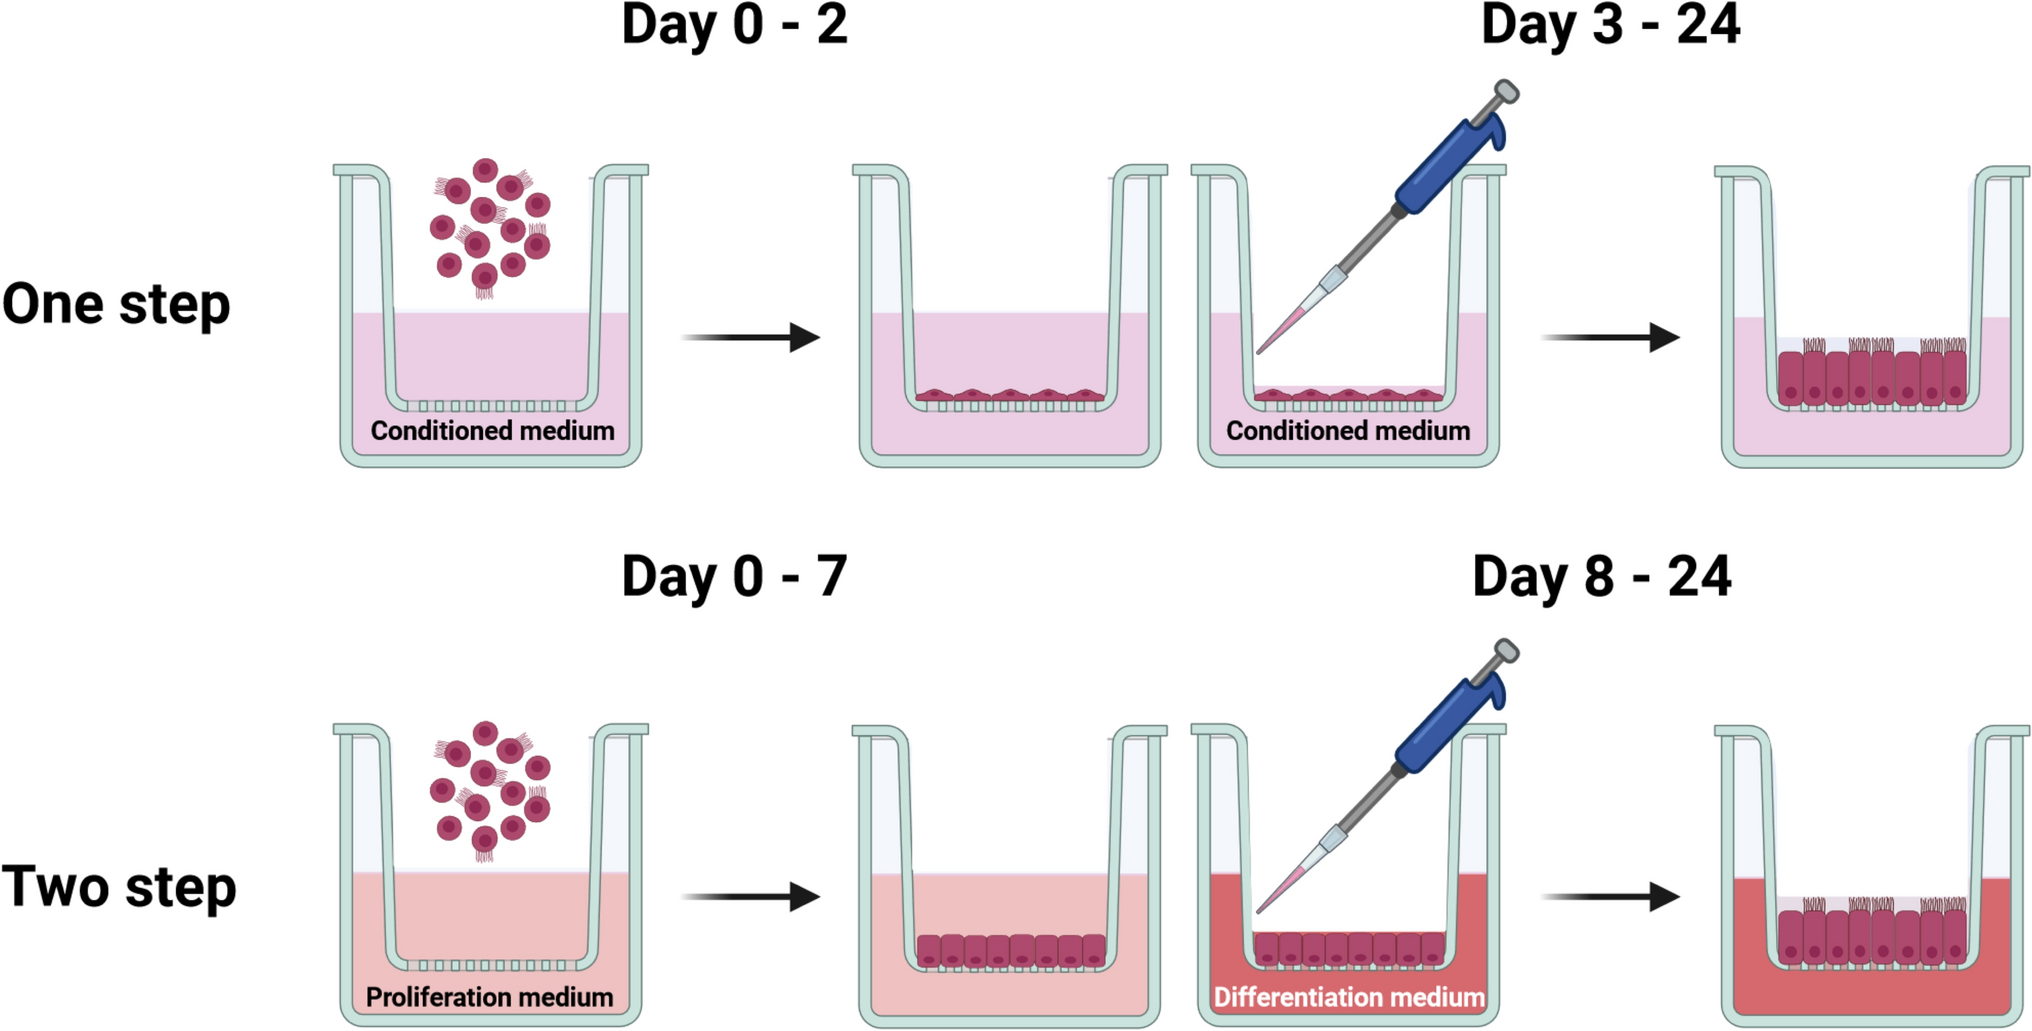
Primary cell culture preparation
Primary cell cultures were derived from spinal cords of P8 rats (n = 5). The rats were terminally anesthetized, decapitated, and the spinal cords were dissected. After removal of the meninges, the spinal cords were cut into small pieces and transferred to Papain Dissociation System solution (Worthington Biochemical Corporation, Lakewood, NJ, #LK003150) containing 0.01% papain and 0.01% DNase, in line with the isolation protocol, at 37 °C with intermittent gentle shaking for 45 min. After digestion, excisions were mechanically dissociated into cell suspension and centrifuged (300×g, 21 ℃, 10 min). The cell pellet was resuspended in DNase diluted in albumin inhibitor solution, and discontinuous density gradient (70×g, 21 ℃, 10 min) was used to remove membrane fragments. Subsequently, cells were seeded into 24-well tissue culture plates with laminin-coated cover glasses on the bottom (TPP, Trasadingen, Switzerland) and cultivated in culture medium composed of Dulbecco’s Modified Eagle Medium (#L0102-500) and Ham’s F12 (#L0135-500; 1/1 v/v) (both Biosera, Nuaille, France) supplemented with 5% fetal bovine serum (Biowest, Nuaillé, France, #S1400), antibiotics (penicillin/streptomycin 10,000 U/10,000 mg/mL, Biochrom AG, Berlin, Germany, #2213B), 1% B-27 supplement (#17504044), and 0.5% N-2 supplement (#17502048) (both from Gibco, Invitrogen, Carlsbad,CA, USA). Cells were cultivated under standard conditions in an incubator at 37 ℃, 5% CO2, and 95% humidity. In all wells, half of the medium was replaced every third day.
Establishment of an in vitro model of an apoptotic neural cell population
The apoptotic effect of staurosporine on primary cell cultures (7 × 10⁴ cells/well) was analyzed on day 13 of the cultures. For this endeavor, 1 mM staurosporine (Cell Signaling Technology, Leiden, the Netherlands, #9953) diluted in dimethyl sulfoxide (DMSO) was added to culture medium (1:1000 dilution ratio, final concentration 1 μM dm−3) along with Incucyte® Caspase-3/7 Dye for Apoptosis (Sartorius AG, Göttingen, Germany, #4440) and Incucyte® Annexin V Dye for Apoptosis (Sartorius AG, #4641) diluted 1:1500 and 1:200, respectively.
The progression of the development and distribution of apoptotic markers in the staurosporine-induced apoptotic cell population was monitored using the IncuCyte™ ZOOM system (Essen BioScience, Ann Arbor, MI, USA) for Caspase-3/7 Dye (excitation [Ex]/emission [Em] 500/530 nm) and for Annexin V Dye (Ex/Em 593/614 nm). Analysis was performed using the IncuCyte ZOOM 2016B analysis software (Essen BioScience, RRID:SCR_019874) on nine microphotographs for each well (n = 4 wells) taken with a ×10 objective lens (Supplemental Table 1) every 30 min for a total of 24 h. For both markers, individual analysis was performed uniformly for each captured microphotograph (Supplemental Table 2). The results were compared with control data obtained in a similar manner from a primary cell culture that was cultivated simultaneously in staurosporine-free medium.
Collection of samples for in vitro time-dependent analysis of apoptotic markers
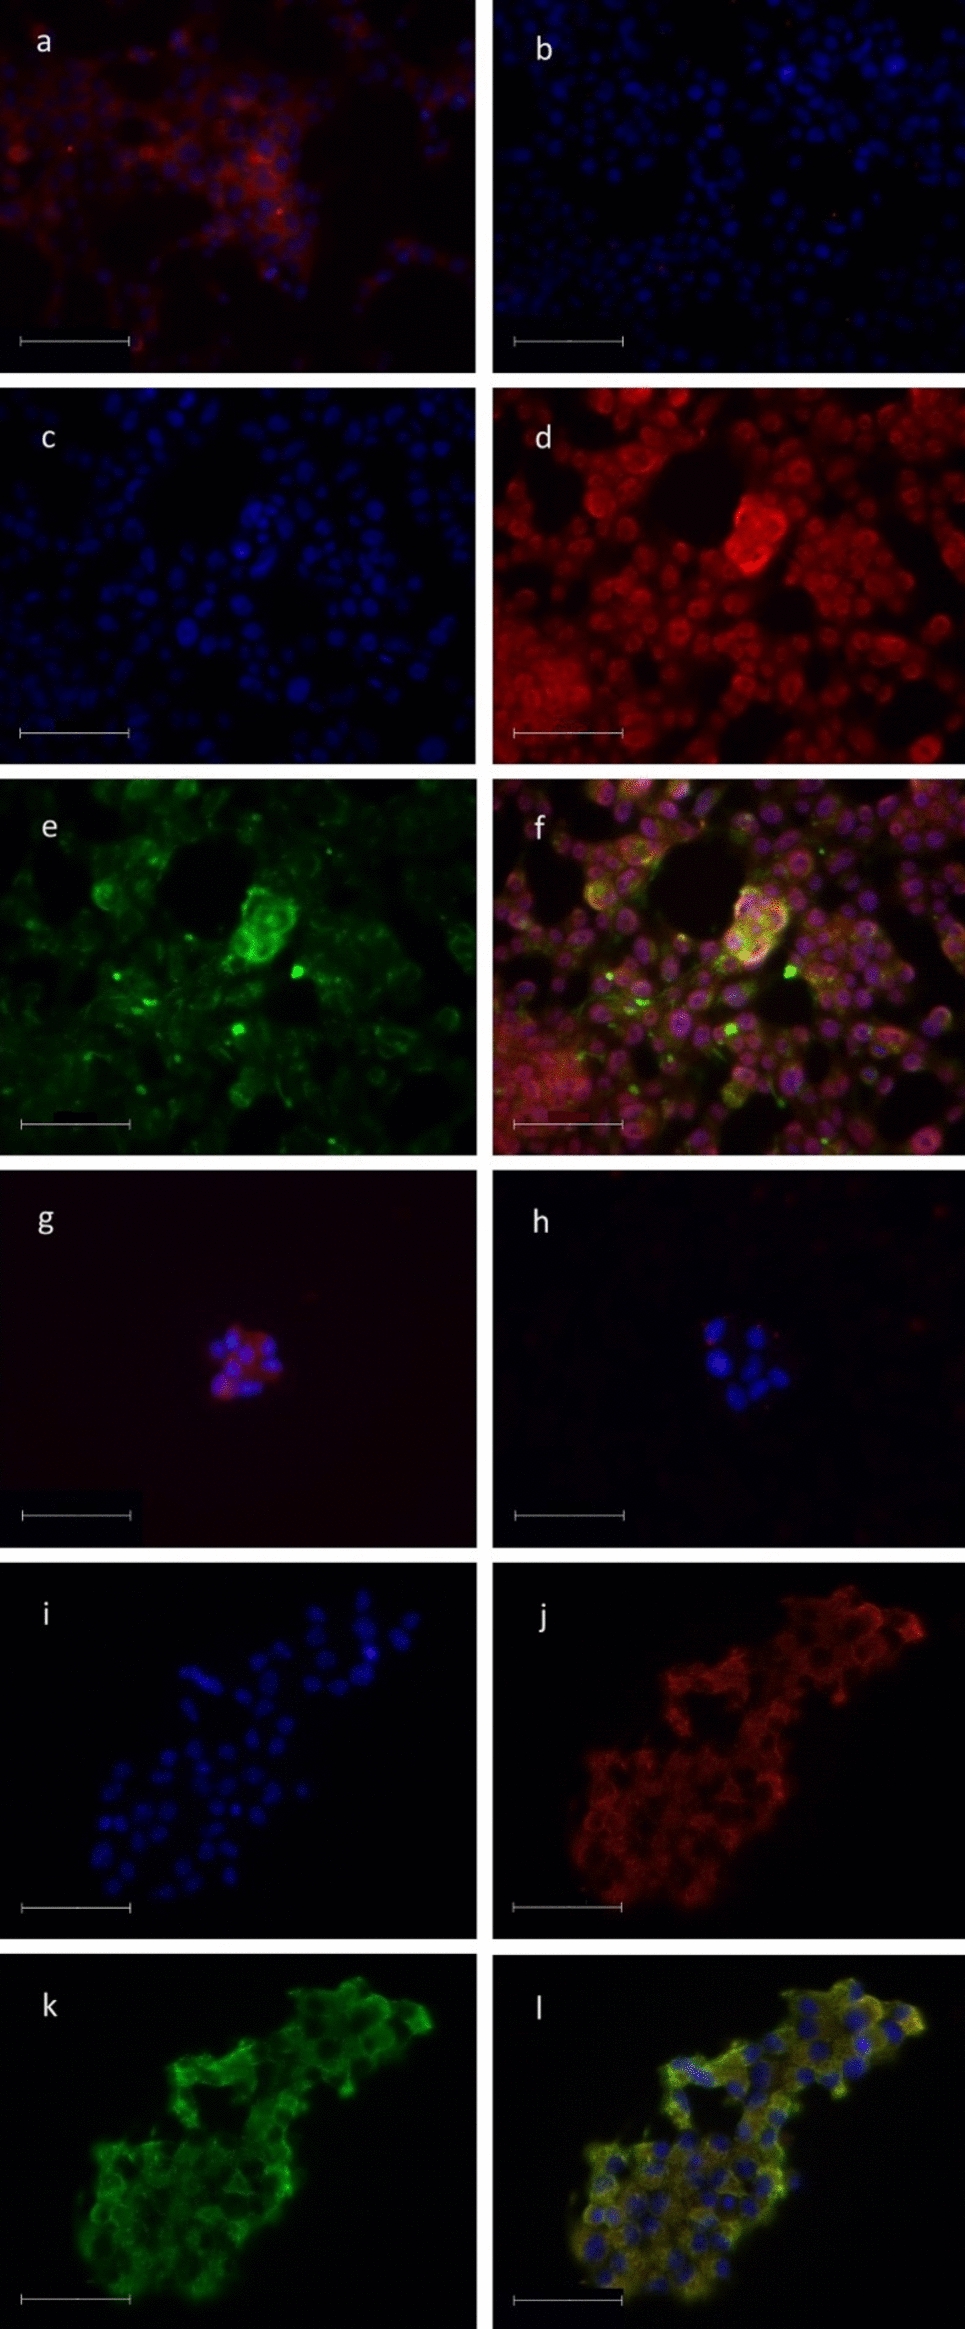
On day 14 of cultivation, time-dependent analysis of the presence of apoptotic markers was conducted using primary cell culture treated with staurosporine diluted in culture medium (final concentration 1 µM dm−3). After staurosporine was added, primary cell cultures were fixed each hour during the cultivation, starting at 0 h (no staurosporine effect) until 7 h. Cells were fixed with freshly prepared 4% paraformaldehyde in 0.1 M PB at room temperature for 20 min. Fixed primary cell cultures were then washed with 0.1 M phosphate-buffered saline (PBS) and immunofluorescently labeled. For selection of reliable marker(s) of apoptotic cells, both intact primary cell culture (negative control) and primary cell culture 5 h after staurosporine treatment (positive control) were used for immunolabeling.
Immunofluorescent labeling
Coronal sections of lumbar spinal cord and fixed primary cell cultures derived from spinal cord (henceforth referred to as samples) were rinsed in 0.1 M PBS. If necessary, antigen retrieval was applied by incubating the samples in 10 mM citrate buffer (pH 6.0) at 95.5 ± 0.5 °C for 10 min. After the samples were cooled to room temperature, they were washed with 0.1 M PBS. Non-specific protein activity was blocked by incubating samples with 5% normal donkey serum (NDS, Jackson Immunoresearch, West Grove, PA, USA, #017-000-12) in 0.1 M PBS with 0.3% Triton-X 100 at 4 °C overnight. Subsequently, the samples were incubated in a mixture of primary antibodies (Table 1) diluted in 0.1 M PBS containing 1% NDS and 0.3% Triton-X 100 at 4 °C overnight. After this incubation, the samples were washed with 0.1 M PBS and incubated with corresponding secondary antibodies (Table 1) diluted in 0.1 M PBS containing 1% NDS and 0.3% Triton-X 100 at room temperature in the dark for 2 h. Next, the samples were washed with 0.1 M PBS. To visualize cell nuclei, far-red dye DRAQ5 (1:500, Cell Signaling Technology, #4084) diluted in 0.1 M PBS was applied to tissue samples for 20 min. Finally, the samples were washed in 0.1 M PBS, mounted on glass slides, dried, and cover-slipped using ProLong Gold with DAPI (Invitrogen, #P36930).
Table 1 List of antibodies used in the studyMicroscopic analysis and microphotographs preparation
A Leica TCS SP5X confocal system equipped with LAS AF software (Leica Microsystems) and Leica Thunder Imager DMi8 epifluorescent microscope equipped with LAS X software (Leica Microsystems, RRID:SCR_013673) using ×10, ×40, and ×100 objective lens (Supplemental Table 1) were used to analyze immunofluorescently labeled tissue samples. Confocal imagining was done in XYZ mode (resolution 8 bits, 1024 × 1024 pixels, scanning speed 100 Hz, gain 600–750 V). The following Ex and Em wavelengths were used to visualize the fluorophores: AlexaFluor 488 (Ex 488 nm, Em 500–540 nm), AlexaFluor 555 (Ex 555 nm, Em 565–590 nm), and DRAQ5 (Ex 643 nm, Em 655–690 nm). Epifluorescence imaging was done in XYZ mode with a Leica DFC9000 GTC camera (resolution 24 bits, 2048 × 2048 pixels). The following Ex and Em wavelengths were used to visualize the fluorophores: DAPI (LED_405 filter cube Ex 405/60 nm, Em 470/40 nm) and AlexaFluor 488 (GFP filter cube, Ex 470/40 nm, Em 525/50 nm).
To analyze the cC3+population, five optical sections (Z-stacks) per animal at P8, P29, and P90 (n = 3 rats per time point) were captured using the ×40 objective lens. Stereological quantification of cC3+ cells was performed in ventral, lateral, and dorsal funiculi; the dorsal and ventral horns; and the central gray matter (henceforth referred to as regions of interest [ROI]) using ConfoCounter software (Institute of Experimental Physics, SAS, Košice, Slovakia, available for free download from the Microsoft Store at https://apps.microsoft.com/store/detail/confocounter/9PNSHZPXKHMM?hl=sk-sk&gl=sk&rtc=1). Densitometry analysis of the positivity of cC3+ nuclei was evaluated as relative intensity of fluorescence using Ellipse 2.0 software (ViDiTo, Košice, Slovakia). The abundance of cPARP+ cells in the spinal cord was counted using a ×40 objective lens on ROI of 20 tissue slices per P8, P29, and P90 spinal cords (n = 3 animals per time point).
The IncuCyte™ ZOOM system (Essen BioScience) with ×10 and ×20 objective lens was used to analyze primary cell cultures (Supplemental Table 1). The following parameters for imaging were used: resolution 24 bits, 1392 × 1040 pixels, Ex 460/40 nm and Em 524/40 nm, and Ex 585/40 nm and Em 665/80 nm filter.
Microphotographs were assembled into figures using ImageJ 1.53t (NIH, Bethesda, MD, USA, RRID:SCR_003070), Adobe Illustrator (RRID:SCR_010279), and Adobe Photoshop (RRID:SCR_014199) (Adobe Systems, San Jose, CA, USA). All modifications were limited to cropping and adjustment of brightness and contrast.
Identification of cC3 and cPARP after staurosporine-induced apoptosis in the in vitro model
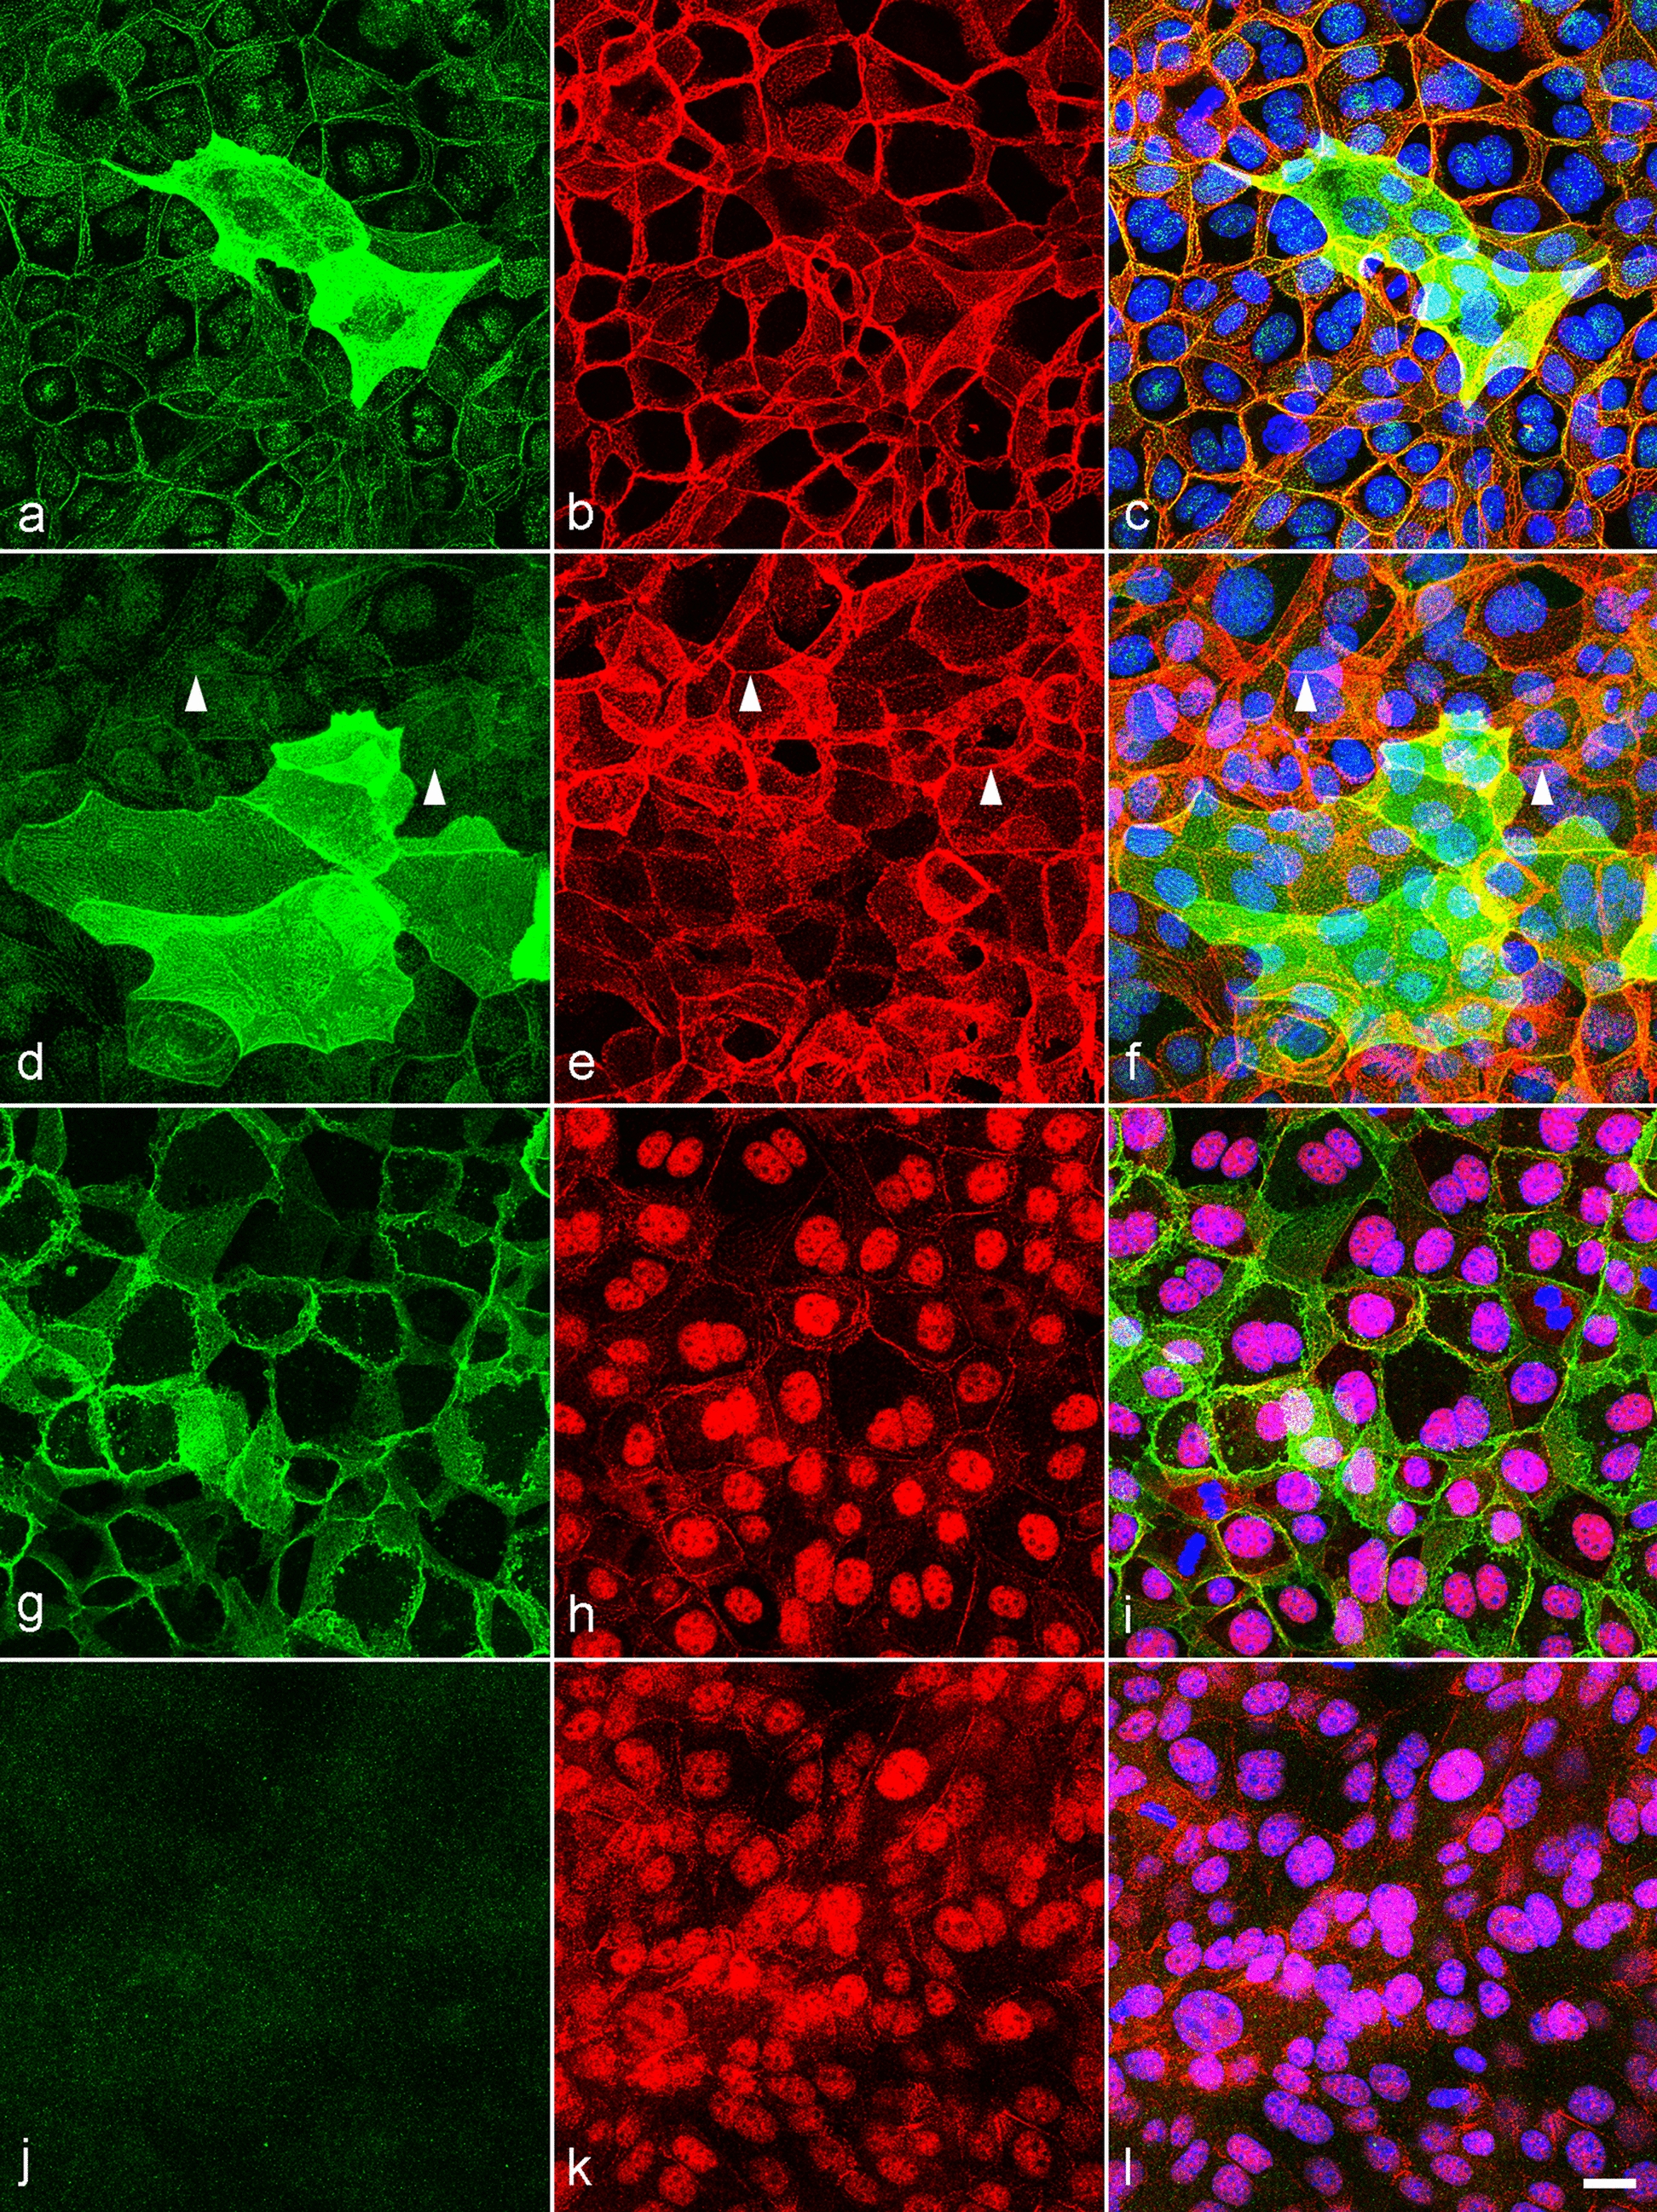
Immunofluorescent co-localization using anti-tubulin β 3 (clone TUJ1) and anti-APC (clone CC1) antibodies was realized to analyze the presence of cC3 and cPARP in neuronal and oligodendroglial populations of primary cell culture treated with staurosporine. Uniform analysis procedure (Supplemental Table 2) was prepared with the IncuCyte ZOOM 2016B analysis software (Essen BioScience) and used to estimate the number of cC3+ and cPARP+ cells per mm2 in 14 microphotographs taken with a ×10 objective lens from each well (n = 6 wells per experimental group). Co-localization of apoptotic (cC3, cPARP) and phenotypic (TUJ1, CC1) markers in cells was identified as signal overlap and performed on three wells per experimental group. Co-localization was evaluated as percentage of neurons or oligodendroglial cells.
Analysis of gene expression
Gene expression was analyzed to evaluate the abundance of inhibitors of apoptosis (IAPs, encoded by Birc genes) in the spinal cord of P8, P29, and P90 rats (n = 3 rats per time point). The absolute number of each gene transcript was determined by digital PCR (dPCR). The analyzed cDNA was prepared by reverse transcription (RT) of total RNA, isolated using the TRI Reagent™ Solution. Anchored oligo dT primer and RevertAid Reverse Trancriptase (Thermo Scientific, Vilnius, Lithuania, #EP0441) was used for RT. Both protocols were performed according to the manufacturer’s instructions. dPCR was performed by using the nanoplate-based technology QIAcuity Digital system, the QIAcuity One 5-plex instrument, 8.5K QIAcuity™ Nanoplates (#250021), and QIAcuity™ EG PCR Kit (#2500112) (all from Qiagen, Hilden, Germany) for amplification and detection of the products. Gene-specific PCR primers (Supplemental Table 3) were designed according to the reference sequence of rat Birc1-Birc7 genes by Primer-Blast (RRID:SCR_003095). Amplification of the desired product and lack of primer-dimers was confirmed by agarose gel electrophoresis and quantitative reverse transcription PCR (RT-qPCR). Depending on the gene, 10–50 ng of RNA/cDNA per 12-µL reaction was amplified by two-step PCR: denaturation at 95 °C for 2 min followed by 35 cycles of 95 °C for 15 s, and 60 °C for 15 s. To verify that the detection/quantification occurred in the linear range, a portion of each sample was diluted twofold and analyzed alongside the undiluted sample. RNA/cDNA isolated from testes of P29 rats was used as a positive control for transcripts with a low amount or absent PCR product in the spinal cord samples. Finally, the detected numbers of the individual Birc gene transcripts were normalized to normalization factor (NF) based on the expression of two reference genes (Gapdh and Eef1a1), which are stably expressed during postnatal development (Košuth et al. 2020). The NF was calculated as the geometric mean of copies of both reference genes. For genes with very low or absent transcripts in the spinal cord, the limit of quantification (LOQ) was determined. Serial dilutions of RNA/cDNA isolated from rat testes (which has high expression of Birc genes) were used for the purpose. The LOQ of Birc1, Birc3, and Birc7 transcripts per NF were 3.1–3.7 × 10⁻⁵, 2.2–2.6 × 10⁻⁴, and 1.5–1.6 × 10⁻⁴, respectively.
Statistics
GraphPad Prism (version 9.0.0, GraphPad Software, San Diego, CA, USA, RRID:SCR_002798) was used for statistical analysis and to prepare graphs. The data were analyzed using unpaired t test, one-way analysis of variance (ANOVA) followed by the Tukey–Kramer post hoc test for multiple comparisons or repeated-measures two-way ANOVA followed by the Bonferroni post hoc test for multiple comparisons. A difference between groups or time points was considered statistically significant with a p value of less than 0.05.

留言 (0)