
記住我

We developed a custom 36-parameter spectral flow cytometry panel optimized to simultaneously interrogate AML blast surface phenotype, normal HSPC subsets, mature immune cells and individual activating and inhibitory FcγRs in human bone marrow (Supplementary Table 1). This assay included profiling of antigens (CD123, TIM-3, CD33, CD47, CD90, CD38, CD25, CD70 and U5 snRNP200) being actively assessed in clinical trials10,11,12 or previously described as putative AML-associated antigens13,14,15. U5 snRNP200 was specifically included based on prior identification of cell surface U5 snRNP200 protein expression on AML cells15. In this prior study, antibodies directed against U5 snRNP200 were identified as produced in donor B cells from patients with AML in long-term remission after allogeneic HSC transplantation, suggesting that anti-U5 snRNP200 antibodies may be responsible for effective graft-versus-leukemia effect. Our antibody panel was applied to bone marrow samples from 46 newly diagnosed clinically and genetically annotated adult patients with AML (Supplementary Table 2). This cohort represents the heterogeneous features of newly diagnosed patients with AML with a median age of 58 years and with 65% of patients being of adverse risk, respectively, according to 2022 European LeukemiaNet risk classification1 (Fig. 1a and Supplementary Table 2). The median follow-up for the cohort is 4.3 years.
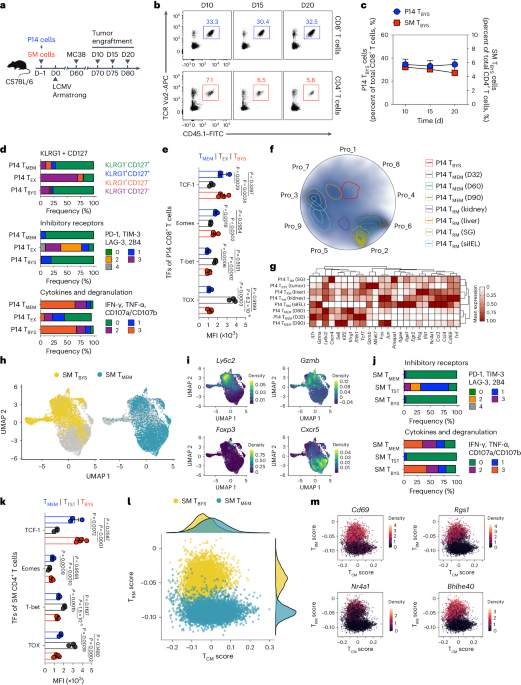
Fig. 1: High-density immunophenotyping of AML surface antigen expression identifies AML-associated antigens.
a, Oncoprint summarizing AML patient characteristics, clinical parameters and expression of AML-associated antigens on bone marrow leukemic blasts. ELN, European LeukemiaNet. b, Representative UMAPs comparing control and age-matched AML patient bone marrow samples subjected to 36-parameter phenotyping. Heatmap colors indicate relative surface antigen expression intensity. Red dashed lines indicate unbiased identification of malignant blasts. c, Median fluorescent intensity (MFI) of surface antigen expression on normal bone marrow HSPCs (n = 7 donors) versus AML blasts across patients (n = 46). HSCs (Lin−CD34+CD45dimCD90+CD38−); MPP (Lin−CD34+CD45dimCD90−CD38−); CMP, common myeloid progenitor (Lin−CD34+CD45RA−CD38+CD123+); GMP, granulocyte–macrophage progenitor (Lin−CD34+CD45RA+CD38+CD123+); MEP, megakaryocyte–erythroid progenitor (Lin−CD34+CD45RA−CD38+CD123−); P values are from the Mann–Whitney test: U5 snRNP200 blasts versus HSCs, ***P = 0.0006; blasts versus MPPs, ***P = 0.0001; blasts versus CMPs, **P = 0.0016; blasts versus granulocyte–macrophage progenitors, **P = 0.0068; blasts versus MEPs, ***P = 0.0004; CD47+ blasts versus HSCs, ***P = 0.0005; blasts versus MPPs, **P = 0.0022; blasts versus CMPs, *P = 0.0202; blasts versus MEPs, *P = 0.0101; TIM-3+ blasts versus HSCs, *P = 0.0275; blasts versus MPPs, **P = 0.0028; blasts versus CMPs, *P = 0.0326. Data are mean ± s.e.m.
Using live cell populations from bone marrow samples from six unaffected donors (median age, 41.5 years) and patients with AML as input, we generated uniform manifold approximation and projections (UMAPs) to objectively delineate the malignant blast compartment from normal cell populations in an unbiased manner (Fig. 1b and Extended Data Fig. 1a). One of the main challenges of current AML antibody-based therapeutics is on-target off-tumor side effects due to expression of the antibody target on normal HSPCs10,16. Comparison of surface expression of antigens under evaluation for AML therapeutic targeting revealed increased abundance of CD47 (P = 0.0005), TIM-3 (P = 0.028) and U5 snRNP200 (P = 0.0006) on the surface of AML cells relative to normal hematopoietic stem cells (HSCs) (Lin−CD34+CD45dimCD90+CD38−) from age-matched healthy individuals, consistent with prior reports15,17,18 (Fig. 1c). At the same time, the most significant differentially expressed antigen between AML blasts and normal CD34+ hematopoietic precursors was U5 snRNP200, as this antigen (originally identified as a potential AML-specific antigen in prior work15) was totally absent from normal HSCs, multipotent progenitors (MPPs) and any downstream myeloid progenitor population (Fig. 1c). Of note, U5 snRNP200 was present on blasts from 50% of newly diagnosed patients with AML. In patients with AML in whom U5 snRNP200 cell surface expression was detected on bulk CD34+ malignant cells, U5 snRNP200 was also present on immunophenotypically defined leukemia stem cells (Fig. 2a).
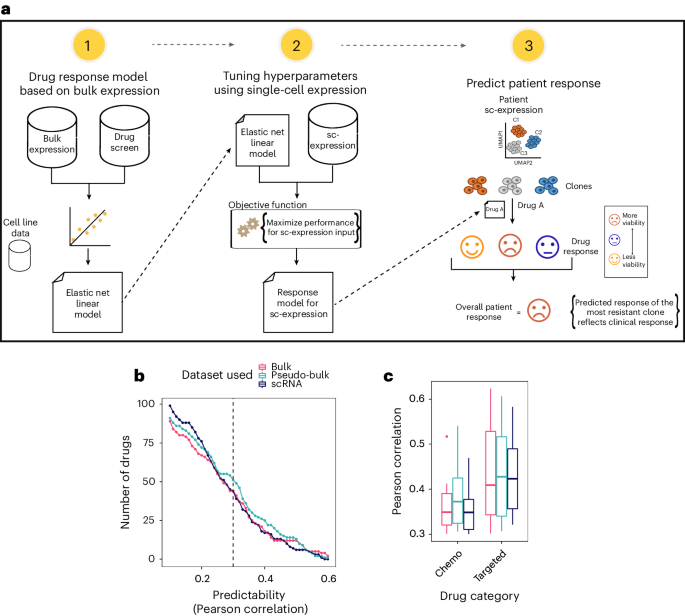
Fig. 2: Cell surface expression of U5 snRNP200 in AML and coexpression patterns with other AML-associated antigens.
a, Histograms of MFI on live HSCs (live Lin−CD34+CD45dimCD90+CD38−) and lympho-primed MPP cells (LMPPs; live Lin−CD34+CD38−CD90−CD45RA+ cells) from normal bone marrow (blue lines) versus on AML leukemia stem cells (LSCs; live CD34+CD38−CD90−CD45RA+ cells) for five distinct patients with AML whose bulk leukemic cells express cell surface U5 snRNP200. b, Bubble plot summarizing surface antigen expression and mutation status patterns. Bubbles with dark circle outlines highlight patterns that reach statistical significance (that is, CD25 expression and DNMT3A mutations co-occur, whereas CD33 and RUNX1 mutations are mutually exclusive). log-transformed P values were determined by one-sided Fisher test, with positive values indicating positive associations and negative values indicating negative associations. c, Circos plot depicting coexpression between U5 snRNP200 and known AML-associated surface antigens on AML patient bone marrow blasts. d, Correlogram depicting Pearson correlation coefficients of surface antigen intensity on AML patient bone marrow blasts.
We next examined the co-occurrence of mutations with antigen expression on blasts in this cohort of newly diagnosed adult patients with AML. This revealed a statistically significant positive association between DNMT3A mutations and surface CD25 expression as well as a significant negative association in which patients with mutations in RUNX1 tended to have less CD33 on AML blasts (Fig. 2b). The association between CD33-positive blasts and NPM1 mutation was captured in our data despite not reaching statistical significance19,20. Importantly, however, there were no clear statistically significant associations between any genetic alterations and surface U5 snRNP200 expression in this cohort. Moreover, there was no statistically significant association between U5 snRNP200 cell surface expression and age at diagnosis, AML risk group, sex or outcome at time of analysis (living or deceased).
Coexpression of antigens on AML blasts was also analyzed with the aim of defining antigen combinations suitable for multispecific or bispecific antibodies or multi-antigen CAR T cell therapy, approaches being actively pursued in hopes of reducing on-target off-tumor side effects. Indeed, we observed patterns of antigen coexpression on AML blasts (Fig. 2c,d) including statistically significant coexpression of U5 snRNP200 with CD47 (P = 0.002) and TIM-3 (P < 0.0001), two antigens under evaluation using separate therapeutic antibodies in phase 2–3 clinical trials for patients with AML or myelodysplastic syndrome currently21.
Skewed Fc receptor distribution in the AML microenvironmentThere is abundant evidence that tumor-targeting antibodies with Fc regions optimized to activate immune cell subsets have greater anti-tumor effects than antibodies that do not engage immune cell subsets7. However, the precise distribution of Fc receptors on immune cell subsets present in the AML bone marrow microenvironment has not previously been explored. To address this, we integrated antibodies specific for the activating receptors CD32A (also known as FcγRIIA) and CD16 (FcγRIIIA) as well as the inhibitory receptor CD32B (FcγRIIB) (Fig. 3a) into our custom 36-parameter flow cytometry panel. This panel captures all Fc receptor-expressing immune effector cells that contribute to ADCC (classical, immature and nonclassical monocytes, natural killer (NK) cells) and other immune cell populations that express Fc receptors (conventional, plasmacytoid and monocyte-derived dendritic cells as well as B cells, plasmablasts and basophils). Importantly, the strategy of generating UMAP projections overlaying samples from unaffected donors and patients with AML allows for unbiased demarcation of the malignant cell population, which can be readily identified on the UMAP projection and eliminated from immune cell analysis (Extended Data Fig. 1b,c). Exclusion of malignant AML cells from normal cell populations is essential, given the potential overlap of expression of immune cell markers on leukemic cells, which can compromise the integrity of manual gating strategies22 (Extended Data Fig. 1d).
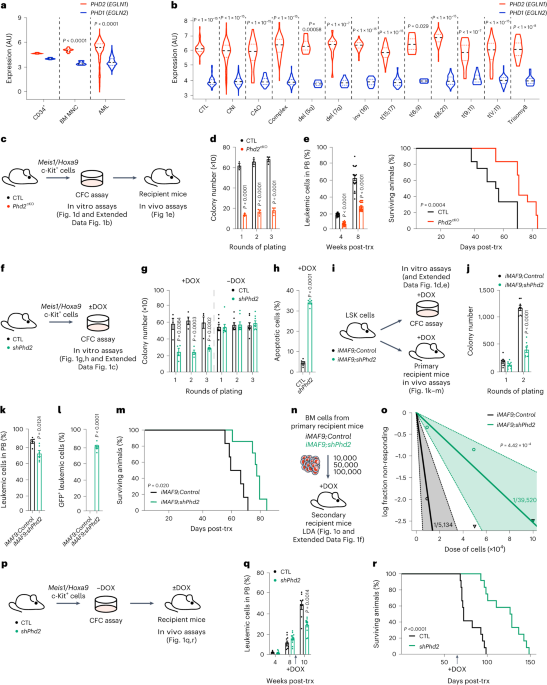
Fig. 3: Alterations in frequencies and distribution of Fc receptor expression on immune cell subsets in the bone marrow microenvironment of patients with AML.
a, Schematic summary of FcγR expression across normal immune cell subsets. ITAM, immunoreceptor tyrosine-based activating motif; ITIM, immunoreceptor tyrosine-based inhibitory motif. b, Expression of activating receptor CD32A on monocyte populations in AML bone marrow (orange, n = 44 patients) compared to bone marrow from unaffected donors (blue, left, n = 6 donors) and representative flow cytometry histogram of CD32A expression on AML nonclassical monocytes (orange) compared to controls from unaffected donors (blue, right); P values are from Welch’s unpaired t-test. *P = 0.0182 (classical monocytes), *P = 0.0193 (immature monocytes), ****P < 0.0001 (left). c, Expression of activating receptor CD16 on CD56dim NK cells in AML bone marrow (n = 44 patients) compared to bone marrow from unaffected donors (left, n = 6 donors) and a representative flow cytometry histogram (right); P values are from Welch’s unpaired t-test. ***P = 0.0002 (left). d, Inhibitory receptor CD32B on B cells and monocytes in AML bone marrow (n = 44 patients) compared to bone marrow from unaffected donors (n = 6 donors) (top) and representative flow cytometry histograms (bottom); P values are from Welch’s unpaired t-test. **P = 0.0048 (classic memory B cells) and 0.0094 (non-naive B cells) (top). NS, not significant. e, Representative UMAP overlay generated from the 36-color spectral flow cytometry panel comparing normal bone marrow (blue) and AML bone marrow (orange, left) and individual representative UMAPs depicting classical monocyte and cDC2 cell populations (each demarcated with a red outline) in an unaffected control donor (top) compared to a patient with AML (bone marrow) in whom these populations are absent (bottom). f, Quantification of classical monocytes and cDC2 cells in AML bone marrow (n = 49) compared to bone marrow from control donors (n = 7 donors); P values are from Welch’s unpaired t-test. **P = 0.0028 (classical monocytes), **P = 0.0014 (cDC2) and ****P < 0.0001 (pDC). Data are mean ± s.e.m.
Comparison of expression of the activating Fc receptors CD32A and CD16 on mature immune cells in bone marrow of unaffected individuals versus those with AML revealed significant downregulation of the activating receptor CD32A on classical (CD14+CD16−; P = 0.02), immature (CD14+CD16+; P = 0.02) and nonclassical (CD14−CD16+; P < 0.0001) monocytes (Fig. 3b) as well as downregulation of activating receptor CD16 on CD56dim NK cells (P = 0.0002) in patients with AML (Fig. 3c). Furthermore, there was increased expression of the inhibitory Fc receptor CD32B on classic memory B cells (CD20+CD19+IgD−; P = 0.005) and non-naive B cells (CD20+CD19+IgD− and CD20+CD19+IgD+CD27+; P = 0.009) as well as classical and nonclassical monocytes in AML marrow compared to those from healthy control individuals (Fig. 3d). Moreover, patients with AML had a significantly lower frequency of classical monocytes (P = 0.003), type 2 conventional dendritic cells (cDC2; P = 0.001) and plasmacytoid dendritic cells (P < 0.0001), cell types required for ADCC and antigen presentation, respectively, in their marrow than unaffected individuals (Fig. 3e,f). Finally, there was no significant difference in the frequency of T cell populations in the bone marrow of newly diagnosed patients with AML and unaffected donors, consistent with prior reports23 (Extended Data Fig. 1e).
Overall, these data identify a previously unrecognized imbalance in the ratio of activating to inhibitory Fc receptors in the immune microenvironment of AML. In particular, the adult AML bone marrow is characterized by a greater proportion of immune effector cells expressing inhibitory Fc receptors as well as fewer classical monocytes, cDC2 cells and plasmacytoid dendritic (pDC) cells than in unaffected individuals.
Surface membrane regulation of U5 snRNP200 in AMLU5 snRNP200 is an ATP-dependent RNA helicase 250 kDa in size, which is an essential, evolutionarily conserved core component of the spliceosome24. Its function and molecular mechanism have been exquisitely defined as serving to unwind duplex RNA formed by U4 and U6 small nuclear RNA required for formation of the catalytic spliceosome25. It was therefore unexpected that a nuclear enzyme involved in RNA splicing would be present on the cell membrane15.
Given that antibody-based detection of U5 snRNP200 alone may not reliably prove the presence of full-length U5 snRNP200 on the plasma membrane, we sought to rigorously validate this observation by introducing the sequence encoding a HaloTag epitope in frame into the sequence for the N terminus of the protein encoded by SNRNP200 in K562 human AML cells using CRISPR-mediated homology directed repair (HDR) editing (Fig. 4a,b). Subcellular fractionation of HaloTag knock-in K562 cell clones and controls followed by western blotting for HaloTag and U5 snRNP200 confirmed the presence of endogenous U5 snRNP200 in the nuclear fraction in parental K562 cells and at its full size of 250 kDa in the two HaloTag knock-in clones. Moreover, western blotting of lysates from distinct cellular compartments revealed localization of full-length U5 snRNP200 (as indicated by the HaloTag) on the cell membrane (Fig. 4c). We further confirmed localization of endogenous U5 snRNP200 at the cell membrane using cell-impermeable fluorescent ligands that interact with the HaloTag (Fig. 4d). At the same time, the abundance of cell membrane-localized U5 snRNP200 was only a fraction of U5 snRNP200 present within the cell, as revealed by membrane-permeable fluorescent ligands that interact with the HaloTag (Fig. 4d). These data indicate that the N terminus of U5 snRNP200 is extracellular on the surface of AML cells.
Fig. 4: Genetic validation of cell surface membrane U5 snRNP200 expression and determinants of U5 snRNP200 cell surface membrane localization.
a, Schema of the vector engineered for knock-in of the sequence for N-terminal HaloTag into the SNRNP200 locus in the human AML cell line K562. UTR, untranslated region. HA, homology arm. b, PCR amplification of the HaloTag sequence for verification of expression in HaloTag–U5 snRNP200-expressing K526 cells. Representative of three independent experiments. c, Western blot for HaloTag (two exposure times are shown and denoted as light and heavy) and U5 snRNP200 in subcellular fractions of K562 cell clones expressing HaloTagged endogenous U5 snRNP200. Loading controls for cell fractions include tubulin (cytoplasmic), Na+/K+ ATPase pump (membrane) and specificity protein 1 (SP1; soluble, nuclear). WT, wild type. d, Representative flow cytometry histograms of MFI values (left) for cell-impermeable (top) and cell-permeable (bottom) fluorescent HaloTag ligands in K562 cells from b and quantification of signal (right; mean value is shown and each dot represents a data point from an independent experiment). AF660, Alexa Fluor 660. TMR, tetramethylrhodamine.
Given the unexpected presence of surface membrane U5 snRNP200, we next sought to determine the molecular regulators of surface U5 snRNP200 expression. We applied the genome-wide Brunello single-guide RNA (sgRNA) library26 to two human AML cell lines expressing cell surface U5 snRNP200 (K562 and U937 cells) and sorted the highest (top 10%) and lowest (bottom 10%) surface U5 snRNP200-expressing populations (Fig. 5a). Sequencing of sgRNA species in these two populations revealed that knockout of FCGR2A, the gene that encodes the activating Fc receptor CD32A, was highly associated with loss of surface U5 snRNP200 expression in both cell lines (P < 0.05; Fig. 5b). Moreover, Gene Ontology (GO) analysis indicated numerous genes encoding proteins required for subcellular protein trafficking that were also required for cell surface U5 snRNP200 expression (Fig. 5c).
Fig. 5: Determinants of U5 snRNP200 cell surface membrane localization on the AML cell surface and coexpression with CD32A.
a, Schema of the whole-genome CRISPR screen to identify genes positively and negatively associated with U5 snRNP200 cell surface expression on AML cells. As shown, the Brunello sgRNA library (via GFP+ lentivirus) was stably introduced in K562 and U937 cells, and, subsequently, the top 10% and bottom 10% of U5 snRNP200-surface expressing GFP+ cells were sorted for sgRNA sequencing. b, Statistically significant sgRNA species associated with low U5 snRNP200 expression in U937 (y axis) and K562 (x axis) cells. RRA, robust rank aggregation. As shown, knockout of FCGR2A (which encodes FcγRIIA or CD32A) was significantly associated with low cell surface snRNP200 expression across both cell lines. c, GO analysis of genes required for cell surface U5 snRNP200 expression from the CRISPR screen in e. d, Histograms of CD32A (left) and U5 snRNP200 (right) expression on U937 cells following stable knockout of FCGR2A and re-expression of CD32A using cDNA impervious to knockout. Histogram flow cytometry plots are representative of five flow cytometry experiments performed using these cell lines. e, Heatmap depicting coexpression patterns of antigens on AML blasts including coexpression of U5 snRNP200 and CD32A. f, UMAP overlay comparing samples from unaffected donors and patients with AML for identification of malignant AML cells (left, isolated orange cell island) and colorimetric overlays of known and new AML antigens for antibody targeting (right) facilitate visualization of expression on AML cells versus normal cells as well as coexpression patterns on AML cells. SRP, signal recognition particle.
To confirm the role of CD32A in surface U5 snRNP200 expression, we performed flow cytometry using U937 cells with CRISPR-mediated stable knockout of FCGR2A using an sgRNA independent from those used in the CRISPR screen. Flow cytometric staining for CD32A confirmed diminished expression in FCGR2A-knockout cells (Fig. 5d). Importantly, U5 snRNP200 cell surface expression mirrored that of CD32A, as U5 snRNP200 cell surface abundance was also abolished with FCGR2A knockout. Moreover, restoration of surface CD32A expression using FCGR2A cDNA impervious to sgRNA knockout rescued both cell surface U5 snRNP200 and CD32A expression (Fig. 5d). Consistent with these cell line data, a tight association between CD32A and U5 snRNP200 protein abundance on the surface of AML cells was also clear in patient specimens (Fig. 5e,f).
Given that CD32A is a known transmembrane protein, we hypothesized that the cell surface association with U5 snRNP200 occurs due to physical association of CD32A and U5 snRNP200 in AML cells. To test this hypothesis, we performed immunoprecipitation of CD32A in cell membrane protein fractions from control and FCGR2A-knockout K562 cells followed by mass spectrometry. This revealed a clear interaction of CD32A and U5 snRNP200 in the membrane of AML cells in K562 cells, and the specificity of this interaction was confirmed, as U5 snRNP200 was not detected in the cell membrane of FCGR2A-knockout K562 cells (Fig. 6a,b). Immunoprecipitation–mass spectrometry data were validated by immunoprecipitation–western blot experiments in which CD32A and U5 snRNP200 interacted in both the cell membrane and the cytoplasm. Finally, we identify that the cell membrane association of U5 snRNP200 is dependent on the transmembrane domain of CD32A (Fig. 6c). Transfection of 293T cells (which lack cell surface expression of CD32A or U5 snRNP200) to express CD32A resulted in cell surface localization of both proteins (Fig. 6d–g). In fact, the levels of CD32A cell surface abundance in the transfected cells was associated with cell surface U5 snRNP200 abundance. Conversely, cells transfected to express CD32A constructs that lack the transmembrane domain failed to express cell membrane U5 snRNP200 (Fig. 6e). These studies rigorously validate surface U5 snRNP200 expression on AML cells and elucidate CD32A as a key regulator of the physical association of U5 snRNP200 at the AML cell surface.
Fig. 6: Physical interaction of CD32A and U5 snRNP200 at the AML cell membrane and requirement of the CD32A transmembrane domain for U5 snRNP200 surface membrane localization.
a, Volcano plots of proteins differentially enriched in immunoprecipitation of CD32A from the membrane followed by mass spectrometry from wild-type versus knockout K562 cells. Proteins displayed were identified in FCGR2A-wild-type versus FCGR2A-knockout cells in triplicate, and values displayed are the mean of triplicate results. P values were derived by two-sided t-test, and P values were adjusted for multiple comparisons. b, Quantification of CD32A (left) and U5 snRNP200 (right) from immunoprecipitation–mass spectrometry of membrane-bound CD32A from FCGR2A-wild-type versus FCGR2A-knockout K562 cells. Each value represents data from a single mmunoprecipitation–mass spectrometry experiment with three biological replicates. c, Immunoprecipitation of CD32A followed by western blot in the cells from a. Representative of three independent experiments. d, Schematic of experiments to test the requirement of CD32A and its transmembrane (Tm) domain in the cell surface localization of U5 snRNP200 in 293T cells. e, Histograms of CD32A (left) and U5 snRNP200 (right) in 293T cells transfected with control, FCGR2A-wild-type cDNA or FCGR2A cDNA with in-frame deletion of the sequence for the transmembrane domain (‘CD32A ΔTm domain’). f, Representative flow cytometry plot of CD32A versus U5 snRNP200 surface expression in 293T cells transfected to express CD32A. g, Cell surface expression of U5 snRNP200 (right) in the cells from d gated on low versus high CD32A-expressing cells (left). Data are mean ± s.e.m.
Upregulation of viral RNA sensing in U5 snRNP200-high AMLWe next sought to evaluate the biological characteristics of AML blasts with upregulated cell surface U5 snRNP200. We employed cellular indexing of transcriptomes and epitopes by sequencing (CITE-seq)27 to simultaneously capture surface proteomes and gene expression. A panel of 131 oligonucleotide-tagged antibodies, including a custom antibody-derived tagged (ADT) anti-U5 snRNP200 antibody, was applied to 11 bone marrow samples including three from age-matched unaffected donors and eight newly diagnosed patients with AML (Supplementary Table 3). A total of 42,251 cells were mapped28,29,30 using gene expression signatures from a previously published annotated reference dataset of bone marrow samples from newly diagnosed patients with AML and healthy age-matched controls (Fig. 7a)31. Clusters were validated based on expression of lineage-specific gene expression and cell surface markers known to demarcate specific immune cell populations32 (Extended Data Fig. 2a) and exhibited reliable pseudotime estimates33 (Extended Data Fig. 2b,c), consistent with differentiative expectation. Samples from unaffected donors contained preserved normal immune cell subsets, whereas these populations were variable in patients with AML, consistent with previous reports32,34 (Extended Data Fig. 2d,e).
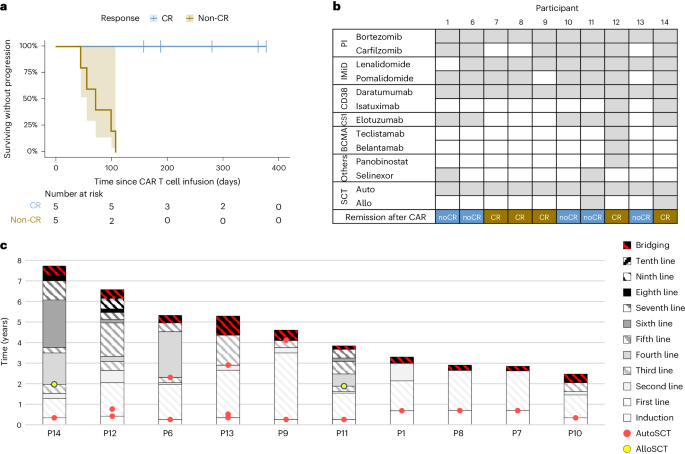
Fig. 7: Unbiased evaluation of cell surface U5 snRNP200 expression in normal and malignant hematopoietic cells and transcriptional characteristics of cell surface U5 snRNP200-expressing AML cells.
a, Multimodal UMAP projection delineating cell populations originating form normal and malignant AML bone marrow samples (top) and cell type labels (bottom). CTL, cytotoxic T lymphocytes; proB, pro-B cells. b, Representative U5 snRNP200 ADT colorimetric overlay on AML (left) and control donor (right) bone marrow cell populations. c, Representative UMAPs generated from the custom 36-parameter spectral flow cytometry panel displaying cell populations in control bone marrow. Heatmap colors indicate relative antigen expression intensity. Dashed lines indicate cell island subsets for comparison of surface U5 snRNP200 expression (bottom left): CD19+ B cells, green; CD56+ NK cell subset, yellow; CD16+ NK cell subset, red; CD14+ monocyte subset, orange; CD34+ HSCs, purple). d, Pathway enrichment observed in high U5 snRNP200-surface expressing AML cells. Enrichment score was calculated for a given gene set using log2-transformed fold change ranking when comparing U5 snRNP200-high versus U5 snRNP200-low populations and then normalized by the size of that gene set. To identify the P value, 1,000 random gene sets were generated, and an enrichment score was calculated for each of them. The P value was estimated as the number of random gene set enrichment scores with the same or more extreme values divided by the total number of randomly generated gene sets. For the adjusted P value, the Benjamini–Hochberg procedure was used. e, Differential gene expression in high versus low U5 snRNP200-surface expressing AML cells. P values were identified by two-sided implementation of the Wilcoxon rank-sum test. The P value was adjusted for multiple testing using Bonferroni correction. f, Dedicated AML cell UMAP depicts distinct proteogenomic subsets. g, Colorimetric overlay of surface expression of U5 snRNP200, CD33 and CD32 ADT signals along with IFITM2 and IFITM3 mRNA expression in the top 10% highest (top) and bottom 10% lowest or negative (bottom) U5 snRNP200-surface expressing AML cells.
Projection of U5 snRNP200 ADT signals onto the UMAP cell clusters confirmed the absence of U5 snRNP200 surface expression on HSPCs while affirming the presence of cell surface U5 snRNP200 on AML cells (Fig. 7b). In addition, surface U5 snRNP200 was clearly present on B cells and a subset of NK cells (CD56dim NK cells) and monocytes (classical monocytes) within bone marrow of unaffected donors and patients with AML (Fig. 7b). The expression pattern of cell surface U5 snRNP200 in unaffected donors was consistent across CITE-seq and spectral flow cytometry in which surface U5 snRNP200 was present on B cells (Fig. 7c, green outline), a subset of NK cells (Fig. 7c, yellow outline) and monocytes (Fig. 7c, orange outline) but not CD34+ cells (Fig. 7c, purple outline). The cell surface distribution of U5 snRNP200 on normal human immune cell populations from the bone marrow of six unaffected adult individuals is shown in Extended Data Fig. 3a. This expression pattern of U5 snRNP200 was conserved in mice, in which U5 snRNP200 was present across all bone marrow and spleen B cell subsets but absent on T cells and HSPC populations (Extended Data Fig. 3b–e). Evaluation of cell surface U5 snRNP200 expression on adult human tissues (including skeletal muscle cells, Kupffer cells, dermal fibroblasts, metabolically active hepatic cells, intestinal epithelial cells, pulmonary endothelial cells, renal proximal tubule epithelial cells and lung fibroblasts) revealed a clear absence of cell surface U5 snRNP200 (Extended Data Fig. 3f).
Following multimodal cell type identification of malignant populations by CITE-seq, AML cells were subsequently analyzed for differential gene expression profiles based on U5 snRNP200 surface expression. In comparing cell surface U5 snRNP200-high and -low AML cells (top and bottom 10% surface ADT expression, respectively), U5 snRNP200-high AML cells were characterized by significant enrichment of pathways responding to and mediating the inflammatory response (Fig. 7d). Interestingly, this prominently included upregulation of IFITM2 and IFITM3 (encoding interferon-induced transmembrane proteins 2 and 3) in U5 snRNP200-high AML cells (Fig. 7e). These data are potentially consistent with a prior report of U5 snRNP200 in the inflammatory response to viral RNA infections through activation of interferon-stimulated genes via the transcription factor complex ISGF3 (ref. 35). These results were further supported by mapping the AML blast cell compartment, which illustrated the presence of distinct proteogenomic subsets (Fig. 7f), consistent with a previous similar analysis of AML blast populations31. Application of a colorimetric ADT scale filtered to demonstrate the highest U5 snRNP200-surface expressing cells (top 10%) to this map revealed expression of surface U5 snRNP200 on the monocyte-like AML subset (Fig. 7g, left) and validated the corresponding upregulation of IFITM2 and IFITM3 gene expression on the same U5 snRNP200-high AML cells (Fig. 7g). Finally, unbiased proteogenomics via CITE-seq confirmed strong correlation of cell surface CD32 (r = 0.6183783, P < 2.2 × 10¹⁶) and CD33 (r = 0.3262483, P < 2.2 × 10¹⁶) with U5 snRNP200 among AML blasts with the highest (top 10%) U5 snRNP200 expression (Fig. 7g).
In vivo efficacy of anti-U5 snRNP200 antibodies in AML modelsThe presence of U5 snRNP200 on the surface of AML cells and not on normal HSPCs highlights U5 snRNP200 as an attractive therapeutic target in AML. To investigate the anti-leukemic effects of U5 snRNP200 antibodies in syngeneic immunocompetent AML models, we first assessed surface U5 snRNP200 expression in murine models of AML and control wild-type C57/B6 mice. While we observed consistent U5 snRNP200 surface expression on B220+ B lymphocytes (Fig.
留言 (0)