
記住我
Cirrhosis is an indolent progressive disease that accounts for more than 50,000 deaths each year in the United States (1–3). Most liver disease–related mortality occurs in patients who have decompensation of their disease, a prognosis worse than many common cancers (4). Although interventions to slow disease progression and prevent decompensation exist, diagnosis of cirrhosis in its early stages is difficult due to the inherently asymptomatic nature of the disease. In fact, it is likely that most cases of cirrhosis remain undiagnosed, with a large discrepancy between rates of clinically recognized cirrhosis and the prevalence of cirrhosis determined in large population-based autopsy studies (2,3,5).
Most methods of diagnosing compensated liver disease require a clinical suspicion for disease and patient-directed confirmatory testing such as elastography or biopsy. Unfortunately, these methods are not feasible for disease screening in the general population. Currently available methods for detecting early compensated cirrhosis rely on laboratory scores that have a low positive predictive value (6–8). Furthermore, after liver transplantation, platelets may remain low and may alter the accuracy of laboratory-based scores for recurrent cirrhosis. Thus, while laboratory scores are widely used, additional methods of remote diagnosis are critical to improving early recognition and preventative care.
Computed tomography (CT) scans are a ubiquitous diagnostic tool used throughout the healthcare system. These scans are performed for a variety of reasons, often capturing the liver either intentionally or incidentally. While liver morphology can suggest underlying fibrosis on dedicated CT protocols with an expert review, the overall diagnostic accuracy in general CT imaging remains poor (9,10). This is largely because most CT scans are not specifically protocoled to look at the hepatic parenchyma or may be noncontrasted studies. Because radiologist review of each scan is not feasible, given the sheer volume of studies, an automated method to evaluate the morphology of the liver may aid in the early detection of cirrhosis.
Recent advances in artificial intelligence–based methods have allowed for enhanced evaluation of image data using convolutional neural nets (CNNs). CNNs, analogous to the visual cortex, have allowed for automated analysis of an array of imaging data ranging from histology slides to radiology studies. For instance, CNN-based evaluation of liver biopsy slides can be trained to reliably recognize features of steatohepatitis (11). Other studies have shown promise in CNNs to classify hepatocellular carcinoma (12). Our group recently showed that this can be extended to radiologic findings in liver disease by automating CNN-extracted measures of muscle mass from CT images and correlating this with patient prognosis (13,14). Thus, the objective of this study was to determine whether a machine learning model can automate detection of cirrhosis from CT images to diagnose cirrhosis.
MATERIALS AND METHODS Cohort characteristicsWe used a cohort of patients aged 16 years and older with liver biopsy within 6 months of a CT scan between January 2004 and 2012 for any cause (15) within the Analytic Morphomics database. Clinical data were retrospectively abstracted including laboratory values that were within 6 months of the CT scan. All cirrhosis diagnoses were confirmed through biopsy. For patients who had more than 1 laboratory value, the one closest to the index CT scan was assessed. Both contrast and noncontrast studies were used. In multiphase studies, the phase with the most slices that contained the entire liver was selected. Before the analysis, all the scans were reviewed by a research assistant for quality assurance blinded to the clinical data. Scans were removed from the study if the superior or inferior sections of the liver were cut off from the scan or if there were significant image quality issues visualized, i.e., pixel spacing issues or significant artifacts.
Automated liver segmentationTo develop our automated liver segmentation tool, we used 2 CNN models: 3D U-net followed by Google's DeepLab v3+ (16,17). We trained our model using 1,590 scans within the Analytic Morphomics database where the ground truth masks of the fully segmented liver volumes were produced using an iterative process of manual segmentation followed by quality check by multiple trained research assistants and hepatologist (G.L.S.) (16). Both contrast and noncontrast studies were used and excluded the studies from the cohort described earlier.
To use the U-net model, the Digital Imaging and Communications in Medicine volumes are transformed into an isotropic volume (1 mm pixel spacing and processed in fragments of 44 × 44 × 44 voxel patches). While the model accurately captures most aspects of the volume, it generally failed to segment the tortuous regions of the liver. The DeepLab v3+model using Xception was then run on all slices of the volume estimated by the U-net model's output (17). The final mask is postprocessed using smoothing techniques and saved as a 3D mesh using faces and vertices. The fully segmented liver volume was then used to predict the pixel coordinates of the main portal vein bifurcation point using the You Only Look Once v4 object detection network (18).
Liver morphomics measurementsMultiple automated predictors were derived from the automated liver including volume, cross-sectional area, and density-based measurements. We also created measures that were surrogates for caudate lobe hypertrophy and right lobe atrophy by measuring the distance from the main portal vein to the edges of the right and left lobe of the liver (15). In addition, we modified the previously reported liver surface nodularity measurements, which have been shown to predict cirrhosis and likelihood of liver decompensation (19–21) with a new measurement, organ surface nodularity liver. Instead of manually drawing the liver edge slice by slice, we created an automated method that captures the characteristics of the anterior superior 3D boundaries of the liver. A Gaussian smoothed surface was fitted over the original points of this grid. Using equally spaced grid points along this surface, we measured the orthogonal distance between each smoothed and original surface normal to calculate an aggregate mean, median, minimum, maximum, and quartile difference. An example of a 3D reconstruction (A) and cross-sectional image (B) of a representative patient is shown. We also included other measurements that include eccentricity of the liver (Figure 1).
 Figure 1.:
 Representative examples of liver morphomics measurements. Example of a 3D reconstruction (a) and cross-sectional image (b) of a representative patient is shown. We also included other measurements that include eccentricity of the liver (c).
Model building and statisticsWe used gradient boosting decision trees to develop multivariate prediction models. Gradient boosting algorithms use an ensemble of decision trees usually outperforming random forest models by leveraging multiple weak learners to form a much more accurate final model. Hyperparameters, such as maximum tree depth, subsample percentage, and minimum child weight, were optimized through 5-fold cross-validation. Branch directions for missing values are learned during training allowing for missing data handling within the algorithm. The decision tree framework we use allows us to deal with missing data directly without reproduction. We evaluated model performance using the area under the receiver operating curve (AUC). The DeLong test was used to compare multiple correlated receiver operating characteristic curves resulting from different models (22). Analysis was conducted using R 4.0.0 with packages including rpart, Hmisc, and pROC, xgboost.
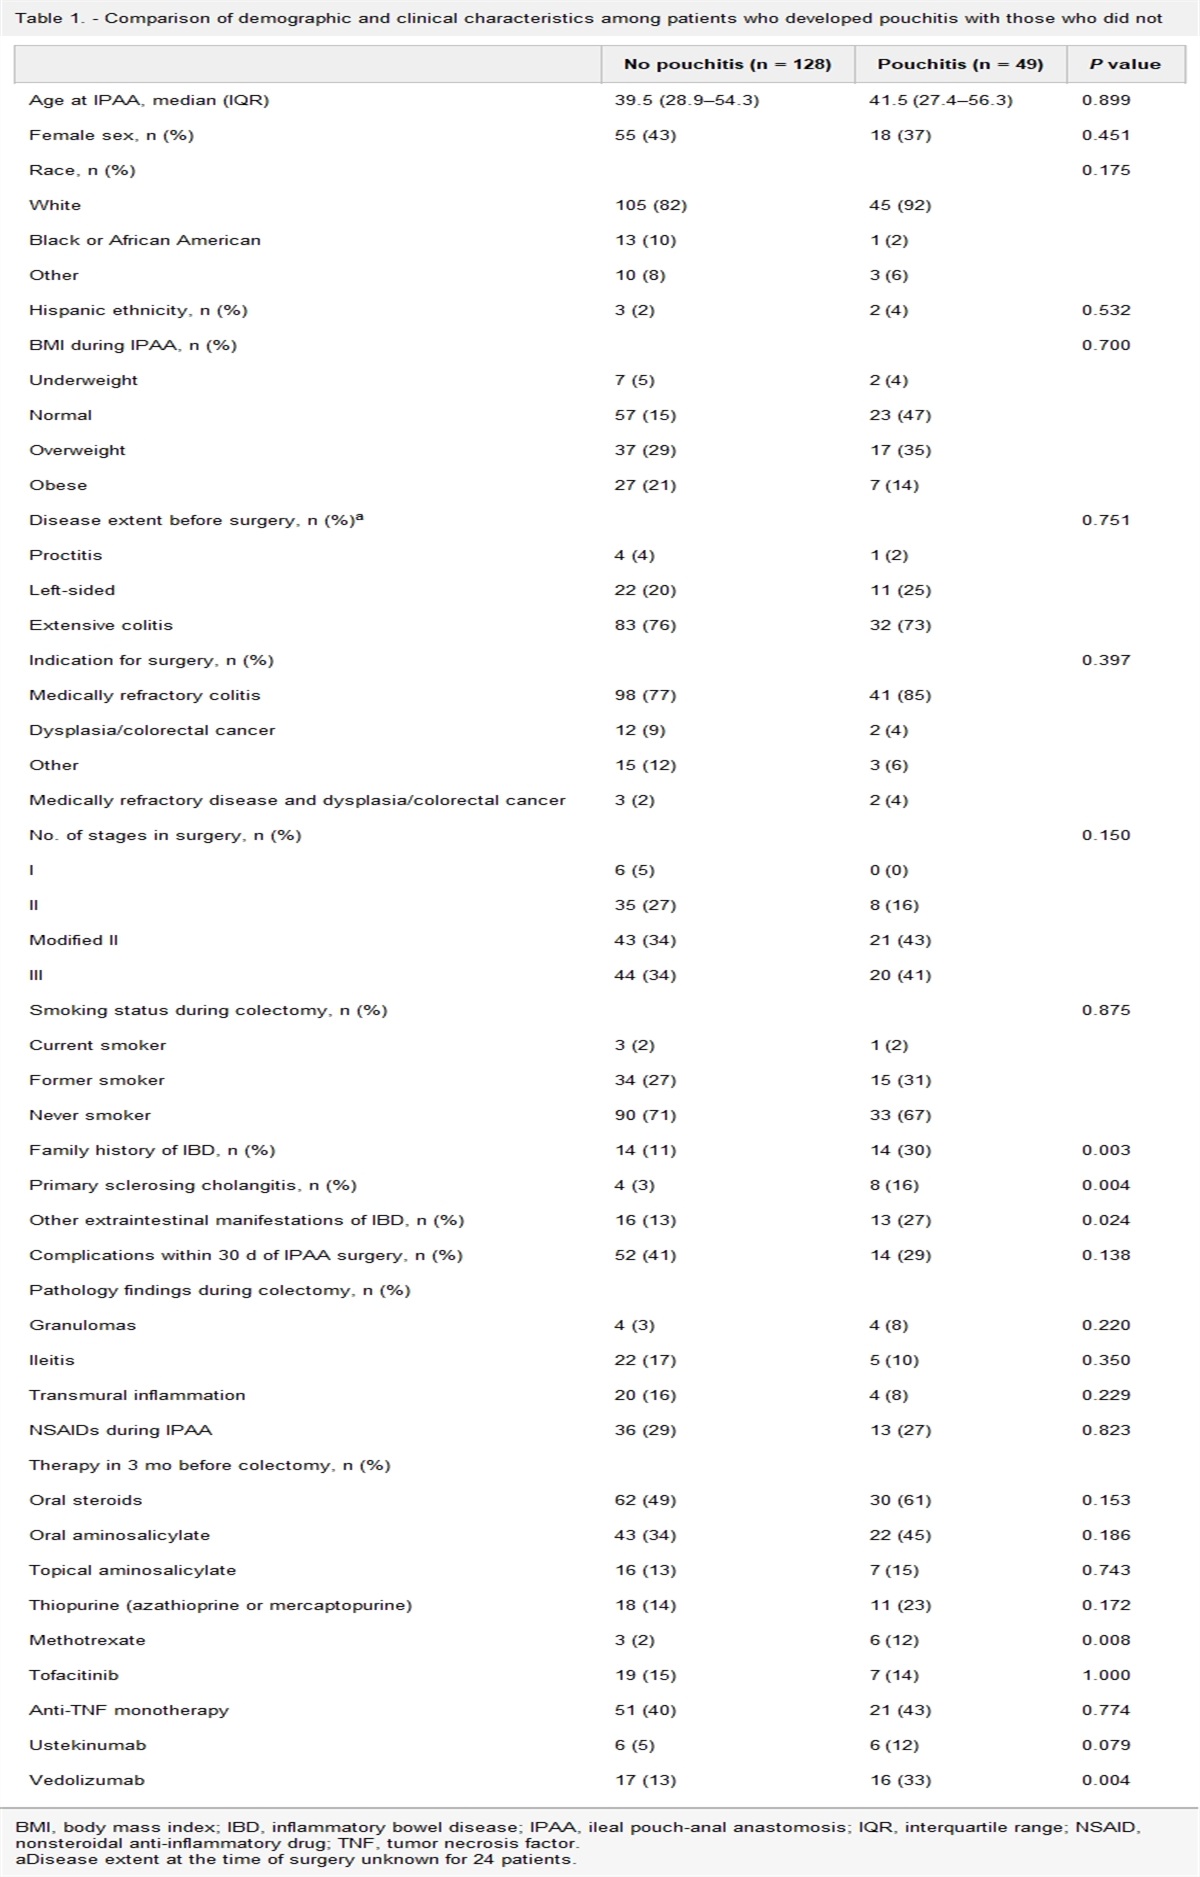
RESULTS Cohort characteristicsOne hundred patients with cirrhosis and 257 patients without cirrhosis were included in the initial cohort. Of them, 96/100 patients with cirrhosis and 255/257 patients without cirrhosis were included for analyses after exclusion because of quality of CT image yielding a total of 351 patients. Only 23 noncontrast scans were used, with the remaining containing evidence of intravascular contrast administration. Patient characteristics are summarized in Table 1. Patients with cirrhosis were similar in age, sex, and cause of chronic liver disease compared with the noncirrhotic cohort. Overall, 72 patients had a history of liver transplant, and 5 of them were cirrhotic. The mean model for end stage liver disease score was significantly higher in the cirrhotic group compared with that in those without cirrhosis (10.9 vs 7.6, P < 0.001). Within the cohort, 45 patients had a history of ascites, and 19 had a history of hepatic encephalopathy. All laboratory measures and laboratory-based scores, except for ALT, were significantly different between cirrhotic and noncirrhotic groups.
Table 1. - Description of the cohort Variable Patients with cirrhosis (n = 96)ALT, alanine transferase; AST, aspartate aminotransferase; APRI, AST to platelet ratio; FIB, fibrosis; HCV, hepatitis C; INR, International Normalized Ratio; IQR, interquartile range; MASLD, metabolic dysfunction associated steatotic liver disease; MELD, model for endstage liver disease.
Area under the receiving operating characteristics (AUROC) values for the full cohort and the nontransplant subset are summarized in Table 2. Fibrosis (FIB)-4 alone resulted in an AUROC of 0.76. This was similar to the predictive ability using Morphomics alone (AUROC 0.71, P = 0.2). Combining Morphomics + laboratory model resulted in boosted performance (AUROC 0.84) compared with Morphomics or FIB-4 alone (P < 0.001). This effect was maintained with the addition of demographics to the model (AUROC 0.85), but this was not significantly better than Morphomics + laboratory model (P = 0.54) (Figure 2).
Table 2. - Prediction of cirrhosis using laboratory model with and without automated liver morphomics Model Full cohort Nontransplant AUROC P value AUROC P value FIB-4 0.76 (0.70–0.81) Reference 0.82 (0.76–0.87) Ref Liver morphomics 0.71 (0.65–0.77) 0.2 0.76 (0.70–0.82) 0.11 Liver morphomics with laboratory model 0.84 (0.80–0.89) <0.001 0.87 (0.82–0.92) <0.05 Liver morphomics with laboratory model and demographics 0.85 (0.81–0.90) <0.001 0.85 (0.80–0.90) 0.2AUROC, area under the receiving operating characteristics; FIB, fibrosis.
When patients with a history of liver transplant were removed, performance seemed to increase for all models; however, the comparative jump in this sensitivity analysis was not uniform. Notably, there was an increase in the AUROC of FIB-4 to 0.82. Accordingly, while the Morphomics + laboratory model still outperformed either FIB-4 or Morphomics, the margin was smaller (P < 0.05), and the addition of demographics to this model showed no difference compared with Morphomics or FIB-4 alone. The Morphomics + laboratory model was similar in performance to the most advanced model, which included Morphomics + laboratory model with demographics and features from the labeled portal vein.
Feature importance across all modelsUnivariate assessment supported the importance of many laboratory scores (Figure 3). The top-ranked features included FIB-4, Lok score, total bilirubin, platelet count, AST: ALT ratio, and transplant status. However, significant importance was also given to several image parameters generated by the computer (Table 3). These included the following: (i) the median CT attenuation of the liver in Hounsfield units, (ii) the “eccentricity” of the liver shape as quantified by the ratio of the horizontal length to vertical length, and (iii) a measure of “nodularity” as defined by total smoothed perimeter divided by the total original perimeter.
 Figure 2.:
 Comparisons of receiver operating curves. Morphomics alone performed similarly to FIB-4 (AUROC 0.71 vs 0.76, P = 0.2). The combination of morphomics and FIB-4 was superior to either model alone (AUROC 0.84, P < 0.001). A similar amount of superiority was found when demographics were included in the full model (AUROC 0.85).
Table 3. - Liver Morphomic feature definitions found in Figure 2 Feature name Definition decile4_3dauto Density in hounsfield units (HU) within the liver volume was binned into 11 groups, ranging from −250 to 300 HU and decile 4 is the fourth group pvlenratio_3dauto Ratio between portal vein tip length and cross-sectional length (y axis) of the liver osnldistratio_3dauto Total smoothed perimeter divided by the total original perimeter using the 3D liver surface nodularity (OSNL) surface path equivdiameter_3dauto Equivalent diameter (in mm) derived from the surface area of the liver osnl3dquartile2_3dauto Liver surface nodularity 2D measures were binned into 4 groups. This is the aggregate measure (in mm) from the second group. xlenmm_3dauto Length of the x axis of the liver (in mm) eccentricity3d_3dauto Major axis length divided by minor axis of the liver volume pv2tiplen_mm_3dauto Distance from portal vein bifurcation point to the leftmost edge of the visualized liver (in mm) Figure 3.: Top 15 most important features in the automated model. The most important features in the full model included both conventional expected markers (FIB-4, transplant = yes, platelet, AST/ALT ratio, bilirubin, AST) and liver morphomics features (Table 3).DISCUSSION
Early detection of cirrhosis would allow for intervention in the natural history of liver disease. In this study, we developed and validated an automated system that assesses CT images of the liver, processes its morphometric characteristics, and predicts whether the patient has cirrhosis. This process is unique in that it performs well without the need for human labeling of landmarks, is measured against the gold standard of liver biopsy, and can be performed on incidentally captured slices of the liver rather than dedicated imaging. This allows for a more robust and fully automated imaging processing pipeline that is easier to integrate into existing data structures containing CT images for cirrhosis screening.
Of importance, our algorithm used any CT performed for any clinical indication. The input images were not dedicated liver CT examinations, and 23 were not performed with contrast. Despite this, our algorithms showed equivalent or higher test characteristics compared with studies conducted using dedicated liver imaging. For instance, one study that used CNN-based fibrosis rating of CT scans required a dedicated CT liver and radiologist windowing and cropping before training (23). This study was able to achieve an AUC of approximately 0.7 in predicting fibrosis stage. By contrast, our model was able to achieve an AUC of 0.84–0.87, which is similar to studies using CNN to evaluate gadoxetic acid–enhanced hepatobiliary phase liver MR images, a much more involved and dedicated imaging modality (24).
There may be several explanations for the boost in performance of our algorithm compared with that observed in past studies. First, we were able to normalize measures by automatic segmentation. In addition, we chose the clinically important binary classification task that sought to determine whether cirrhosis was present or not. This simplification increased our power to detect changes and improved classification. Last, our algorithm incorporates multiple imaging findings of cirrhosis at once. These important features, chosen by the model as the most relevant for prediction, seem to have clinical correlations and pathophysiology. For instance, one important feature was the median attenuation in HU of the liver. This mirrors the known paradoxical loss of fat in advanced liver disease, which changes the organ's attenuation on CT (25). Another important feature was the “eccentricity” of the liver shape, which quantified the ratio of horizontal and vertical dimensions. Prior measures of shape include caudate lobe hypertrophy, and caudate right lobe ratio were moderately predictive of cirrhosis in early ultrasound studies, and correlates have been demonstrated in cross sectional modalities as well (26,27). The next most important feature was a measure of “nodularity,” obtained by comparing the actual vs smoothed perimeter of the liver. This is frequently noted on visual inspection of the liver during laparotomy or autopsy, and in other radiologic studies, it has been shown to predict advanced fibrosis in patients with hepatitis C (28). Thus, in contrast to the “black box” criticism of typical CNN architectures, our approach simultaneously combines other solid radiologic indicators to better predict cirrhosis on nondedicated CT. Furthermore, whereas there may be concern that the algorithm may be picking up staples or other posttransplant changes, we can verify based on the feature importances that the CNN is actually looking at the liver morphology. This is an important verification to prevent CNNs from gathering insight using artifactual data (29).
Our study also demonstrates that incorporating automated imaging data was superior to common laboratory measures of cirrhosis. Specifically, we examined the performance of the most commonly used laboratory fibrosis scores: FIB-4, APRI, and lok score (30–32). While these scores were initially lauded for their ability to predict advanced fibrosis and cirrhosis in patients with HCV, their utility has somewhat waned in more recent years with the rising prevalence of non-HCV liver diseases such as alcohol, hepatitis B, and metabolic dysfunction associated steatotic liver disease, similar to our cohort that contained only 126 (36%) patients with HCV (33–35). Thus, in the modern healthcare setting where CT imaging is common, adding these features to existing laboratory data may be an option to augment the accuracy of triaging patients toward hepatology care (36,37).
Within our cohort, nearly one-third of patients were posttransplant patients, a unique population in which determination of recurrent cirrhosis is both important and difficult. The true burden of this is unknown because, while cited rates of recurrent cirrhosis can be as high as 1 in 3, these studies were largely performed on patients with HCV before the DAA era (38). Posttransplant, platelet count may not recover, and while serologic markers may be useful, their accuracy may be impaired (38). Similarly, we found that all prognostic models had worse performance when transplant patients were included. Nevertheless, we demonstrate the superiority of Morphomics + laboratory model compared with the FIB-4 model alone in predicting histologic cirrhosis. While it is true that posttransplant patients will be closely followed up by hepatology and may have access to elastography or other modalities, we chose to include this group of patients because they often interface with the medical system and undergo CT scanning and may still benefit.
This study has several strengths and limitations. First, our retrospective cohort was selected based on the presence of cross-sectional imaging and liver biopsy. This may enrich the cohort with patients who are more likely to have liver disease compared with the general population and thus inflate our positive predictive value; however, a robust gold standard was necessary to train and validate our algorithm rather than a surrogate marker. Second, our cohort included posttransplant patients who may not be generalizable to the average patient; however, our algorithm performed well when these patients were removed, and predicting recurrent fibrosis after transplant is a difficult and important problem in itself. Third, machine learning models may suffer from overfitting. We combatted this with robust internal validation using 5-fold cross-validation.
In summary, early detection of cirrhosis is an important goal in forestalling the devastating complications of decompensated cirrhosis. We developed a machine learning algorithm that can process CT images that incidentally imaged liver parenchyma, analyze characteristics of the liver, incorporate laboratory data, and predict histologic fibrosis status. The results of this study have important implications in health systems that are increasingly digitally integrated and often contain both laboratory data and an untapped wealth of imaging data that could be used to improve triage of patients to specialty care. Future work will center on determining the impact of such algorithms on prospective patient groups to externally validate the findings and assess the benefit to health systems.
CONFLICTS OF INTERESTGuarantor of the article: Grace L. Su, MD.
Specific author contributions: B.E., P.Z., G.L.S.: conception of project. N.R.M., B.E., G.L.S.: literature review. B.E., P.Z., G.L.S.: contribution of materials/methods. B.E., P.Z., G.L.S.: data analysis. B.E., N.R.M., P.Z., G.L.S.: interpretation of results. B.E., N.R.M., P.Z., G.L.S.: write up and revision of the manuscript. All authors have been involved in revising the content of this work in preparation for manuscript submission and agree to be accountable for all aspects of the work. All authors have given final approval for submission. Institutional Review Board approval was obtained.
Financial support: N.R.M.: ACG Junior Faculty Development Award. G.L.S.: NIH-U01 CA230669; VA-HSRD HX-002548.P.Z.: NIH-U01 CA230669; VA-HSRD HX-002548.
Potential competing interests: G.L.S. has equity interest in Applied Morphomics, Inc.
Study Highlights
WHAT IS KNOWN ✓ The presence of cirrhosis can be detected qualitatively from computed tomography. ✓ Artificial intelligence techniques can be used to automate detection of features in images. WHAT IS NEW HERE ✓ Artificial intelligence can be used to automatically extract features and measures from computed tomography scans. ✓ Automatically extracted features from computed tomography improves the prediction of cirrhosis without a liver biopsy. REFERENCES 1. Tapper EB, Parikh ND. Mortality due to cirrhosis and liver cancer in the United States, 1999-2016: Observational study. BMJ 2018;362:k2817. 2. Scaglione S, Kliethermes S, Cao G, et al. The epidemiology of cirrhosis in the United States. J Clin Gastroenterol 2015;49(8):690–6. 3. Sepanlou SG, Safiri S, Bisignano C, et al. The global, regional, and national burden of cirrhosis by cause in 195 countries and territories, 1990–2017: A systematic analysis for the global burden of disease study 2017. Lancet Gastroenterol Hepatol 2020;5(3):245–66. 4. Chung WJW, Jo C, Chung WJW, et al. Liver cirrhosis and cancer: Comparison of mortality. Hepatol Int 2018;12(3):269–76. 5. Graudal N, Leth P, Mårbjerg L, et al. Characteristics of cirrhosis undiagnosed during life: A comparative analysis of 73 undiagnosed cases and 149 diagnosed cases of cirrhosis, detected in 4929 consecutive autopsies. J Intern Med 1991;230(2):165–71. 6. Zhao Y, Thurairajah PH, Kumar R, et al. Novel non-invasive score to predict cirrhosis in the era of hepatitis C elimination: A population study of ex-substance users in Singapore. Hepatobiliary Pancreat Dis Int 2019;18(2):143–8. 7. Patel YA, Gifford EJ, Glass LM, et al. Identifying nonalcoholic fatty liver disease advanced fibrosis in the veterans health administration. Dig Dis Sci 2018;63(9):2259–66. 8. Li Q, Ren X, Lu C, et al. Evaluation of APRI and FIB-4 for noninvasive assessment of significant fibrosis and cirrhosis in HBeAg-negative CHB patients with ALT ≤ 2 ULN: A retrospective cohort study. Medicine (Baltimore). 2017;96(12):e6336. 9. Kudo M, Zheng RQ, Kim SR, et al. Diagnostic accuracy of imaging for liver cirrhosis compared to histologically proven liver cirrhosis. Intervirology 2008;51(Suppl 1):17–26. 10. Yeom SK, Lee CH, Cha SH, et al. Prediction of liver cirrhosis, using diagnostic imaging tools. World J Hepatol 2015;7(17):2069. 11. Taylor-Weiner A, Pokkalla H, Han L, et al. A machine learning approach enables quantitative measurement of liver histology and disease monitoring in NASH. Hepatology 2021;74(1):133–47. 12. Yasaka K, Akai H, Abe O, et al. Deep learning with convolutional neural network for differentiation of liver masses at dynamic contrast-enhanced CT: A preliminary study. Radiology 2018;286(3):887–96. 13. Zou WY, Enchakalody BE, Zhang P, et al. Automated measurements of body composition in abdominal CT scans using artificial intelligence can predict mortality in patients with cirrhosis. Hepatol Commun 2021;5(11):1901–10. 14. Wang NC, Zhang P, Tapper EB, et al. Automated measurements of muscle mass using deep learning can predict clinical outcomes in patients with liver disease. Am J Gastroenterol 2020;115(8):1210–6. 15. Krishnamurthy V, Zhang P, Ethiraj S, et al. Use of analytic morphomics of liver, spleen, and body composition to identify patients at risk for cirrhosis. Clin Gastroenterol Hepatol 2015;13(2):360–8.e5. 16. Çiçek Ö, Abdulkadir A, Lienkamp SS, et al. 3D U-net: Learning dense volumetric segmentation from sparse annotation. Lect Notes Comput Sci2016;9901 LNCS:424–32. 17. Chen L-C, Papandreou G, Schroff F, Adam H. Rethinking atrous convolution for semantic image segmentation. 2017 (doi: 10.48550/arXiv.1706.05587). 18. Bochkovskiy A, Wang C-Y, Liao H-YM YOLOv4: Optimal speed and accuracy of object detection. 2020 (doi: 10.48550/arxiv.2004.10934). 19. Smith AD, Branch CR, Zand K, et al. Liver surface nodularity quantification from routine CT images as a biomarker for detection and evaluation of cirrhosis. Radiology 2016;280(3):771–81. 20. Pickhardt PJ, Malecki K, Kloke J, et al. Accuracy of liver surface nodularity quantification on MDCT as a noninvasive biomarker for staging hepatic fibrosis. AJR Am J Roentgenol 2016;207:1194–9. 21. Smith AD, Zand KA, Florez E, et al. Liver surface nodularity score allows Prediction of cirrhosis Decompensation and Death. Radiology 2017;283(3):711–22. 22. DeLong ER, DeLong DM, Clarke-Pearson DL. Comparing the areas under two or more correlated receiver operating characteristic curves: A nonparametric approach. Biometrics 1988;44(3):837–45. 23. Yasaka K, Akai H, Kunimatsu A, et al. Deep learning for staging liver fibrosis on CT: A pilot study. Eur Radiol 2018;28(11):4578–85. 24. Yasaka K, Akai H, Kunimatsu A, et al. Liver fibrosis: Deep convolutional neural network for staging by using gadoxetic acid-enhanced hepatobiliary phase MR Images. Radiology 2018;287(1):146–55. 25. Van der Poorten D, Samer CF, Ramezani-Moghadam M, et al. Hepatic fat loss in advanced nonalcoholic steatohepatitis: Are alterations in serum adiponectin the cause? Hepatology 2013;57(6):2180–8. 26. Harbin WP, Robert NJ, Ferrucci JT. Diagnosis of cirrhosis based on regional changes in hepatic morphology: A radiological and pathological analysis. Radiology 1980;135:273–83. 27. Hori M, Okada T, Higashiura K, et al. Quantitative imaging: Quantification of liver shape on CT using the statistical shape model to evaluate hepatic fibrosis. Acad Radiol 2015;22(3):303–9. 28. Elkassem AA, Allen BC, Lirette ST, et al. Multiinstitutional evaluation of the liver surface nodularity score on CT for staging liver fibrosis and predicting liver-related events in patients with hepatitis C. AJR Am J Roentgenol 2022;218(5):833–45. 29. Majeed T, Rashid R, Ali D, et al. Issues associated with deploying CNN transfer learning to detect COVID-19 from chest X-rays. Phys Eng Sci Med 2020;43(4):1289–303. 30. Vallet-Pichard A, Mallet V, Nalpas B, et al. FIB-4: An inexpensive and accurate marker of fibrosis in HCV infection. Comparison with liver biopsy and FibroTest. Hepatology 2007;46(1):32–6. 31. Lok ASF, Ghany MG, Goodman ZD, et al. Predicting cirrhosis in patients with hepatitis C based on standard laboratory tests: Results of the HALT-C cohort. Hepatology 2005;42(2):282–92. 32. Wai CT, Greenson JK, Fontana RJ, et al. A simple noninvasive index can predict both significant fibrosis and cirrhosis in patients with chronic hepatitis C. Hepatology 2003;38(2):518–26. 33. Younes R, Caviglia GP, Govaere O, et al. Long-term outcomes and predictive ability of non-invasive scoring systems in patients with non-alcoholic fatty liver disease. J Hepatol 2021;75(4):786–94. 34. McPherson S, Hardy T, Dufour JF, et al. Age as a confounding factor for the accurate non-invasive diagnosis of advanced NAFLD fibrosis. Am J Gastroenterol 2017;112(5):740–51. 35. Kim WR, Berg T, Asselah T, et al. Evaluation of APRI and FIB-4 scoring systems for non-invasive assessment of hepatic fibrosis in chronic hepatitis B patients. J Hepatol 2016;64(4):773–80. 36. Srivastava A, Gailer R, Tanwar S, et al. Prospective evaluation of a primary care referral pathway for patients with non-alcoholic fatty liver disease. J Hepatol 2019;71(2):371–8. 37. Prevedello LM, Erdal BS, Ryu JL, et al. Automated critical test findings identification and online notification system using artificial intelligence in imaging. Radiology 2017;285(3):923–31. 38. Bhat M, Tazari M, Sebastiani G. Performance of transient elastography and serum fibrosis biomarkers for non-invasive evaluation of recurrent fibrosis after liver transplantation: A meta-analysis. PLoS One 2017;12(9):e0185192.
留言 (0)