
Remember me


Barrett's esophagus (BE) is a premalignant condition associated with an increased risk of esophageal adenocarcinoma (EAC). Currently, endoscopic biopsy sampling of the BE segment according to the Seattle protocol is the most widely accepted method of surveillance (1). Unfortunately, this protocol is fraught with limitations, such as low physician adherence, low sensitivity, and a high degree of sampling error (2–4). In addition, interpretation of mucosal biopsies by pathologists suffers from a significant degree of interobserver variability, which has not shown significant improvement over the past several decades (5–7).
Wide-area transepithelial sampling with 3-dimensional computer-assisted analysis, termed WATS3D (CDx Diagnostics, Suffern, NY), is a recently developed technique that has been shown to greatly increase the detection rate of dysplasia and intestinal metaplasia when used as an adjunct to forceps biopsies (FBs) in patients with BE (8). Prior studies have shown increased adjunctive yields of dysplasia, which range from 50% to 400%, in both low-risk (community) and high-risk (academic) populations (9–13). However, none of these studies performed interobserver analyses. In brief, the WATS3D procedure uses a brush that consists of long abrasive bristles designed to acquire broader, deeper, and more intact mucosal tissue samples compared with conventional cytology brushes. One slide is then scanned by an extended depth of field imaging system designed to capture 3-dimensional tissue fragments, followed by evaluation by a high-speed neural network specifically designed to recognize dysplasia (see methods for more details). Due to the recent increase in use of WATS3D in patients with BE, there is a growing demand among clinicians to have WATS3D specimens evaluated by nonindustry pathologists located either near or at the center of hospital/endoscopy practice rather than at the CDx central laboratory. The purpose of this study was to evaluate the interobserver agreement (IOA) in diagnosing BE-associated dysplasia in WATS3D specimens among GI pathologists previously inexperienced with this technology.
METHODS Study casesAll 60 WATS3D study cases with BE were retrieved from the central pathology database at CDx Diagnostics laboratory. Of the 60 cases, 20 were diagnosed as non–dysplastic BE (NDBE), 20 as low-grade dysplasia (LGD), and 20 as high-grade dysplasia (HGD) or esophageal adenocarcinoma (EAC) by CDx in-house pathologists. All cases had the diagnosis confirmed in routine FB obtained during the same endoscopic procedure. Another separate set of cases, with the same distribution of diagnoses as the study set, were used for training (see further). All diagnoses from both the sets were confirmed by one of the current study pathologists (R.D.O.), who served as the index pathologist and did not participate further in the IOA part of the study. Of the 20 cases with NDBE, 11 had reactive changes that approached LGD and thus might be interpreted as indefinite for dysplasia (Indef) by some pathologists. All patients had BE, defined as ≥1 cm of esophageal columnar mucosa with intestinal metaplasia, and had undergone routine white light surveillance endoscopy at their respective medical centers. At endoscopy, each patient had FB obtained according to the Seattle protocol that was performed either before or after the WATS3D sampling, according to prior published methods (14). WATS3D specimens were transported to CDx laboratories where they were diagnosed originally by 1 in-house pathologist and confirmed by a second in-house pathologist, before acceptance into this study. The study was submitted to WCG IRB and received an exempt status determination.
WATS3D procedure and tissue processingDuring endoscopy, 2 brushes are used for every 5 cm of esophageal columnar mucosa, either before or after FB. Once brushing is complete, 1 brush is placed into a vial containing formalin for subsequent paraffin embedding and hematoxylin and eosin (H&E) staining (formalin-fixed paraffin-embedded cell block) and the other is either placed into a vial containing methanol for subsequent liquid cytology slide preparation or is fixed to the slide for papanicolaou staining. Specimens are then sent to the CDx Diagnostics central laboratory in Suffern, NY, for tissue processing, staining, and computer analysis, as per previously published methods. The smear slide is then evaluated by a neural network software program that identifies and ranks approximately 200 of the most suspicious, atypical cell aggregates in order of severity (from worst to least). It then presents those images to the pathologist on a high-resolution color video monitor for review during microscopic analysis of the glass slides. The 2 slides (1 H&E-stained cell block and 1 smear) are finally reviewed by a pathologist, addressing special attention to the annotated areas on the synthesized 3D images. For the purposes of this study, only images that were ranked as most severe by the computer algorithm were provided to the study pathologists for review (Figure 1).
 Figure 1.:
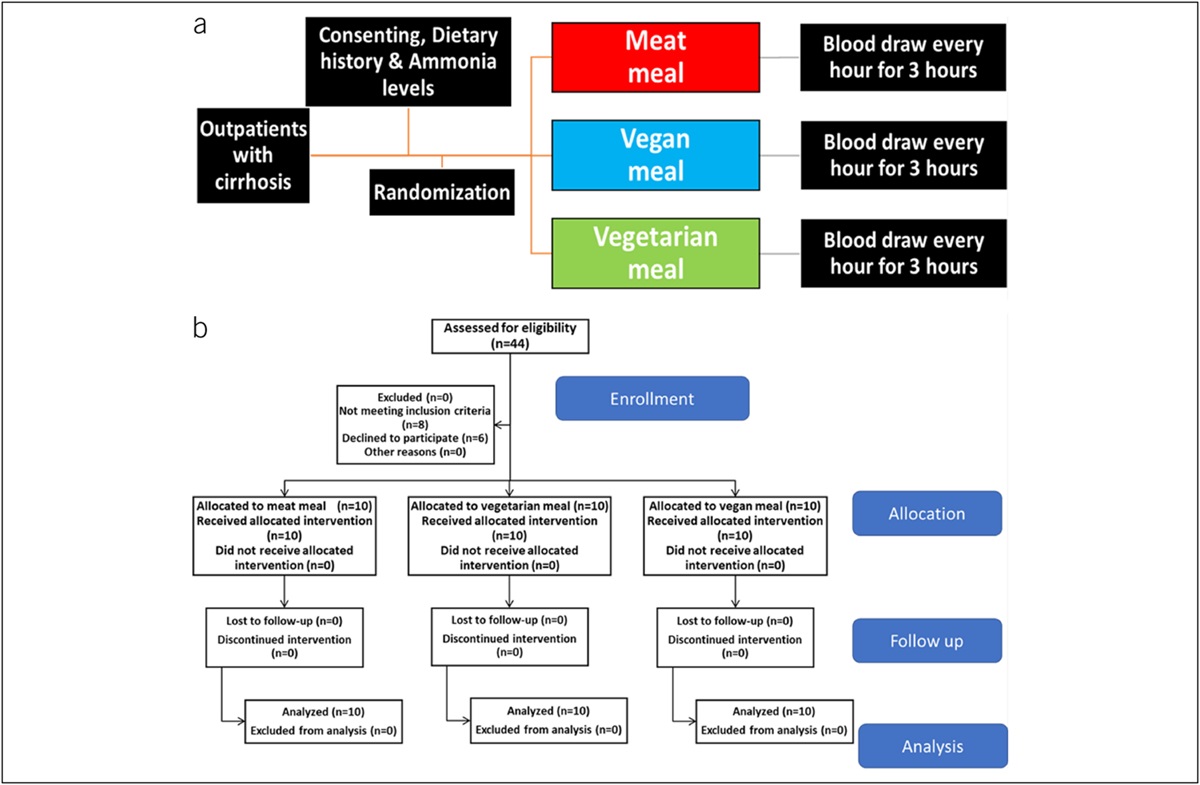
 Nondysplastic Barrett's esophagus hematoxylin and eosin–stained formalin-fixed paraffin-embedded cell block (a) and smear (b). (a) The cell block shows columnar epithelium with goblet cells without atypia but with mild regenerative changes. The nuclei are small in size, basally oriented with focal mild stratification, and lack pleomorphism and loss of polarity. (b) The smear shows a tight compact cluster of cells arranged in a honeycomb pattern. The cells are small in size, have distinct visible cell borders, and lack overlapping and crowding. There are no mitoses. Low-grade dysplasia appearance in cell block (c) and smear (d). The cell block shows strips of epithelium with mild to moderately enlarged, elongated, and hyperchromatic nuclei but intact cell polarity. The smear sample shows a compact cluster of cells with enlarged mildly irregular and overlapping hyperchromatic nuclei, containing clumped chromatin and occasional prominent nucleoli. The cells at the edge of the cluster show focal discohesion. High-grade dysplasia appearance in cell block (e) and smear (f). The cell block shows epithelial cells with markedly enlarged, irregularly shaped hyperchromatic nuclei with pleomorphism, loss of polarity, and a gland-in-gland pattern. The smear shows a collection of similarly abnormal appearing cells as the cell block. The cells are markedly enlarged, highly irregular in contour, pleomorphic, hyperchromatic, and show considerable overlapping. There is more prominent discohesion of cells at the edge of the cluster and a few single cells in the background.
Pathology training and evaluationTraining was performed in person, with the use of the glass slides at a multiheaded microscope over a 4-hour period. One month later, a second 1-hour training session was performed with the use of digitally scanned images. Previously published criteria for grading dysplasia were used for the evaluation of the H&E-stained cell block slides (5). The criteria for BE and dysplasia on the smear slide are listed in Supplementary Table 1 (see Supplementary Digital Content 1, https://links.lww.com/CTG/B45). After training was completed, the 5 study pathologists were then asked to evaluate the 60 digitally scanned study cases, where each case consisted of 1 scanned cell block slide and 1 scanned smear slide (120 images in total), on a computer located at each of their own institutions. For this analysis, the study pathologists received 1 digitalized, representative focus of tissue from each of the H&E-stained cell block and smear slides from each case. The digital images were capable of full zooming, at all standard levels of magnification. For each case, the study pathologists were asked to provide a primary diagnosis for the formalin-fixed paraffin-embedded cell block slide and separately for the smear slide and a primary final diagnosis for the case (which represented the higher of the diagnostic grades of either the cell block or smear images) by use of a digital scoring sheet. The pathologists were also asked to annotate whether they established their diagnosis with complete (100% confidence), high (90%–99% confidence), or a low (51%–89% confidence) level of confidence. All cases in the study were deidentified and assigned a number. The pathologists were blinded to the patients' FB diagnosis and the original WATS3D diagnosis, and the endoscopic findings, but were aware that each patient had BE and that the tissue samples were obtained from esophageal columnar mucosa.
StatisticsIOA was measured using Fleiss' kappa, which measures categorical ratings across multiple raters. The primary analysis was for the following categories: NDBE, IND, LGD, HGD, and the combined HGD and EAC category. Statistics were then calculated for each category. Analyses were then stratified by cell block vs smear. A P value <0.05 was considered statistically significant.
RESULTS Kappa values and percent agreement among pathologistsThe IOA results are summarized in Table 1. When all diagnoses from all 5 pathologists were considered in the analysis, the overall kappa value for the worst overall case diagnosis was 0.93 (0.87–0.98). Results from interpretation of the H&E-stained cell blocks vs the smear cytology samples were 0.93 and 0.97, respectively. Overall, all 5 pathologists agreed on the patient's final diagnosis (highest grade of dysplasia in either the cell block or smear sample per case) in 88.3% of cases. After combining HGD with EAC as a single diagnostic category, the kappa value increased to 0.95. Finally, the kappa value for distinguishing NDBE vs neoplasia of any grade (LGD, HGD, or EAC) was 0.95, and in this analysis, all 5 pathologists agreed in 95% of cases. In general, the kappa values and percentage of pathologists who agreed with each other was equal, or even better, in the smear specimens compared with those in the cell block specimens. Finally, the kappa value related to a diagnosis of any neoplasia (LGD/HGD/EAC) was 0.95, and in this analysis, all 5 study pathologists agreed in 100% of cases in which FB diagnosed dysplasia.
Table 1. - Summary of WATS3D interobserver study data and agreement levels among study pathologists Diagnosis Kappa values Pathologist agreement (%) Overall (per patient) Cell block Smear 5/5 4/5 3/5 Overalla 0.93 (0.87–0.98) 0.93 0.97 88 98 100 NDBE 0.94 (0.86–1.02) 0.94 1.00 80 100 100 LGD 0.90 (0.82–0.98) 0.91 0.95 95 100 100 HGD 0.88 (0.80–0.96) 0.90 0.89 72 89 100 HGD/EAC 0.95 (0.87–1.03) 0.96 0.95 91 95 100 Any neoplasiab 0.95 (0.87–1.03) 0.94 1.00 100 100 100EAC, esophageal adenocarcinoma; HGD, high-grade dysplasia; LGD, low-grade dysplasia; NDBE, nondysplastic Barrett's epithelium; WATS3D, wide-area transepithelial sampling with 3-dimensional computer-assisted analysis.
aIndefinite for dysplasia diagnosis was used by 1 pathologist only in 2 patient cell blocks.
bAny neoplasia 5 LGD, HGD, or EAC.
As mentioned earlier, 11 study cases of NDBE had reactive changes that some pathologists may consider indef. However, overall, only 1 pathologist used this diagnosis, and this was in the cell block specimen only of 2 separate cases. Therefore, meaningful kappa statistics could not be performed for this diagnostic category. Similarly, because EAC comprised only 3 of the 20 cases with HGD or EAC, kappa values could not be performed in that diagnostic category alone.
Confidence levels of study pathologistsTable 2 summarizes the levels of confidence with which the study pathologists established their diagnoses. For instance, final (combined) diagnoses were established with complete (100%) confidence in 91% of instances overall and in 91% of both cell block and smear specimens when these were analyzed separately. A subanalysis of each of the individual diagnostic categories is also summarized in Table 2. There were no statistically significant differences in the percentage of cases made with complete confidence between the cell block and smear samples either overall (for all diagnoses) or for any of the individual diagnostic categories specifically.
Table 2. - Summary of confidence levels of the study pathologists Diagnosis Confidence level of diagnosis among study pathologists (%) Complete High Low Cell block Smear Combined Cell block Smear Combined Cell block Smear Combined All diagnoses 91 91 91 7 8 8 2 1 1 NDBE 96 100 98 4 1 3 0 0 0 LGD 88 89 88 11 8 10 1 3 2 HGD 100 70 85 0 31 15 0 0 0 HGD/EAC 100 100 100 0 0 0 0 0 0EAC, esophageal adenocarcinoma; HGD, high-grade dysplasia; LGD, low-grade dysplasia; NDBE, nondysplastic Barrett's epithelium.
Table 3 summarizes the data regarding levels of concordance between the study pathologists diagnoses and the final clinical diagnoses rendered by CDx pathologists. Overall, using the majority diagnoses obtained by 3 or more pathologists, there was a 98.3% concordance rate for all diagnoses, but this value was 100% for neoplasia diagnoses specifically. The breakdown of each of the study pathologists diagnoses in comparison with the CDx/FB diagnosis is also summarized in Table 3. There were no significant differences noted between the cell block and smear specimens nor between any of the individual pathologists when compared with each other, in terms of concordance with the CDx/FB diagnoses.
Table 3. - Concordance of the study pathologists' final patient diagnoses with the forceps biopsy diagnosesa Study pathologist All diagnoses (% concordance) Neoplasia vs no neoplasia (% concordance) Pathologist 1 95.0 98.3 Pathologist 2 98.3 100.0 Pathologist 3 100.0 100.0 Pathologist 4 98.3 100.0 Pathologist 5 93.3 96.7 Most pathologists (≥3) 98.3 100.0aPatient's final diagnosis represents the highest grade of neoplasia rendered in either the cell block or smear sample in each patient.
The main purpose of this study was to evaluate IOA and diagnostic accuracy in interpretation of NDBE and BE-associated neoplasia in WATS3D specimens among nonindustry GI pathologists without any prior WATS3D experience or training. Our results showed an excellent level of IOA and a high level of diagnostic accuracy in interpretation of WATS3D specimens. The overall kappa value among the 5 study pathologists was 0.93 (kappa = 0.93 and 0.97 for evaluation of the cell block and smear specimens, respectively). All study pathologists agreed on the worst overall case diagnosis in 88.3% of cases. There were no significant differences noted in kappa values in interpretation of the cell block vs smear specimens or in any of the individual diagnostic categories when the latter were evaluated separately. Furthermore, agreement was perfect (100%) regarding diagnosing neoplasia (either LGD, HGD, or EAC), which is important clinically. Overall, diagnoses were made with complete confidence in 91% of diagnostic instances. Based on these results, we conclude that GI pathologists, without any prior experience in interpretation of WATS3D specimens, can undergo a short training session in this technology and then diagnose these specimens with a very high level of accuracy and reproducibility.
This is the first study to evaluate diagnostic reproducibility regarding WATS3D specimens among pathologists without any prior experience with this technology. We chose to conduct this study with GI pathologists, not community pathologists, because WATS3D is likely to be first used, in-house, in academic centers, which typically have GI pathologists before more widespread use among nonacademic facilities. However, 1 prior interobserver study by Vennalaganti et al in 2015, reported the results of an evaluation of 149 WATS3D specimens (109 without dysplasia, 40 with either LGD or HGD/EAC) among 4 industry pathologists employed by CDx Diagnostics. In that study, the overall kappa value for all 3 diagnoses was 0.86, and was 0.95 for HGD/EAC, 0.74 for IND/LGD, and 0.88 for NDBE, which provides more confirmatory evidence that diagnostic agreement for WATS3D specimens is substantially higher than FB (14).
Regarding FB specifically, there have been multiple studies over the previous 4 decades that have evaluated IOA among both GI and non-GI (community) pathologists. In general, prior studies on overall IOA in FB highlight kappa values that range from 0.25 to 0.50, which are far lower than in the prior WATS3D study and in our current study (6,15,16). In fact, among community pathologists, data have shown that there is a tendency to overdiagnose dysplasia, and this is usually because the highest degree of variability is related to distinction of regenerative atypia from LGD (15,17–19). In our study, 11 of the 20 study cases with NDBE were selected specifically because they had regenerative changes that could be interpreted as Indef by some pathologists. Use of this term is highly variable and dependent on several factors. This entity has no diagnostic criteria but is a term most often used for cases with BE that show regenerative changes (often due to inflammation) that overlap with LGD. In this study, overall, only 1 pathologist used this diagnosis, and this was in 2 separate cases. Given the low use of the Indef diagnosis, we were unable to perform meaningful kappa statistics on this specific diagnostic entity. Nevertheless, the low rate of use of this diagnosis in this study may be indicative of an overall high level of confidence by the study pathologists when evaluating WATS3D specimens (see further). These results should be confirmed in future studies and in ones that specifically involve pathologists without expertise in GI pathology.
The distinction of HGD from EAC is another area prone to significant diagnostic variability. For instance, in one FB study, the kappa value among GI pathologists for distinguishing HGD from EAC was only 0.30, which is considered poor (7). In our study, we chose to combine the diagnoses of HGD and EAC in the analyses primarily because the clinical management of these 2 diagnoses are similar. Therefore, pathologic distinction between the 2 entities is not clinically relevant. The kappa value for combined HGD/EAC in this study was 0.95 overall, with 90% agreement among all 5 pathologists for the final (combined cell block and smear sample) diagnosis. Another area fraught with difficulty is determining when an EAC has progressed from intramucosal to submucosally invasive carcinoma. As with FB, submucosal tissue is not normally present in WATS3D specimens. Thus, distinguishing dysplastic glands that are situated within, or even below, the duplicated muscularis mucosae in BE from true submucosal invasion is difficult with both types of specimens (20). Regardless, determination of depth of invasion in patients with BE is best accomplished with an endoscopic mucosal resection specimen (16,21).
Our study also showed that pathologists established their diagnoses with a complete level of confidence in most of the cases (91%). Furthermore, confidence levels (and degree of IOA) were also very high not only for overall final case (combined cell block and smear sample) diagnoses but also for interpretation of the cell block and smear specimens separately. This result is somewhat surprising given that although the GI pathologists involved in this study have extensive experience with H&E-stained cell block specimens, none had any prior experience with interpretation of smear specimens. These results provide confidence that pathologists without any prior BE-related cytology experience can perform WATS3D diagnostics at a high level of accuracy after completion of only a short training session. One potential reason for high IOA with WATS3D specimens, when compared with traditional FB, relates to the enhanced 3D-like images that the computer technology provides on the smear sample. This adds considerably more detail to the cytologic characteristics of the cells, which assists pathologists in visualizing cell-to-cell relationships.
Our study has several design characteristics, limitations, and strengths that should be noted. One design characteristic is that discrete digital cellular foci were selected for each case and subsequently used in the pathologic assessment of dysplasia. Images of cellular foci of interest used for this study were selected from the AI enhanced files of each case, and provided to the study pathologists with full magnification capability, as normally occurs in routine practice at CDx Diagnostics. Although some prior interobserver studies of FB have used digitized methodology, this is different from most traditional interobserver studies of FB where pathologists typically evaluate whole slides where no specific cellular areas are marked for evaluation. Providing pathologists with unmarked whole slides may result in increased variability in the recognition and interpretation of the cellular foci of interest, which may account for higher interobserver variability results. However, one of the benefits of WATS3D technology is, in fact, the application of artificial intelligence (neural network), which is designed specifically to provide pathologists a digital view of atypical cellular foci that are ranked from high to low according to ones most likely to represent dysplasia. Thus, it is likely that this was also a factor in the low degree of IOV that we found in this study.
A limitation of this study was that the FBs obtained from the same endoscopic procedure as the WATS3D specimens were not available for reconfirmation of the diagnosis before entry into this study. However, our purpose in this study was to use the FB as the comparative gold standard diagnosis for the WATS3D cases, and not to perform an independent IOA analysis of those specimens, which have been performed and published multiple times in the past.
Strengths of this study included the ability of all study pathologists to evaluate the same aggregate of cells (as mentioned earlier), which limits the problem inherent to many IOA studies by not being able to ensure that each pathologist reviews the same focus of interest. Moreover, the study pathologists were provided with, trained, and instructed to use specific diagnostic criteria in their pathology evaluations. This exercise likely limited diagnostic variability in interpretation of dysplasia due to inherent differences in knowledge and experience, among pathologists regarding the criteria of dysplasia in BE.
In summary, we have demonstrated a very high level of diagnostic reproducibility, accuracy, and confidence among GI pathologists in interpretation of WATS3D brush samples, which suggests that this technology may be performed successfully outside the industry setting directly at the institution of gastroenterology practice by GI pathologists. Further studies of this kind should be conducted among pathologists without particular expertise in GI pathology to determine whether WATS3D can be used successfully in community practices that do not have GI pathologists as well.
CONFLICTS OF INTERESTGuarantor of the article: Robert D. Odze, MD.
Specific author contributions: D.T.P., J.R.G., G.L., J.T.L., M.E.R., and R.D.O.: planning and/or conducting the study. D.T.P., J.R.G., G.L., J.T.L., M.E.R., M.E.S., and R.D.O.: collecting and/or interpreting data. D.T.P., J.R.G., G.L., J.T.L., M.E.R., M.E.S., and R.D.O.: drafting and reviewing the manuscript. All authors have approved the final draft submitted.
Financial support: Some of the authors had previously worked as consultants for the company, before performance of this study, but this particular study was performed without commercial support.
Potential competing interests: None to report.
IRB: This study was submitted to WCG IRB and received an exempt status determination.
Study Highlights
WHAT IS KNOWN ✓ Wide-area transepithelial sampling with 3-dimensional computer-assisted analysis increases the detection rate of dysplasia (and intestinal metaplasia) when used as an adjunct to forceps biopsies in patients with Barrett's esophagus. WHAT IS NEW HERE ✓ The interobserver agreement for diagnosing Barrett's esophagus–related neoplasia among 5 gastrointestinal pathologists was excellent (overall kappa = 0.93). ✓ The agreement level was perfect (100%) regarding detection of neoplasia (either low-grade dysplasia, high-grade dysplasia, or esophageal adenocarcinoma), and diagnoses were made with complete confidence in 91% of diagnostic instances. REFERENCES 1. Shaheen NJ, Falk GW, Iyer PG, et al. Diagnosis and management of Barrett's esophagus: An updated ACG guideline. Am J Gastroenterol 2022;117(4):559–87. 2. Abrams JA, Kapel RC, Lindberg GM, et al. Adherence to biopsy guidelines for Barrett's esophagus surveillance in the community setting in the United States. Clin Gastroenterol Hepatol 2009;7(7):736–42; quiz 10. 3. Wani S, Williams JL, Komanduri S, et al. Endoscopists systematically undersample patients with long-segment Barrett's esophagus: An analysis of biopsy sampling practices from a quality improvement registry. Gastrointest Endosc 2019;90(5):732–41 e3. 4. Visrodia K, Singh S, Krishnamoorthi R, et al. Magnitude of missed esophageal adenocarcinoma after Barrett's esophagus diagnosis: A systematic review and meta-analysis. Gastroenterology 2016;150(3):599–607.e7; quiz e14–5. 5. Reid BJ, Haggitt RC, Rubin CE, et al. Observer variation in the diagnosis of dysplasia in Barrett's esophagus. Hum Pathol 1988;19(2):166–78. 6. Montgomery E, Bronner MP, Goldblum JR, et al. Reproducibility of the diagnosis of dysplasia in Barrett esophagus: A reaffirmation. Hum Pathol 2001;32(4):368–78. 7. Downs-Kelly E, Mendelin JE, Bennett AE, et al. Poor interobserver agreement in the distinction of high-grade dysplasia and adenocarcinoma in pretreatment Barrett's esophagus biopsies. Am J Gastroenterol 2008;103(9):2333–40; quiz 41. 8. Vennalaganti PR, Kaul V, Wang KK, et al. Increased detection of Barrett's esophagus-associated neoplasia using wide-area trans-epithelial sampling: A multicenter, prospective, randomized trial. Gastrointest Endosc 2018;87(2):348–55. 9. Anandasabapathy S, Sontag S, Graham DY, et al. Computer-assisted brush-biopsy analysis for the detection of dysplasia in a high-risk Barrett's esophagus surveillance population. Dig Dis Sci 2011;56(3):761–6. 10. Codipilly DC, Krishna Chandar A, Wang KK, et al. Wide-area transepithelial sampling for dysplasia detection in Barrett's esophagus: A systematic review and meta-analysis. Gastrointest Endosc 2022;95(1):51–9 e7. 11. Smith MS, Ikonomi E, Bhuta R, et al. Wide-area transepithelial sampling with computer-assisted 3-dimensional analysis (WATS) markedly improves detection of esophageal dysplasia and Barrett's esophagus: Analysis from a prospective multicenter community-based study. Dis Esophagus 2019;32(3):doy099. 12. Shaheen NJ, Smith MS, Odze RD. Progression of Barrett's esophagus, crypt dysplasia, and low-grade dysplasia diagnosed by wide-area transepithelial sampling with 3-dimensional computer-assisted analysis: A retrospective analysis. Gastrointest Endosc 2022;95(3):410–8.e1. 13. Trindade AJ, Odze RD, Smith MS, et al. Benefit of adjunctive wide-area transepithelial sampling with 3-dimensional computer-assisted analysis plus forceps biopsy based on Barrett's esophagus segment length. Gastrointest Endosc 2023;98(3):316–25. 14. Vennalaganti PR, Naag Kanakadandi V, Gross SA, et al. Inter-observer agreement among pathologists using wide-area transepithelial sampling with computer-assisted analysis in patients with Barrett's esophagus. Am J Gastroenterol 2015;110(9):1257–60. 15. Kerkhof M, van Dekken H, Steyerberg EW, et al. Grading of dysplasia in Barrett's oesophagus: Substantial interobserver variation between general and gastrointestinal pathologists. Histopathology 2007;50(7):920–7. 16. Wani S, Mathur SC, Curvers WL, et al. Greater interobserver agreement by endoscopic mucosal resection than biopsy samples in Barrett's dysplasia. Clin Gastroenterol Hepatol 2010;8(9):783–8. 17. Curvers WL, ten Kate FJ, Krishnadath KK, et al. Low-grade dysplasia in Barrett's esophagus: Overdiagnosed and underestimated. Am J Gastroenterol 2010;105(7):1523–30. 18. Duits LC, Phoa KN, Curvers WL, et al. Barrett's oesophagus patients with low-grade dysplasia can be accurately risk-stratified after histological review by an expert pathology panel. Gut 2015;64(5):700–6. 19. Sangle NA, Taylor SL, Emond MJ, et al. Overdiagnosis of high-grade dysplasia in Barrett's esophagus: A multicenter, international study. Mod Pathol 2015;28(6):758–65. 20. Abraham SC, Krasinskas AM, Correa AM, et al. Duplication of the muscularis mucosae in Barrett esophagus: An underrecognized feature and its implication for staging of adenocarcinoma. Am J Surg Pathol 2007;31(11):1719–25. 21. Mino-Kenudson M, Hull MJ, Brown I, et al. EMR for Barrett's esophagus-related superficial neoplasms offers better diagnostic reproducibility than mucosal biopsy. Gastrointest Endosc 2007;66(4):660–6; quiz 767, 9.
Comments (0)