
Remember me


A Flangeless Esser PET Phantom (model PET/FL/P) with hollow sphere sets ECT/HS/SET6 and ECT/MI-HS/SET4 (Data Spectrum Corporation, Hillsborough, NC, USA) was used in this study. The phantom has an inner diameter of 20 cm, and eight hollow spheres with inner diameter of 25, 15, 12, 10, 7.9, 6.2, 5.0 and 4.0 mm (volumes of 8.0, 2.0, 1.0, 0.5, 0.25, 0.125, 0.063 and 0.031 ml, respectively) were mounted in the phantom sorted according to diameter, with the six largest spheres in the circular positions 57.2 mm off centre, the second smallest spheres 28.6 mm off centre, and the smallest in the centre. No further inserts were used, see layout in Fig. 1. The spheres and the background compartment were filled with 17.2 kBq/ml and 1.6 kBq/ml 18F-FDG (ratio = 10.5), respectively.
Fig. 1
Example delineations of VOIs for each sphere shown on the CT (a) and PET image (b) in all three directions
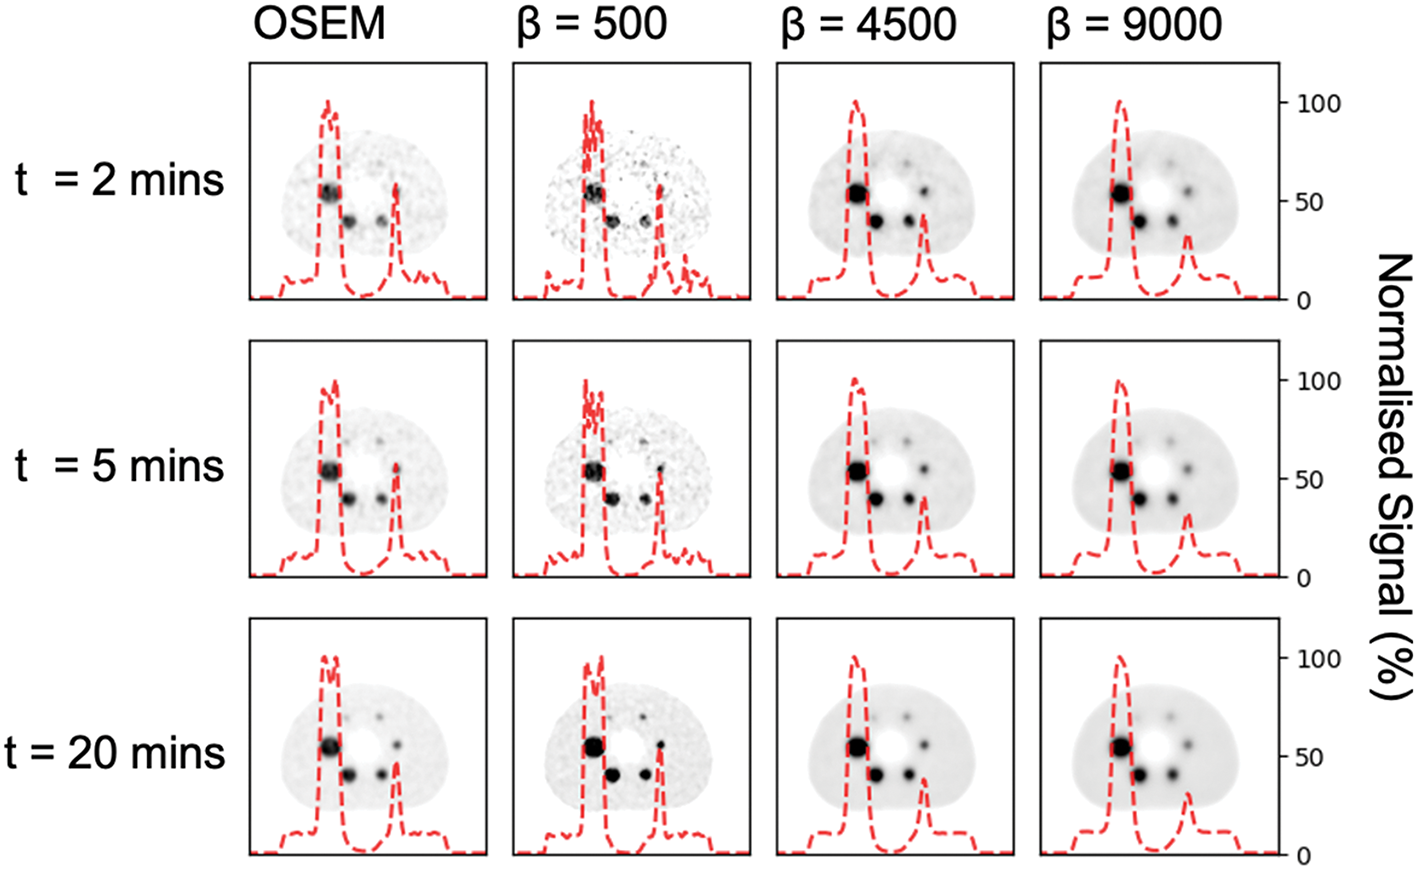
Data acquisition and reconstructionsThe phantom was placed on the table, centred using the positioning lasers and scanned on a Discovery MI PET/CT system (GE Healthcare, Milwaukee, WI, USA) with a 20-cm axial field of view (FOV) for 25 min. Data were collected in listmode and images were reconstructed to five 5-min frames (entire scan), five 2-min frames (from the first 10 min of the scan), five 1-min frames (from the first 5 min of the scan), five 30-s frames (from the first 2.5 min of the scan) and five 10-s frames (from the first 50 s of the scan). Images were reconstructed using Q.Clear (including time of flight (TOF), PSF modelling, a 256 × 256x71 matrix and 30 cm FOV) with 18 different β-factors ranging from 100 to 3500 and corrected for radioactive decay, dead time, attenuation, random coincidences and scattered radiation. In total, 450 reconstructed image series were reconstructed. A low-dose CT (120 kVp, 35 mA, revolution time 1, pitch 0.98, and slice thickness 0.625) was acquired for attenuation correction and structural information.
Data analysisPET images were analysed using an in-house MATLAB-based program. First, a spherical volume of interest (VOI) matching the volume of each sphere was automatically placed around each sphere as identified on the CT data. Second, to correct for potential misalignment between the PET and CT data, the individual VOIs were allowed to be moved a maximum of one voxel in any direction to ensure inclusion of the maximum activity concentration in the PET data (Fig. 1). The latter procedure was applied individually for all 450 image series.
To quantify the measured activity concentration in the spheres, the average of the 10% hottest voxels in each VOI was calculated, from here on referred to as the peak value. The peak measurement was used to avoid the uncertainty of using the max SUV in each sphere, as the max value if affected by noise in the image. The recovery coefficient (RC), the coefficient of variation (CVRC) and the root-mean-square error (RMSERC) were computed to assess the impact of different β-factors on the bias, variability and accuracy of quantitation. RC (Eq. 1) of each sphere states how accurately the known concentration is reproduced in a specific volume and is calculated as the ratio of the measured and known concentration [14]:
where \(\overline_}\) is the average of the measured activity concentrations in the five reconstructed repetitions, and cknown is the known activity concentration in the hot sphere. An RC of 1 suggests perfect reproduction of the activity concentration.
CVRC (Eq. 2) gives an estimate of the variability for the calculated RC for the different spheres and β-factors. CVRC is the ratio of the standard deviation of the RC (\(_)\) for the five reconstructed repetitions and the mean of the RC defined as [15]
$$_\left(\%\right)=100 x\frac_ }$$
(2)
RMSERC (Eq. 3) provides the difference between predicted and actual values and was calculated to investigate which β-factor would give the most accurate prediction for all sphere sizes and acquisition times. The RMSERC calculations include the RC value for each individual reconstructed repetition and all acquisition times. To investigate the potential impact due to sphere sizes, the RMSERC was calculated for all spheres combined, the four largest spheres (10–25 mm) and for the four smallest spheres (4.0–7.9 mm). An RMSERC of 0 would suggest a perfect result. A favourable β-factor range was defined based on the lowest RMSERC + 10%.
$$_=\sqrt_^_/_)}^}}$$
(3)
Clinical evaluationData from two male patients with recurrent glioblastoma included in an ongoing clinical trial (NCT03951142) at Oslo University Hospital was retrospectively selected for this study. The clinical trial is approved by the National Research Ethics Committee and the Institutional Review Board (2017/1875), and all patients gave their written and informed consent.
Data acquisition and image reconstruction18F-PSMA-1007 (2.5 MBq/kg) was injected intravenously and the patients were scanned dynamically for 30 min on a Discovery MI PET/CT system (GE Healthcare, Milwaukee, WI, USA). The PET data were reconstructed using Q.Clear (TOF, PSF modelling, a 256 × 256 matrix, 30 cm FOV) with a range of β-factors chosen from the results of the phantom study. Images were dynamically reconstructed into 32 frames of variable durations (18 × 10 s, 6 × 30 s, 4 × 1 min and 4 × 5 min) and corrected for radioactive decay, dead time, attenuation, random coincidences and scattered radiation. A low-dose CT (120 kVp, 35 mA, revolution time 1, pitch 0.98, and slice thickness 0.625) was used for attenuation and scatter correction.
Pharmacokinetic analysisImage analysis was performed using PMOD 4.0 (PMOD Technologies LLC, Zurich, Switzerland). First, to correct for patient motion during scanning, a rigid matching approach between frames was applied using the average uptake during the first two minutes of the scan as the reference image. For the pharmacokinetic modelling of the data, an IDIF was extracted as a proxy for an arterial input function. The IDIF was delineated by segmenting the bilateral ICA (threshold: 50% of max signal) on the blood pool image (first minute after injection of tracer). The uptake of 18F-PSMA-1007 in tumour tissue was extracted from an automatically delineated VOI using a threshold of 50% of max signal on a summed 20–30 min post-injection image. The blood pool and tumour tissue VOIs are shown in Fig. 2 for one of the included clinical cases.
Fig. 2
Standardized uptake value (SUV) image of a representative male adult patient with recurrent glioblastoma scanned with 18F-PSMA-1007. 18F-PSMA-1007 uptake and delineated VOIs are shown for tumour tissue (white arrow in a) and blood pool (white arrow in b)
Time activity curves (TACs) were extracted for the blood and tumour VOIs, and an irreversible two-tissue compartment model was used to calculate the net influx rate Ki of the tracer in the tumour tissue as defined by Eq. 6 [16]:
$$_=\frac_ \times _}_+_}$$
(4)
where K1 [ml/ccm/min] and k2 [1/min] are the uptake and clearance rate constants, and k3 [1/min] describes the trapping. The area under the curve (AUC) for the blood TAC and the tumour TAC was calculated to investigate the impact of the chosen β-factors on the kinetic analysis. In the absence of a gold standard, changes in AUC and Ki due to different β-factors were reported as the percentage differences between the lowest and highest β-factors used.
Comments (0)