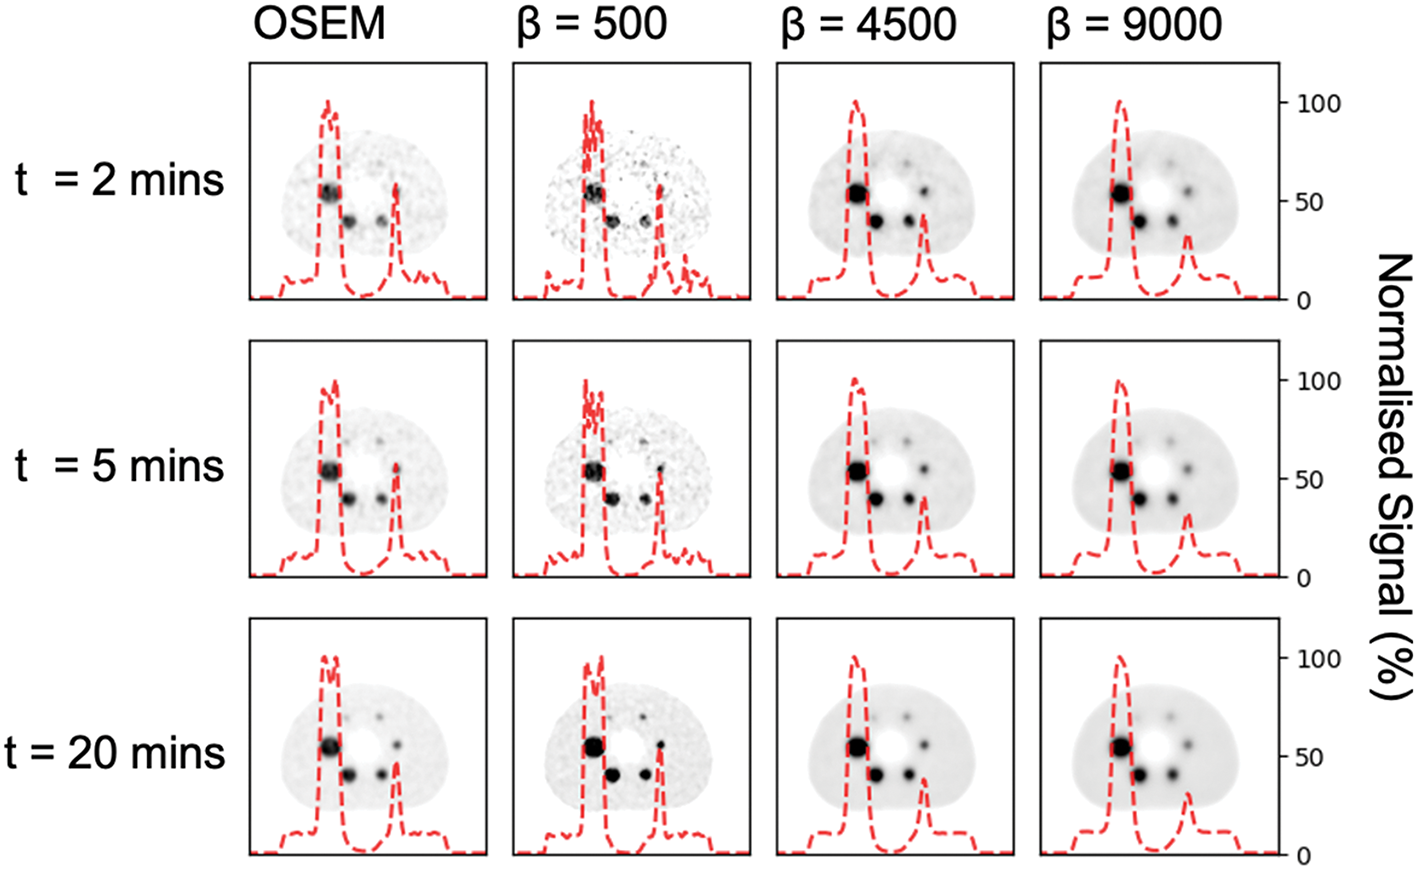
A series of 177Lu-filled phantoms measurements were taken to assess the quantification accuracy, the noise build-up and the spatial resolution for two different reconstruction algorithms: i) a conventional ordered subset expectation maximization (OSEM) and ii) a block sequential regularized expectation maximization (BSREM) [14]. Based on the results of this phantom study, the reconstruction protocols considered suitable for clinical routine were tested on a cohort of 10 patients treated with [177Lu]Lu-PSMA-I&T that underwent post-therapeutic imaging.
All phantom and patient acquisitions were performed with StarGuide™.
StarGuide™ SPECT/CT system
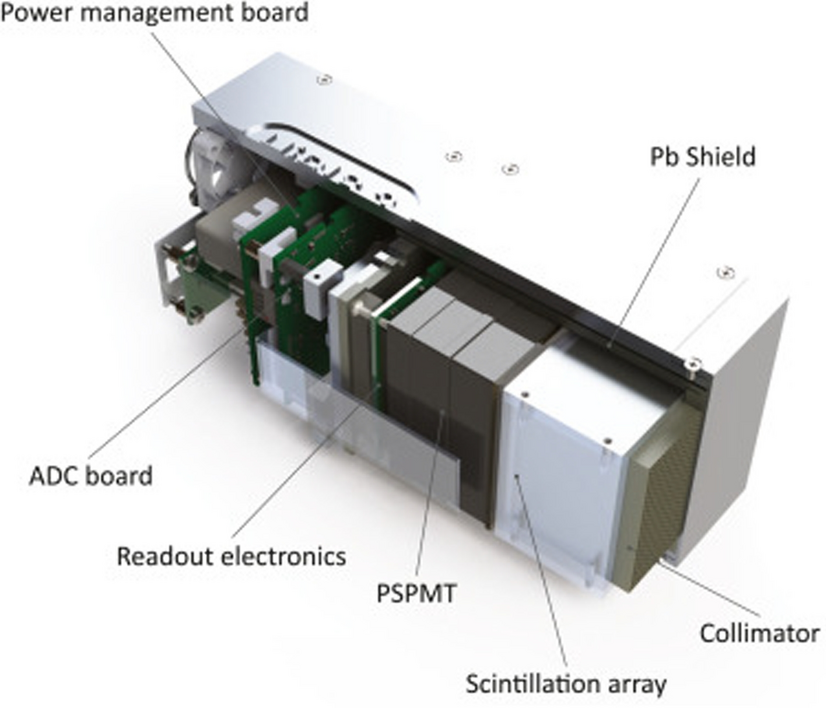
StarGuide™ is a hybrid system consisting of a CT, Optima CT540, and a ring-shaped gantry with twelve detectors. Each detector, consisting of seven CZT modules of 16 × 16 2.46 mm pixel size and 7.25 mm thickness, is independent of the others and is capable of both radial (in/out) and rotational (sweep) motion. In addition, all the detectors can simultaneously rotate with the gantry. The camera is equipped with a fixed dual-channel collimator, which enables a balance between sensitivity and resolution across low- and medium-energy isotopes. Before each acquisition, an infrared-based technology scans the contours of the patient (or phantom) to be acquired, enabling the automatic positioning of the table and detectors as closely as possible to the imaged object, maximizing the resolution.
StarGuide™ is equipped with a dedicated Web-based processing station for image reconstruction, SmartConsole. Besides the manufacturer implementation of the OSEM algorithm, referred to as GE-OSEM, SmartConsole provides a new iterative algorithm for image reconstruction, Q.Clear. Q.Clear is based on a BSREM [14] algorithm and, contrary to OSEM, allows replacing the standard maximum likelihood with a penalized likelihood objective function including a regularization term, in the form of either a relative difference prior (RDP) [15] or a median root prior (MRP) [16]. In case of RDP regularization, which was used in this study, two parameters, called beta and gamma, can be used to fine-tune the regularization. Optionally, the beta parameter can be weighted according to a sensitivity map derived by the CT-based attenuation map by turning on the tool bySens. Both algorithms incorporate non-optional resolution recovery. CT-based attenuation correction and scatter correction can be also applied. The latter is a dual energy window correction that takes into account the “tailing” effect typical of CZT-based detectors [17].
SPECT images obtained with SmartConsole are expressed in units of counts per voxel.
Phantom studyPhantom preparation
Three phantoms were prepared: i) a Flangeless Deluxe Jaszczak Phantom™ (“Jaszczak”, filling volume: 5805 mL, diameter: 20.9 cm, height: 18.6 cm), ii) a cylindrical phantom without inserts (“cylinder phantom”, filling volume: 5440 mL, diameter: 20 cm, height: 18 cm) and iii) a NEMA IEC phantom with 6 spherical inserts (“NEMA phantom”, diameters: 10, 13, 17, 22, 28, 37 mm). The Jaszczak and the cylinder phantom were filled with 541 MBq and 700 MBq of labelled 177Lu, respectively, to generate activity concentrations typically observed in images of patients treated with 177Lu-RPT. To mimic the activity concentrations found within tumours, the spherical inserts of the NEMA phantom were filled with 1.6 MBq/mL of 177Lu. After a first acquisition without activity in the background, 1.5 GBq of 177Lu was added to the background of the NEMA phantom to obtain a sphere-to-background ratio of about 10:1.
All the phantoms presented in this study were prepared with the addition of an excess of ethylenediaminetetraacetic acid (EDTA) to prevent 177Lu from sticking to the phantom walls. Nominal activities were determined using a radionuclide calibrator equipped with a VIK-202 ionization chamber (Comecer SpA). The calibration factor for 177Lu was provided by the manufacturer. Injected activities were computed taking into account the residual activity measured in the syringe used to fill the phantoms.
Image acquisition and reconstruction
Projections were acquired in continuous sweep mode with steps of 2° over 15 min. The photopeak and scatter energy windows, defined as suggested by the manufacturer, were centred at 208(± 6%) keV and 185(± 5%) keV, respectively. After the SPECT acquisition, a low-dose CT was acquired for attenuation correction (120 kV, 512 × 512 × 112 matrix, 1.0 × 1.0 × 2.5 mm3 resolution).
Data were reconstructed using SmartConsole (GE HealthCare, version 1.0.10). The impact of the regularization on the quantitative performance was studied by reconstructing images using Q.Clear without regularization, hereafter named Q.Clear, and with an RDP regularization (gamma = 1, beta = 0.005, bySens OFF), hereafter named Q.ClearRDP. Hence, each phantom was reconstructed with three algorithms: i) GE-OSEM, ii) Q.Clear and iii) Q.ClearRDP. All reconstructions included CT-based attenuation correction, scatter correction and resolution recovery. No post-filtering was applied, as suggested by the EANM dosimetry committee recommendations for dosimetry of 177Lu-labelled somatostatin receptor- and PSMA-targeting ligands [9]. To study the influence of the number of updates (i.e. the number of iterations times the number of subsets) for each algorithm (GE-OSEM, Q.Clear and Q.ClearRPD), images were reconstructed with 1 subset and several numbers of iterations between 12 and 576 (12i1s stands for 12 iterations and 1 subset). In addition, the influence of the number of subsets was investigated by fixing the number of updates and varying the partitioning into iterations and subsets. All data were reconstructed using the intrinsic voxel size of the CZT modules (2.46 mm). The matrix size was automatically determined by the system.
For comparison, all images were also reconstructed according to the protocol suggested by the manufacturer, hereafter named factory protocol, corresponding to Q.Clear 20i10s with RDP regularization (gamma = 1, beta = 0.08, bySens ON).
Image analysis
Image analysis was performed using an in-house Python code (Python version 3.10.0).
Image calibration factor
The Jaszczak phantom was used to determine an image calibration factor (ICF) to convert reconstructed counts into activity concentration. For each reconstruction, the ICF was obtained as:
$$\mathrm=\frac_}\times _}\times \mathrm\left(\frac(2)}_}\times \Delta t\right)}\left[\frac}}\right]$$
where \(C\) is the total number of counts inside a large volume of interest (VOI) drawn around the reconstructed phantom (diameter: 23 cm, height: 22 cm), \(_}\) is the acquisition duration [s], \(_}\) is the activity at the time of phantom preparation [MBq], \(\Delta t\) is the time between phantom preparation and acquisition [s] and \(_\) is the physical half-life of 177Lu [s]. The uncertainty associated with the ICF was calculated using the law of propagation of uncertainty. Assuming no uncertainty on the time measurements, the uncertainty of the ICF can be written as:
$$u(\mathrm)=\mathrm\times \sqrt\right)}^+_}\right)}_}}\right)}^}$$
The standard uncertainty of the counts was computed as the square root of the number of reconstructed counts \(C: u\left(C\right)=\sqrt\) [18]. The uncertainty associated with the activity (\(_}\)) was assumed to be 2%, based on the mean deviation between the activity measured by the 177Lu provider (ITM Isotope Technologies Munich SE) and the on-site measurement over 190 vials received from July 2021 to November 2022 [19].
Quantification accuracy
The cylinder phantom was used to assess the quantification accuracy. A large cylindrical VOI (“VOI_outside”, diameter: 22.0 cm, height: 20.0 cm, volume: 7.9 L) and a small cylindrical VOI (“VOI_inside”, diameter: 14.0 cm, height: 12.6 cm, volume: 1.9 L) were drawn around and inside the cylinder phantom, respectively. For each reconstruction, the activity in VOI_outside and the activity concentration in VOI_inside were calculated by applying the ICF corresponding to the same reconstruction protocol. The accuracy in the quantification of the activity (or activity concentration) was computed as the percentage difference between the SPECT-based (\(_}\)) and the radionuclide calibrator-based activity (or activity concentration, \(_}\)):
Image quality
The cylinder and the NEMA phantom were used to determine the noise and the spatial resolution, respectively, as a function of the reconstruction parameters. The noise was computed as coefficient of variation \(\mathrm\) (i.e. the ratio between the standard deviation and the mean) of counts in VOI_inside. The spatial resolution was calculated using a matched-filter resolution analysis based on the NEMA phantom measurement [20]. The cross section through the centre of the cylinder phantom was visually analysed to assess the noise build-up as a function of the number of updates.
Recovery coefficient
To assess the relationship between object size and measurement accuracy, the NEMA phantom was used. Firstly, the six spheres were manually delineated on each CT using MIM (MIM Software Inc., version 7.3.1). Then, each reconstructed SPECT image was resampled to CT resolution using a linear interpolation algorithm. Finally, each set of spherical VOIs was transferred to the corresponding interpolated SPECT image, and for each sphere, a recovery coefficient (RC) was computed as:
$$\mathrm=\frac_}\times \mathrm\times V}\times \frac_}\times \mathrm\left(\frac(2)}_}\times \Delta t\right)}[\%]$$
where \(\mathrm\) is the calibration factor for the corresponding reconstruction protocol [cps/MBq], \(V\) is the volume of the spherical VOI [mL] and \(_}\) is the activity concentration at the time of preparation [MBq/mL].
To visually assess the recovery of the activity concentration inside the spherical VOIs as a function of the number of updates, the cross section through the centre of the largest sphere was plotted and compared to the ideal profile (a rectangular function).
Optimal combination of iterations and subsets
Since no objective criteria are currently available for defining an optimized reconstruction protocol for quantitative 177Lu SPECT/CT, the optimal iteration–subset combination for each algorithm was defined as the one yielding a noise level equivalent to that obtained with the factory protocol, used as the reference.
Patient studyImage acquisition and reconstruction
Ten patients treated with [177Lu]Lu-PSMA-I&T (mean(± standard deviation) injected activity: 7134(± 248) MBq) who underwent SPECT/CT imaging with StarGuide™ (mean(± standard deviation) time after the injection: 18(± 1) hours) were selected. Depending on patient’s size, 4 to 5 bed positions were acquired. Acquisition parameters were defined as in the phantom experiments, except for the acquisition duration that was equal to 2.5 min for the head and legs bed positions, and 5 min for the torso bed position. Acquired projections were reconstructed using GE-OSEM, Q.Clear and Q.ClearRDP, with a number of updates optimized as explained above, and the factory protocol.
Image analysis
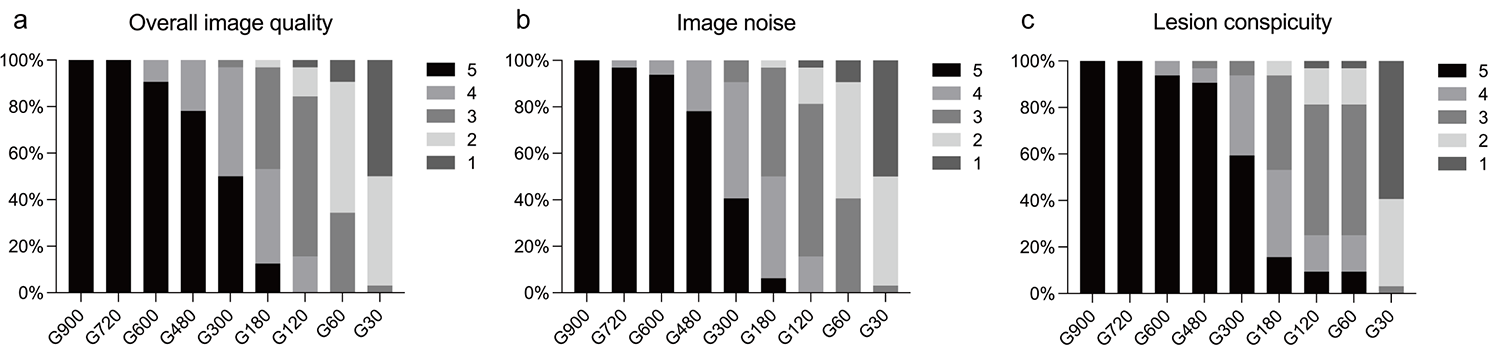
Twenty-seven tumours with a volume larger than 5 mL were selected. Tumour delineation was performed based on the factory protocol reconstructions. Firstly, the PERCIST SUV Peak tool in MIM was used to calculate the largest possible mean value in a spherical 1-mL VOI placed within the tumour. Secondly, tumours were delineated using a 30%-isocontour of the mean value previously determined [21]. The resulting mask was then applied to all other reconstructions. Lastly, the activity concentration in each tumour was measured by applying the ICF.
Statistical analysis
Values are presented as relative percentage difference compared to the factory protocol. A Wilcoxon matched-pairs signed-rank test (GraphPad Prism, version 7.05) was used to compare the activity concentration measured according to each optimized protocol and the factory protocol. A statistical significance for P values less than 0.05 was considered.


Comments (0)