
Remember me


In this work, we applied scRNA-seq to analyze PBMCs from elderly hip fracture patients. We identify 8 clusters, which mainly consisted of T cells (CD3D, CD3E), B cells (CD79A, MS4A1), monocytes (VCAN, FCN1), dendritic cells (CLEC10A, FCER1A), natural killer (NK) cells (CLEC10A, FCER1A), megakaryocytes (PPBP, PF4), proliferating cells (TYMS, MKI67), and neutrophils (CXCR2, FCGR3B) (Fig. 1C).
Fig. 1Clustering and categorization of cellular profiles of PBMCs from elderly hip fracture patients. (A) Overview of the experimental workflow. (B) Visualization of tSNE of PBMCs cell clusters in elderly hip fracture patients. (C) Vilin plot showing marker genes for each cell cluster. (D) Bar graph showing the relative percentage of cell clusters for each sample. (E) Visualization of tSNE of PBMCs cell clusters in elderly hip fracture patients at different time points
Fig. 2
Genetic heat map of various subgroups of elderly hip fracture patients at different time points
Fig. 3Bar plot of changes in the proportion of each cell subpopulation
Among lymphocyte subsets, T cells were further categorized into CD4+ T cells (CD4), CD8+ T cells (CD8A), γδ T cells (TRDC, TRGC2), mucosal-associated invariant T (MAIT) cells (NCR3, KLRB1, SLC4A10), and regulatory T (Treg) cells (FOXP3). CD4+ T cells were identified as Naive T cells (CCR7, SELL, S100A4), Memory T cells (GPR183, CD44), and Effector T cells (Teffc) (GNLY, GZMK), whereas CD8+ T cells were identified as Naive T cells (CCR7, SELL, S100A4) and Cytotoxic T cells (KLRD1, NKG7). We further characterized CD8+ cytotoxic T cells as GNLY+CD8+ cytotoxic T cells (GNLY) and GZMK+CD8+ cytotoxic T cells (GZMK). NK cells were also categorized as CD56brightCD16−NK cells (XCL1, TRDC, XCL2, FCER1G, TYROBP), CD56dimCD16+ NK cells (NCAM1, FCGR3A, FGFBP2, NKG7, CX3CR1), and NKT cells (CD3D).
Within the myeloid cell subsets, monocytes were categorized into two subclasses: classical CD14+ (CD14) and non-classical CD16+ (FCGR3A) groups. We conducted a further analyze of the CD14+ monocyte population and classified it into three subpopulations based on differences in their transcriptional profiles: C-Mono1, C-Mono2, and C-Mono3. C-Mono1 expresses high levels of MHC-II molecules (HLA-DPA1, HLA-DPB1, HLA-DQA1, HLA-DQB1, and HLA-DRA), C-Mono2 expresses high levels of S100 family genes, including high levels of S100A8, S100A9, and S100A12, while C-Mono3 expresses high levels of interferon-inducible protein-related genes (IFI44L, IFI6, IFIT2, IFIT3). Finally, dendritic cells (DC) were categorized into two subpopulations: myeloid dendritic cells (mDC) (ITGAX, ANPEP, CD33, ITGAM) and plasmacytoid dendritic cells (pDC) (IL3RA, CLEC4C, NRP1) (Fig. 2, Figure S1-S5).
Dynamics of peripheral blood immune cells in elderly hip fracture patients at different time pointsOur analysis revealed significant changes in immune cell composition at different stages of hip fracture (Fig. 3). The proportion of neutrophils continued to decrease over time (9.20%, 3.63%, 2.57%), possibly indicating the progression of the immune-inflammatory response. In myeloid cells, we observed a slight decrease in the proportion of monocytes and an increase in the proportion of dendritic cells in elderly hip fracture patients during the postoperative recovery period compared to 24 h post-trauma (32.14–21.48% and 0.12–0.82%, respectively). In addition, the percentage of monocytes in the peripheral blood increased significantly (38.98%) within 24 h post-operation and gradually decreased to the normal range (21.48%) on the day 7 post-operation. As previously mentioned, we identified four subpopulations of monocytes, with C-Mono2 being the most predominant. Its proportion significantly decreased during the recovery period to 65.66%, in contrast to 24 h post-trauma (73.53%) and 24 h post-operation (75.90%). In contrast, CD16+ monocytes showed a gradual increase throughout the post-traumatic immune-inflammatory response, which accounts for 6.59% and 11.64% at 24 h and day 7 post-operation compared to 24 h post-trauma (5.19%).
In terms of lymphocytes, we observed a significant decrease in the percentage of cytotoxic T cells (GNLY+CD8+ cytotoxic T cells, GZMK+CD8+ cytotoxic T cells) during the recovery period. The percentages on day 7 post-operation were 25.11% and 8.32%, respectively, compared to 24 h post-trauma (31.09%, 10.07%) and 24 h post-operation (29.61%, 11.47%). In contrast to cytotoxic T cells, the proportion of CD4+ naïve T cells progressively increased over time, with proportions of 35.47% at 24 h post-trauma, 37.99% at 24 h post-operation, and 44.79% at day 7 post-operation. In our study, the proportion of CD56dimCD16+ NK in NK cells varied over time (88.41%, 89.94%, 86.93%), accounting for the majority of NK cells.
B cell subsets were categorized as naïve B cells, memory B cells, and plasma cells. The proportion of naïve B cells in the total number of B cells during the recovery period was significantly lower (54.44%) compared with the preoperative period (72.16%). Additionally, the proportion of memory B cells initially decreased and then increased over time (25.34%, 23.18%, 29.75%). In our study, we found that the composition of PBMCs in elderly hip fracture patients underwent significant changes at different stages post-trauma.
Dynamic differential expression of PBMCs in elderly hip fracture patients: comparing 24 h post-operation to 24 h post-TraumaIn our study, we observed an up-regulation of mitochondria-encoded cytochrome genes (MT-CO3, MT-CO1, MT-CYB) in the C-Mono2 subpopulation during the first 24 h post-operation. Additionally, there was a down-regulation of interferon-related genes (IFI6, IFI44L, IFI27) and chemokine-related genes (CXCL-8, CXCL-2) in the same subpopulation during this time (Fig. 4A, Table S1). Pathway analysis indicated that the upregulated DEGs in the C-Mono2 were primarily enriched in the Oxidative phosphorylation pathway, while the downregulated DEGs were mainly associated with the Chemokine signaling pathway when compared to the status at 24 h post-trauma (Fig. 4B, C).
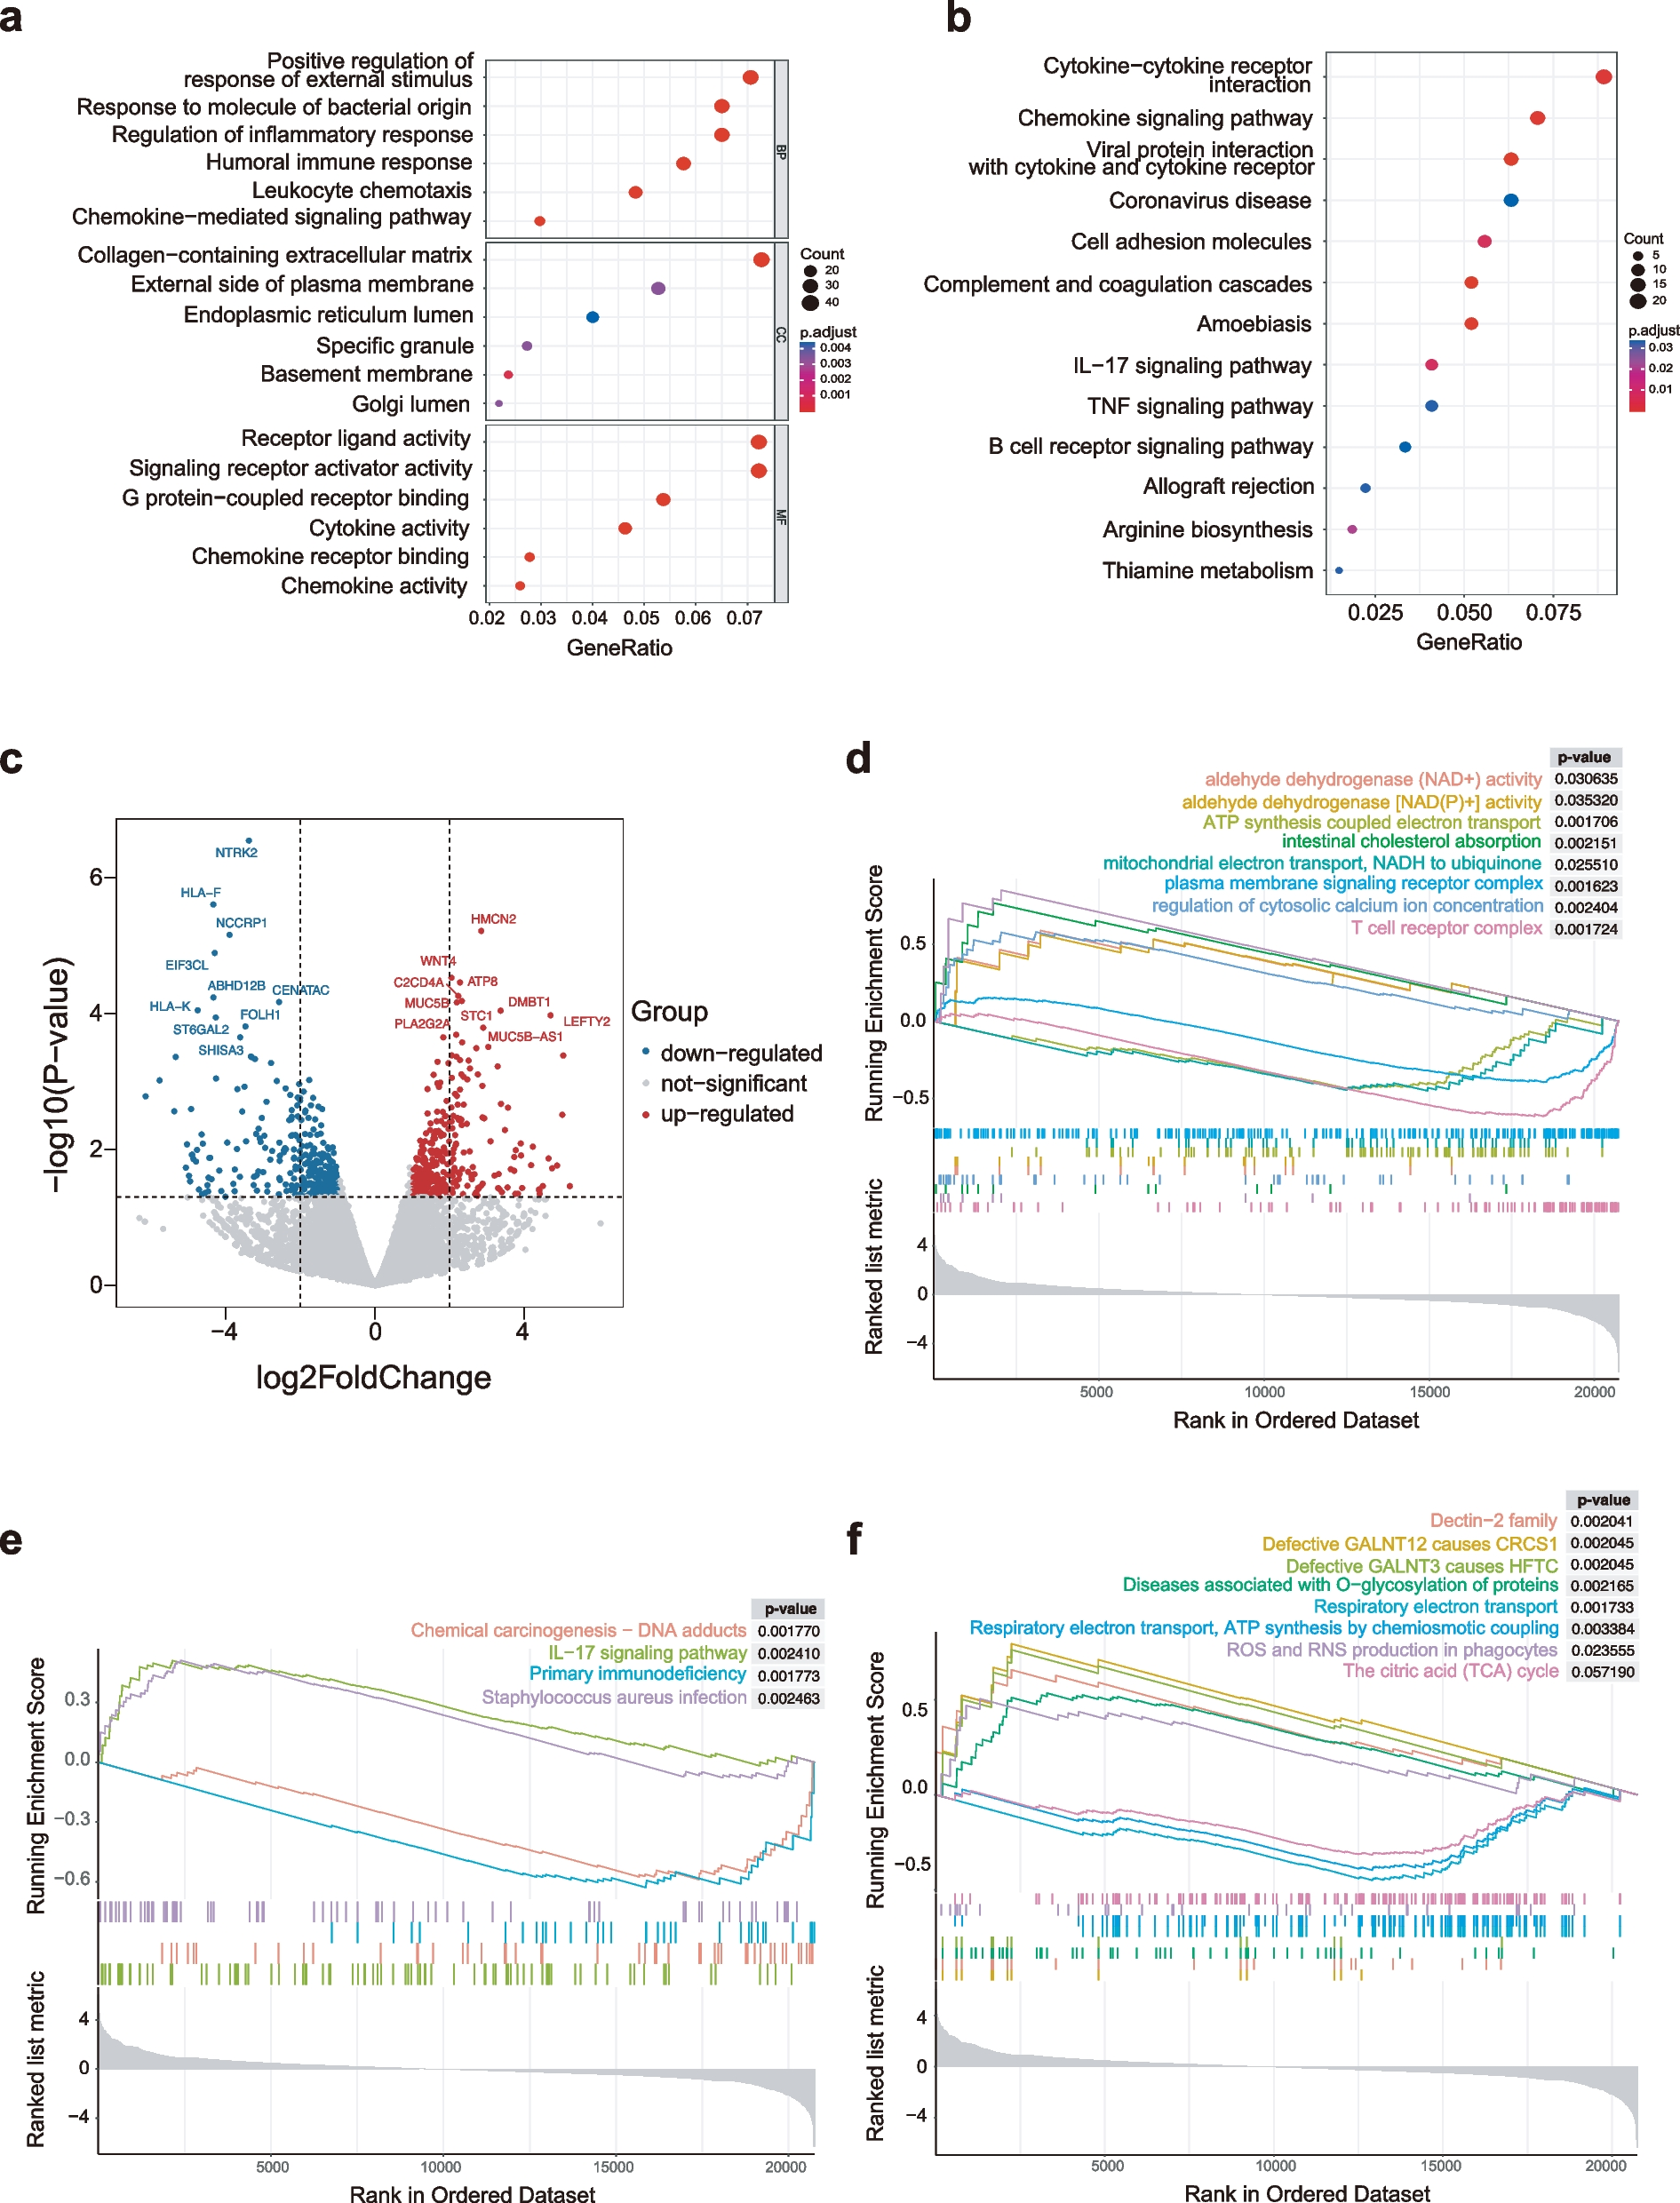
Fig. 4DEGs for C-Mono2 and NC-Mono at 24 h post-operation vs. 24 h post-trauma (A) Top 10 DEGs for C-Mono2 at 24 h post-operation vs. 24 h post-trauma (B) KEGG pathway enrichment analysis of DEGs upregulated by C-Mono2 (C) KEGG pathway enrichment analysis of DEGs downregulated by C-Mono2 (D) Top 10 DEGs for NC-Mono at 24 h post-operation vs. 24 h post-trauma (E) KEGG pathway enrichment analysis of DEGs upregulated by NC-Mono (F) KEGG pathway enrichment analysis of DEGs downregulated by NC-Mono.
Furthermore, we observed the up-regulation of DEFA3 and SOCS3 in several subpopulations (Fig. 4A and Table S1). In contrast, we found a down-regulation of S100 family genes in the CD16+ monocyte subpopulation (Fig. 4D, Table S2). Enrichment analysis revealed that the genes downregulated in CD16+monocytes were significantly enriched in pathways such as osteoblast differentiation, hematopoietic cell lineage, cytokine-cytokine receptor interactions, NOD-like receptor signaling pathway, and IL-17 signaling pathway, (Fig. 4E, F). Additionally, we observed significant upregulation of C1Q A and C1Q B in CD16+ monocytes at 24 h post-operation (Fig. 4D & Table S2).
In addition to monocyte subpopulations, other cell types also displayed interesting differential expression patterns. Treg cells exhibited significant upregulation of hemoglobin subunit-related genes (HBB, HBA1, HBA2) at 24 h post-operation, whereas memory B cells and naïve B cells showed the opposite trend (Fig. 5, Table S3-S5). Naïve B cells exhibited high expression of inflammation-related genes such as S100A8, JUN, and NFKBIA at 24 h post-operation. DEGs indicated that they were highly enriched in pathways related to osteoclast differentiation and the IL-17 signaling pathway. At 24 h post-operation, we also found high expression of DUSP1 in naïve B cells.
Fig. 5TOP 10 DEGs for Treg cell(A), Memory B cell(B), and Naive B cells(C) in day 7 post-operation vs. 24 h post-operation
Meaningful changes in the expression profiles of various cells subpopulations were observed within 7 days post-operationIn C-Mono2, we observed an upregulation of DEFA3 expression at 24 h post-operation compared to preoperatively, followed by a decreasing trend at day 7 post-operation. Additionally, we noted a significant down-regulation of genes associated with inflammation and osteoclast differentiation (e.g., FOS, SOCS3, NAMPT, and TNFAIP3) in the C-Mono2 subpopulation at day 7 post-operation compared to 24 h post-operation [27,28,29,30] (Fig. 6A, Table S6). Pathway enrichment analysis showed that compared with 24 h post-operation, genes downregulated at day 7 post-operation were mainly enriched in oxidative phosphorylation, IL-17 signaling pathway, TNF signaling pathway, and osteoclast differentiation. This suggests a transition from the initial inflammatory response phase to the tissue healing phase [7] (Fig. 6B).
Fig. 6DEGs of monocyte subpopulations and T cell subpopulations at day 7 post-operation versus 24 h post-operation (A) Top 10 DEGs of C-Mono2 at day 7 post-operation VS 24 post-operation (B) KEGG pathway enrichment analysis of KEGG pathways of DEGs down-regulated by C-Mono2 (C) Top 10 DEGs of GZMK + CD8 + cytotoxic T cell at day 7 post-operation VS 24 post-operation DEGs compared (D) KEGG pathway enrichment analysis of DEGs down-regulated by GZMK + CD8 + cytotoxic T cel (E) Top 10 DEGs at day 7 post-operation VS 24 post-operation in Treg cell (F) KEGG pathway enrichment analysis of DEGs down-regulated by Treg cell
In the GZMK+CD8+ cytotoxic T-cell subset, we observed significant downregulation of chemokine-associated DEGs (including CCL3, CCL4, CCL5, and CXCR4) within 7 days post-operation. Previous studies have indicated that the downregulation of these DEGs may have a positive impact on fracture healing day 7 post-operation [31,32,33] (Fig. 6C, D, Table S7). Additionally, GZMB gene was upregulated at 24 h post-operation and displayed a downward trend at day 7 post-operation. Pathway enrichment analysis showed that the upregulated DEGs in the Treg cell subpopulation were enriched in the JAK/STAT signaling pathway at day 7 post-operation (Fig. 6E, F, Table S8), including JAK1, STAT1, etc. The CD4+Naive T cell subpopulation, the largest among T cells, exhibited significant downregulation of many DEGs associated with inflammation and positive regulation of osteoclasts, including S100 genes, chemokine-associated genes, SOCS3, TNFAIP3, FOS, JUN, among others. Pathway enrichment analysis indicated that these down-regulated genes were highly enriched in osteoclast differentiation and the IL-17 signaling pathway (Table S9). To better investigate the differentiation trajectory of T cell subsets, we performed a proposed time series analysis for T cell subsets at different time points. CD4+naive T cells were mainly located at the beginning of the predicted timeline trajectory GNLY+CD8+cytotoxic T cells were positioned immediately after CD4+naive T cells in (a)-(b), GZMK+CD8+cytotoxic T cells were localized at (a)-(c) while Treg cells were localized at another trend of pseudo-temporal endpoints (a)-(d) (Fig. 7A, B). In contrast to the postoperative period, the recovery Fate was divided into three branches, with CD4+naive T cells located mainly at the beginning of the predicted timeline trajectory, GNLY+CD8+cytotoxic T cells and GZMK+CD8+cytotoxic T cells positioned immediately after CD4+ naive T cells at (a)-(b) and (a)-(c). While Treg cells, MAIT cells, and γδ T cell were localized in the other trend of the proposed chronological endpoints (a)-(d), while the other groups were in the figure throughout the development. Throughout the present study, this is the general transcriptional generalization state of each immune cell subpopulation in elderly hip fracture patients (Fig. 7C, D).
Fig. 7
Pseudotime series analysis of CD4naive T cells at 24 h and day 7 post-operation
In summary, immune senescence, inflammation, and osteoimmunology are the three protagonists in the process of hip fracture in elderly patients. Further studies are crucial to improve our understanding of this complex process.
Cellular interactions between PBMCs in different trauma immune statesTo investigate the interaction of immune cells in different immune states post-trauma in elderly patients, we used CellPhone DB to assess the interaction between adult T cell subpopulations, B cell subpopulations, monocyte subpopulations, and NK cell subpopulations. We found that each subpopulation exhibited interactions with other subpopulations, and then applied a series of immune-related ligand-receptor pairs to investigate the L-R pairs involved in these cell-cell interactions (Fig. 8).
Fig. 8
Crosstalk between monocytes, T cells, NK cells, and B cells. (A-C) Heat map showing key cellular interactions between the four cell types
Within 24 h post-trauma, the C-Mono2 cell subpopulation interacted primarily within the monocyte subpopulation via TYROBP_CD44 and C5AR1_RPS19. The GZMK+CD8+ cytotoxic T cell subpopulation interacted with C-Mono2 via CCL5_CCR1, HLA-B_KIR3DL2, and HLA-C_FAM3C. Mono2 and NKT cells interacted with C-Mono1 via TYROBP_CD44, CCL5_CCR1, and HLA-C_FAM3C. Within 24 h post-operation, the GZMK+CD8+ cytotoxic T cell subpopulation interacted with C-Mono2 mainly through CCL5_CCR1, CCL5_CCR5, HLA-B_KIR3DL2, and with NC-Mono monocytes through C5AR1_RPS19, CCL5_CCR1, and CCL5_CCR5 interactions (Table S10-S13).
In the postoperative recovery phase, we observed significant interaction of CD56dimCD16+ NK cells with NC-Mono via C5AR1_RPS19, CCL5_CCR1, and HLA-C_FAM3C. Overall, these findings suggest that different immune cell subpopulations interact with each other during the immune response after trauma in elderly patients, which could provide a potential basis for novel therapeutic strategies in the future (Table S14-S15).
Comments (0)