Preparation of JGSQ extract
Rehmanniae Radix (cat: 2208041), Dioscoreae Rhizoma (cat: 2207115), Corni Fructus (cat: 2209074), Poria (cat: 2210033), Cortex Moutan (cat: 2209099), Alismatis Rhizoma (cat: 2210070), Radix Aconiti Lateralis (cat: 2210108) and Cortex Cinnamomi (cat: 2210074) purchased from Sichuan Xinhehua Traditional Chinese Medicine Decoction Pieces Co., LTD. Implementation standard: “Chinese Pharmacopoeia” 2020 edition. JGSQ extract is prepared from common Chinese medicinal herbs in a certain weight ratio (Table 1). The total amount of medicinal herbs used in this study was 540 g. The above medicinal materials were immersed in 50% ethanol 10 times at room temperature for 1 h, sonicated at 45 °C for 30 min, extracted twice, combined with the medicinal solution, filtered, concentrated to 2 g/mL under reduced pressure by a rotary evaporator at 50 °C, and stored in a refrigerator at 4 °C. The trait description and identification tests of the medicinal materials were all performed by pharmacist Zhaoxia Chen, a Quality Assurance Manager from Koda Pharmaceutics Co., Ltd. The preparation of a JGSQ clinical drug extract was entrusted to a GMP pharmaceutical company, Koda Pharmaceutics Co., Ltd., in accordance with the licence number approved by the Ministry of Health and Welfare of the Republic of China: DOH Manufacturing No. 028491.
Table 1 JGSQ medicinal material and dosesUltra high performance liquid chromatography‒Q exactive-mass spectrometry (UHPLC‒QE‒MS)
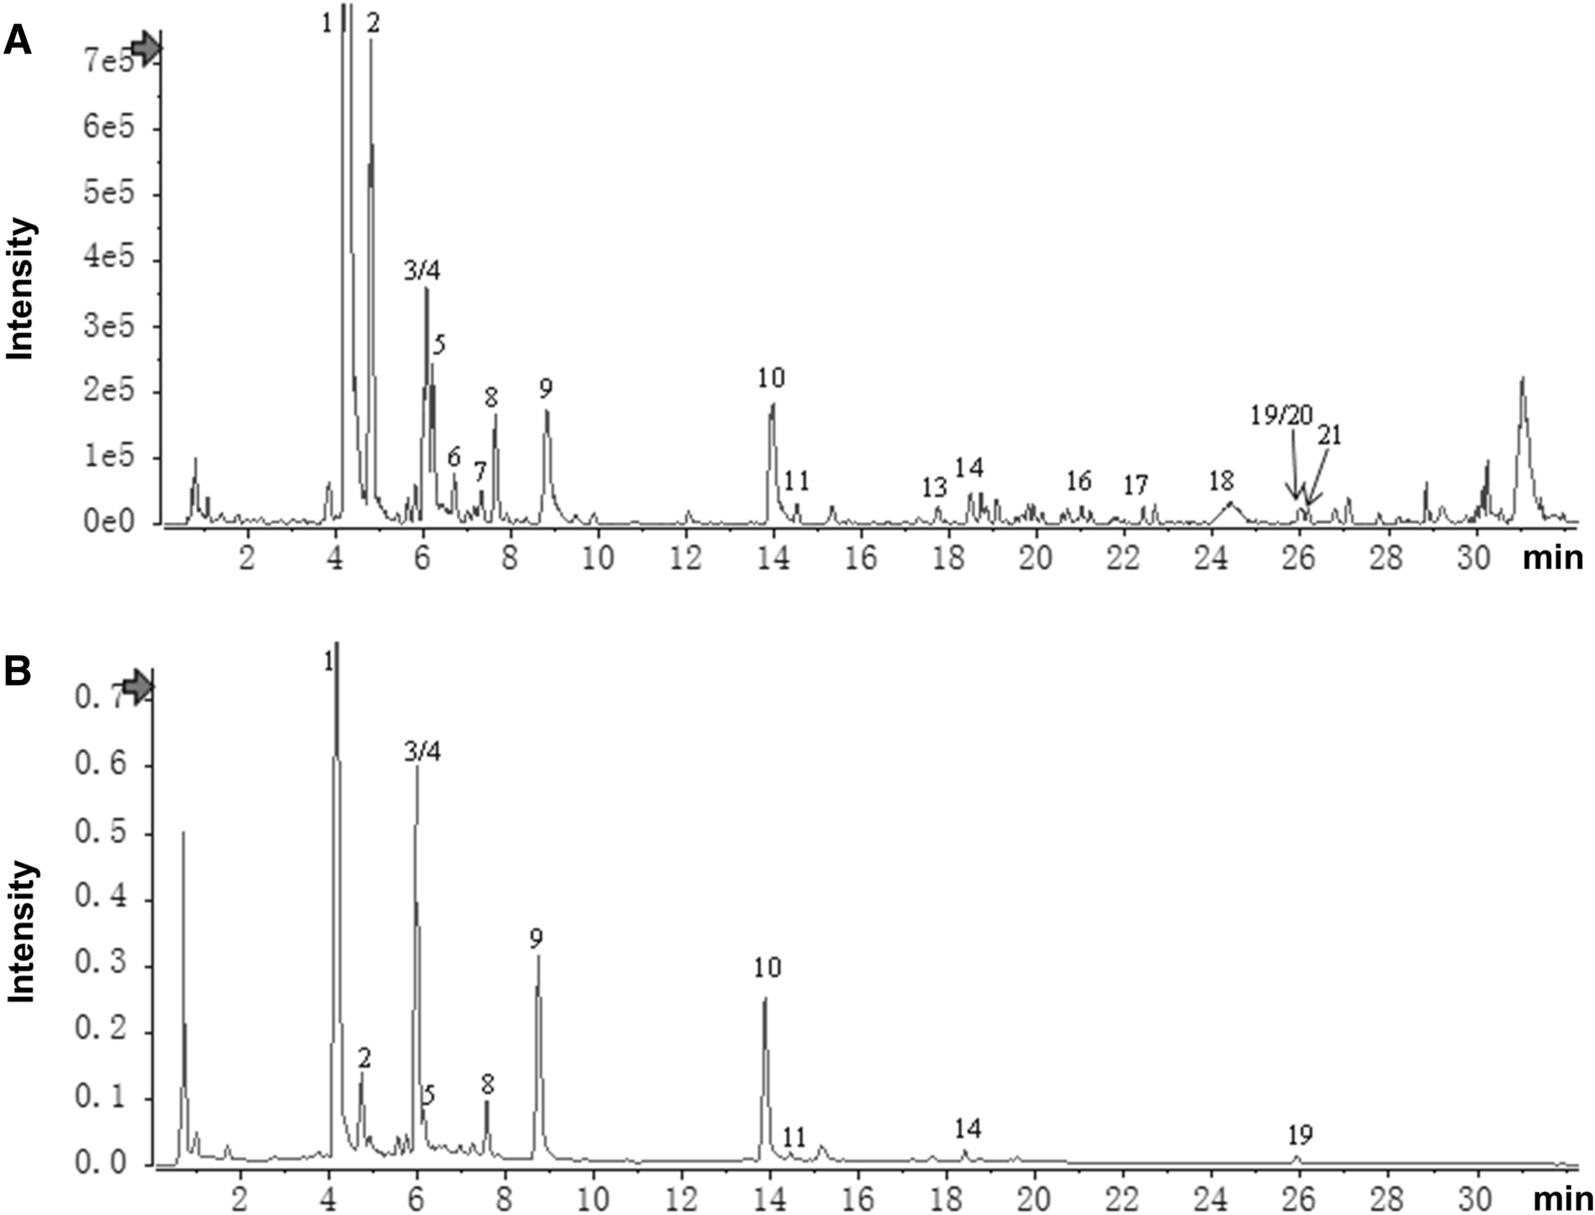
The samples were crushed with a mixer mill for 120 s at 50 Hz. One hundred milligrams of sample was added to 500 μL of extracted solution dissolved in 80% methanol containing 10 μg/mL internal standard. After 30 s of vortexing, the samples were homogenized at 45 Hz for 4 min and sonicated for 1 h in an ice water bath. After placing for 1 h at − 40 °C, the samples were centrifuged at 12000 rpm (RCF = 13,800 (× g), R = 8.6 cm) for 15 min at 4 ℃. The supernatant was carefully filtered through a 0.22 μm microporous membrane, and then 100 μL from each sample was pooled as QC samples. The samples were stored at − 80 °C until UHPLC‒MS analysis. LC‒MS/MS analysis was performed on an UHPLC system. The sample injection volume was set at 5 μL. The flow rate was set at 0.5 mL/min. The multistep linear elution gradient program was as follows: 0–11 min, 85–25% A; 11–12 min, 25–2% A; 12–14 min, 2–2% A; 14–14.1 min, 2–85% A; 14.1–15 min, 85–85% A; 15–16 min, 85–85% A. The negative (Additional file 1: Fig. S1A) and positive (Additional file 1: Fig. S1B) results are shown in the Additional file 1: Fig. S1.
Animal studies and reagents
The db/db and db/m mice at 9–10 weeks of age were purchased from Jiangsu GemPharmatech Co., Ltd. and housed under standard laboratory conditions with free access to food and water. After one week of adaptation feeding, db/db mice were randomly divided into 5 groups (n = 10 per group) for treatment: (1) db/db + normal saline group (model group); (2) db/db + JGSQ (5 g/kg/day) group (low group); (3) db/db + JGSQ (10 g/kg/day) group (middle group); (4) db/db + JGSQ (20 g/kg/day) group (high group); and (5) db/db + metformin (200 mg/kg/day) group (positive group). Metformin was dissolved in distilled water and orally administered at a dose of 200 mg/kg/day for 8 weeks. The db/m mice were used as the normal control group (n = 10). JGSQ was orally administered daily for 8 weeks. Body weight and FBG were measured weekly. This experiment was approved by the Animal Research Ethics Society of Chengdu University of Traditional Chinese Medicine (Approval number: 2023KL-010). The blood glucose level in the serum of mice was tested using a blood glucose test kit (Cat: ml076792, mlbio, Shanghai, China).
Haematoxylin–eosin (H&E) staining
After anaesthetizing the mice with intraperitoneal injection, the eyeballs with attached optic nerves were removed bilaterally. They were fixed in neutral formalin solution for 72 h, dehydrated with a gradient of ethanol concentrations, treated with xylene for transparency, embedded in paraffin, and sliced according to thickness standards. Subsequently, haematoxylin staining and eosin staining were performed separately. H&E staining was performed to observe changes in tissue structure under a light microscope.
PAS staining of retinal vascular network patches
After fixing the optic cup in precooled 4% paraformaldehyde for 48 h, it was rinsed with running water and cut into a petal shape around the optic disc as the centre. The inner layer of the retina was separated and soaked in 0.15 mol/L pH 7.4 glycine buffer overnight after being rinsed with PBS. Then, it was digested with 3% trypsin at 37 °C for 2 h. After the retina was dissolved, it was gently shaken in distilled water to wash away the inner limiting membrane and residual neural tissue, leaving only a transparent retinal vascular network. The network was collected and moved to a glass slide, flattened, air-dried, and stained with PAS. Finally, changes in retinal capillaries in different groups were observed under a microscope.
Terminal-deoxynucleotidyl transferase-mediated nick end labelling (TUNEL)
Paraffin sections were dewaxed with distilled water and then washed with PBS. Proteinase K working solution was added and incubated at 37 °C for 30 min. The sections were then washed with water and treated with H2O2 at room temperature for 10 min. After washing, TUNEL reaction solution was added and incubated at 37 °C for 60 min in the dark. The sections were washed again and then incubated with streptavidin-HRP solution for 30 min at 37 °C in the dark. DAB was used for colour development. Finally, the sections were counterstained with haematoxylin and processed for mounting, followed by panoramic scanning in bright field.
Transmission electron microscopy
The sample was prefixed with 3% glutaraldehyde and then fixed with 1% osmium tetroxide. Dehydration was performed using a series of acetone solutions with increasing concentrations of 30% → 50% → 70% → 80% → 90% → 95% → 100% (with three changes of 100% concentration). The sample was then infiltrated and embedded in a mixture of dehydrating solution and Epon812 embedding resin at ratios of 3:1, 1:1, and 1:3, followed by embedding in Epon812. Thin sections of approximately 60–90 nm were prepared using an ultramicrotome, mounted on copper grids, and stained with uranyl acetate for 10–15 min and lead citrate for 1–2 min at room temperature. Finally, a JEM-1400FLASH transmission electron microscope produced by Japan Electronics was used to capture images of the copper mesh. Each copper mesh was first observed under 6000 times magnification, and images were captured of selected regions for detailed observation of specific abnormalities.
Network pharmacological analysisIdentification of potential targets of JGSQ
Rehmannia glutinosa Libosch., Dioscorea opposita Thunb., Cornus officinalis Sieb. et Zucc., Poria cocos (Schw.) Wolf, Paeonia suffruticosa Andr., Alisma orientalis (Sam.) Juzep., Aconitum carmichaelii Debx. and Cinnamomum cassia Presl. were searched from the TCMSP database (https://old.tcmsp-e.com/tcmsp.php) and TCMIP database (http://www.tcmip.cn/TCMIP/index.php/Home/Index/All). From the TCMSP database, active ingredients with "OB ≥ 30%" and "DL ≥ 0.18" were filtered, and the corresponding target proteins were obtained. Duplicates of the targets of JGSQ obtained from the two databases were merged and removed to obtain potential targets of JGSQ.
Identification of potential targets of DR
Potential targets for DR were obtained by searching the “GeneCards”, “TTD”, and “DisGeNET” databases. After obtaining targets from the “GeneCards” database, those with relevance scores above the 75th percentile were selected. These targets were then merged with others from the other databases, and duplicates were removed to obtain the potential targets for DR.
Construction of the JGSQ-ingredient-DR intersection target network and protein‒protein interaction network
A Venn diagram (http://www.bioinformatics.com.cn/static/others/jvenn/index.html) was generated to identify the intersection between targets for JGSQ and DR targets, which may represent potential targets for the treatment of DR with JGSQ. The corresponding components and JGSQ for the intersection targets were screened, and a “JGSQ-component-target network” was constructed using Cytoscape 3.8.2. To investigate the protein‒protein interactions (PPIs) of JGSQ in treating DR, the drug-intersecting genes were uploaded to the STRING interaction database (https://string-db.org/) for PPI network construction. The species was set as “Homo sapiens”, and the minimum interaction threshold was set as “highest confidence” > 0.4, while other parameters were set at the default values. The resulting data were imported into Cytoscape 3.8.2 for network analysis, and core targets were selected to generate the PPI network.
GO and KEGG enrichment analysis
The function of intersecting targets was annotated using the online tool DAVID (https://david.ncifcrf.gov/), the “select identifier” was set to “official gene symbol”, the “list type” was set to “genelist”, and “homo sapiens” was chosen as the species. GO analysis was performed separately for biological processes, cellular components, and molecular functions, as well as KEGG analysis. Save the enrichment results as a table or diagram.
Molecular docking
AutoDock Vina (1.1.2) was used to perform molecular docking of drug active ingredients and key target proteins to validate their interaction activity. (1) Compounds were downloaded in mol2 format from the TCMSP official website and then imported into Chembio3D for energy minimization. Afterwards, it was imported into AutodockTools-1.5.6 for hydrogenation, charge calculation, and assignment. (2) The target protein was downloaded from the Protein Data Bank (http://www.rcsb.org/). (3) The protein was imported into PyMOL (2.3.0) to remove the original ligand and water molecules and then imported into AutodockTools (v1.5.6) for hydrogenation, charge calculation, charge assignment, and atom type specification. (4) Use the original protein ligand as the docking box centre. If there was no original ligand, the region near the reported key amino acid residues was used as the docking area. (5) The interaction mode was analysed using PyMOL and Ligplot.
Immunofluorescence
After fixing the eyeball tissue specimens in 4% paraformaldehyde solution for 48 h, they were processed into paraffin-embedded sections. The paraffin sections were subjected to dewaxing and gradient alcohol dehydration, followed by antigen retrieval. After washing, the sections were blocked with serum for 30 min, incubated with antibodies, and finally stained and observed under a fluorescence microscope. The image was collected using CaseViewer.
Preparation of JGSQ-containing serum
JGSQ-containing serum was prepared according to a previously published study [17]. SD rats (200 ± 10 g, Male) purchased from Jiangsu GemPharmatech Co., Ltd were split into two groups after 7 days of acclimation. JGSQ-containing serum group was treated with JGSQ (2 g/mL, 1 mL/100 g) daily for 7 days by oral gavage and the normal serum group was given water. Two hours after the final administration, the rats were anesthetized with pentobarbital (50 mg/kg), the serum was collected and filtered through 0.22 µm strainers.
Cell lines and regents
Mouse retinal ganglion cells (RGC-5) were purchased from the BeNa Culture Collection (cat: 23082201, Beijing, China). Cells were cultured in DMEM (cat: C11995500BT, Gibco, China) containing 10% foetal bovine serum (cat: 10099-141C, Gibco, USA) and 1% penicillin/streptomycin (cat: 15140148, Gibco, USA) and placed at 37 °C in a humidified incubator containing 5% CO2. After the cells grew to the logarithmic growth phase, they were digested with 0.25% trypsin–EDTA 1X (cat: 25200-072, Gibco, USA) and passaged 1:3. The AKT activator SC97 (cat: HY-18749) and HIF-1α activator fenbendazole-d3 (cat: HY-B0413S) were purchased from MedChemExpress (New Jersey, USA).
Western blot
RIPA containing protease inhibitors was added to the processed retinal tissues and kept on ice for 30 min. After complete lysis, the cell suspension was centrifuged at 10,000 rpm for 5 min at 4 °C. The protein concentration of the supernatant was then measured using the BCA protein assay kit. The protein of each sample was separated by 10% SDS‒PAGE and transferred onto a PVDF membrane. Seal with a solution containing 5% skim milk for 1 h. Then, the cells were incubated with the following antibodies: TP53 (cat: 60283-2-Ig, 1:5000, Proteintech), AKT (cat: 60203-2-Ig, 1:5000, Proteintech), p-AKT (cat: 66444-1-Ig, 1:5000, Proteintech), HIF-1α (cat: AF7087, 1:5000, Beyotime), cleaved PARP (cat: AF1567, 1:1000, Beyotime), GAPDH (cat: 60004-1-Ig, 1:5000, Proteintech), and β-actin (cat: 48139 1:5000, SAB Antibody) overnight at 4 °C. Subsequently, the membranes were washed with TBST and incubated with goat anti-rabbit/mouse IgG (H + L) HRP at room temperature for 1 h. The membrane was exposed with chemiluminescence detection reagent. ImageJ 6.0 software was used to obtain the band intensity of protein expression and perform analysis, normalized to the band intensity of β-actin. All experiments were repeated three times.
Statistic analysis
Statistical analysis was performed using SPSS 25.0 and GraphPad Prism (Version: 6.02, USA) software. Data are presented as the mean ± standard deviation. Differences between groups were analysed using one-way analysis of variance (ANOVA) and two-tailed Student's t test. A p value < 0.05 was considered statistically significant for all comparisons.


留言 (0)