
Remember me


In low- and middle-income countries (LMICs) such as South Africa, the burden of acute respiratory illnesses (ARIs) is high, and is associated with significant morbidity and mortality, especially in children under 5 years of age.1,2 The social-economic and healthcare context, as well as epidemiological and clinical risk factors such as HIV, tuberculosis (TB) and undernutrition, may influence the clinical presentation and outcomes of ARIs in these settings. Initial data suggest that severe acute respiratory syndrome coronavirus-2 (SARS-CoV-2) in children in LMICs generally has higher morbidity and mortality compared with the high-income countries (HICs).3–8 However, it remains unclear whether SARS-CoV-2 is similar in presentation and outcome to ARIs from other causes in children in LMICs.
Data from across the world, including surveillance data from South Africa, revealed marked changes in epidemiological profile of seasonal respiratory viruses over the course of the coronavirus disease 2019 (COVID-19) pandemic, with lower detection rates of influenza and respiratory syncytial virus (RSV) particularly, and a relative increase in human rhinovirus (HRV).9–11
Rates of viral coinfection with SARS-CoV-2 in children vary greatly in the literature, from rates as low as 1.8% up to 26%.3,12 The wide variation may be partly explained by patient selection, lack of routine testing and epidemiological changes during the course of the pandemic. Children may have higher rates of coinfection compared with adults, and this may be associated with increased severity of illness.13
In this study, we compared the clinical presentation and outcomes of children with polymerase chain reaction (PCR)-confirmed SARS-CoV-2 infection with those who had a negative PCR among children admitted with an ARI. In addition, we investigated viral coinfection with other respiratory viruses.
METHODS Study DesignWe performed a cross-sectional study including 0- to 13-year-old children, who were admitted to Tygerberg Hospital between May 5, 2020 (week 19) and December 5, 2020 (week 48) with an ARI. This period falls within the beginning of autumn until the beginning of summer. South Africa reported its first case of SARS-CoV-2 on March 5, 2020, with the first wave officially starting at the beginning of May 2020 in the Western Cape (week 19).14
SettingTygerberg Hospital is a large public tertiary hospital in the Western Cape province of South Africa providing specialist and subspecialist pediatric services. General pediatric services in South Africa provide care for children up to the age of 13 years, which is the rationale for the age cutoff for our study population. The majority of patients accessing the hospital come from poor socio-economic circumstances. Due to limited critical care beds, respiratory support in the form of nasal continuous positive airway pressure using Fisher and Paykel variable flow system, or high-flow nasal cannula oxygen therapy using the Airvo Optiflow system are mostly provided in the pediatric emergency unit and general pediatric wards.
Study Participants and DefinitionsChildren admitted with symptoms of an ARI and who had a SARS-CoV-2 PCR test were included. ARIs were classified into one of the 3 diagnostic categories according to the main presenting feature, namely upper respiratory tract infection (URTI), lower respiratory tract infection (LRTI) or asthma/wheeze. URTI was defined as having at least 1 respiratory symptom, without any signs of tachypnea or respiratory distress. LRTI was defined as any child with respiratory symptom(s) and evidence of tachypnea or respiratory distress, including acute viral bronchiolitis. Asthma (>5 years) or wheeze (≤5 years) were classified if the predominant clinical presentation was wheeze/reversible bronchospasm. We excluded babies admitted to the neonatal service, children whose SARS-CoV-2 PCR was positive but who did not have any respiratory symptoms, and children in whom a SARS-CoV-2 PCR result was not available. Children with multisystem inflammatory syndrome in children were only included if their presentation was as an ARI.
Data CollectionA standard data collection form was used to capture routine clinical and laboratory information at the time of presentation to pediatric emergency unit or admission to a ward. All cases were reviewed 3–6 months after the initial admission to assess mid-term outcome and record any readmissions within 3 months of initial presentation. Missing information was subsequently retrospectively captured using patient clinical records and the National Health Laboratory system. Unfortunately, in cases where the data collection form was not fully completed at the time of admission, certain data were missing despite retrospective review of the medical records, and consequently not all variables were captured for all cases. De-identified data were captured onto a secure RedCap database. A waiver of individual consent was obtained from Stellenbosch University Human Research Ethics committee (HREC N20/04/013_COVID). Data of some children were previously published.6,7
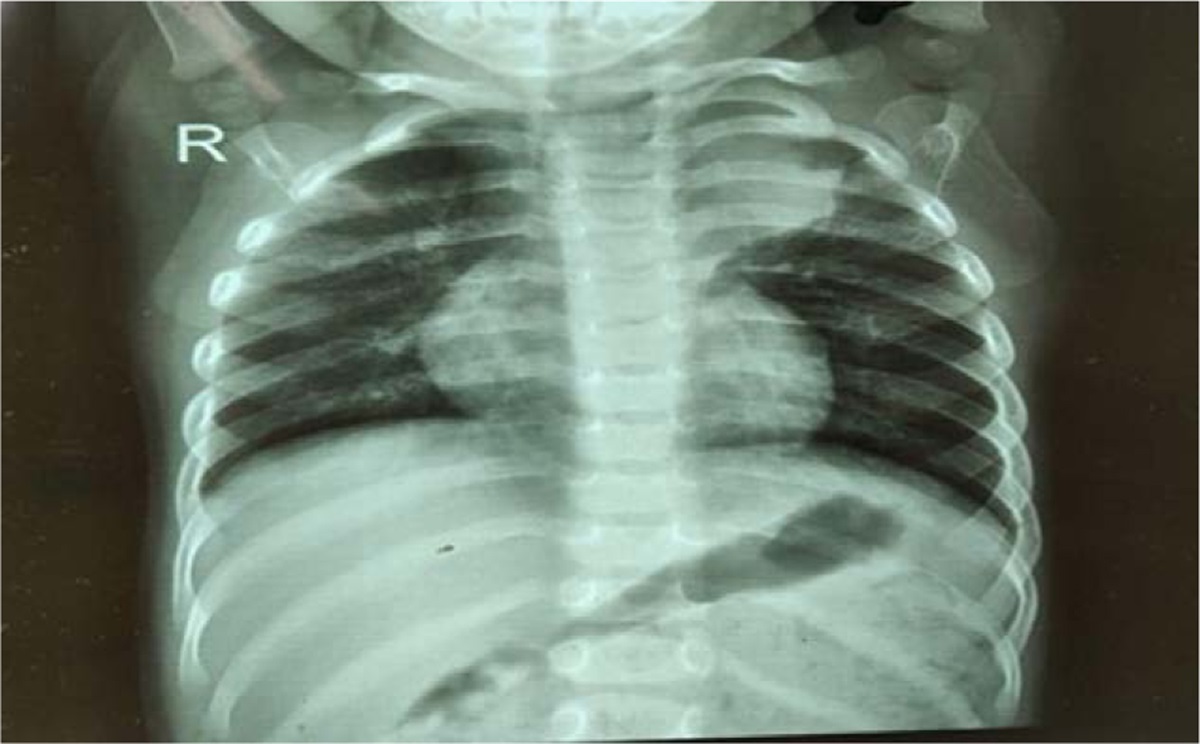
De-identified digital chest radiographs (CXR) were reported by 2 external expert reviewers, who were blinded to any clinical information apart from age. Radiological features were described in accordance with World Health Organization classification of pneumonia as either alveolar infiltrate, other infiltrate (which included interstitial infiltrates) or no pneumonia.15 Weight-for-age Z-scores (WAZ) were calculated using a World Health Organization-based app developed by the Canadian Pediatric Endocrine group.16
Throughout the study period, all children admitted with ARI symptoms underwent real-time reverse-transcription polymerase chain reaction testing for SARS-CoV-2 via a single nasopharyngeal swab as part of routine care. Testing for other respiratory viruses was not performed routinely, but at the discretion of the clinical team or retrospectively as part of the study if samples were still available. Tests were performed in a registered virology laboratory using Allplex 2019-nCoV assay (Seegene Inc) and manufacturer’s cycle threshold cutoff values were used. Multiplex PCR testing for respiratory viral panel was performed using either the Anyplex II RV16 detection assay or the Allplex RV Essential Assay (both from Seegene Inc). Epidemiologic data from the National Institute of Communicable disease shows that the Ancestral type variant (May 3, 2020 to August 16, 2020) and Beta variant (November 8, 2020 to February 7, 2021) were present during the study period.17
Data AnalysisData analysis was done using IBM SPSS Statistics v27. The χ2 test was used to compare categorical variables, and independent samples t test or Mann-Whitney U test were used to compare continuous variables. Multivariable analysis was performed using logistic regression models to study the association of demographic/clinical variables with SARS-CoV-2 infection and severity. Variables included in multivariable analysis model assessing SARS-CoV-2 positivity were age, sex, WAZ, any comorbidity, COVID contact, HIV exposure or disease, TB exposure or disease and reported symptoms and signs as listed in Table 2. Variables included in the model assessing severity and outcome were age, gender, need for oxygen or further respiratory support, need for pediatric intensive care unit (PICU) admission, length of stay and number of days on oxygen. Level of significance was set at 0.05. Laboratory markers were excluded from the multivariable models because of a high percentage of missing data.
RESULTSA total of 176 children were included in our study, of which 38 (21.6%) were SARS-CoV-2 PCR positive and 138 (78.4%) were SARS-CoV-2 PCR negative.
Patient CharacteristicsPatient characteristics are shown in Table 1. Nearly half of all patients were <1 year of age. There were proportionately more infants in the SARS-CoV-2 positive group (65% vs. 41%, P = 0.01). Compared with SARS-CoV-2 negative children, children with SARS-CoV-2 infection were younger (median 6.6 months vs. 17.0 months, P = 0.03) and tended to be female (55% vs. 38%, P = 0.06). Nearly one third of all children had comorbidities (30%), but there was no significant difference between the SARS-CoV-2 positive and negative groups (26% vs. 31%, P = 0.56). The most frequent comorbidities were premature birth (19%), HIV exposure (29/143, 20%), HIV positive (9/149, 6%), 10 of 167 (6%) with current or previous TB disease, 7 of 176 (4%) known with asthma, 6 of 176 (3%) with cancer and 5 of 176 (3%) with a cardiac condition.
TABLE 1. - Demographic Characteristics of Patients n All (n = 176) SARS-CoV-2 Positive (n = 38) SARS-CoV-2 Negative (n = 138) P Value Age (median, IQR) in months 176 14.1 (3.4–40.6) 6.6 (2.1–23.7) 17.0 (4.6–42.0) 0.03 Age categories 0.08 0–2 mo 42 (24%) 14 (37%) 28 (20%) 3–11 mo 39 (22%) 11 (29%) 28 (20%) 12–59 mo 71 (40%) 10 (26%) 61 (44%) >60 mo 24 (14%) 3 (8%) 21 (13%) Infant age group 176 0.01 <1 y 81 (45%) 25 (63%) 56 (41%) >1 y 95 (55%) 15 (37%) 82 (59%) Sex 176 0.06 Male 102 (58%) 17 (45%) 85 (62%) Female 74 (42%) 21 (55%) 53 (38%) Premature birth 160 31 (18%) 7/34 (21%) 24/126 (19%) 0.92 WAZ (median, IQR) 176 −0.62 (−1.7 to 0.34) −0.83 (−2.5 to −0.11) −0.54 (−1.6 to −0.44) 0.03 Any comorbidity* 176 53 (30%) 10 (26%) 43 (31%) 0.56 HIV exposed (%) 143 29 (20%) 8/30 (27%) 21/111 (19%) 0.72 HIV status 149 0.64 HIV uninfected 140 (94%) 30/31 (97%) 110/118 (93%) HIV infected 9 (6%) 1/31 (3)% 8/118 (7%) TB exposure 167 0.53 Not TB exposed 152 (91%) 34/35 (97%) 120/132(90%) TB exposed 15 (9%) 3/35 (8%) 12/132 (9%) TB disease 173 0.74 Never TB disease 163 (94%) 35/37 (95%) 128/136 (94%) Current TB disease 7 (4%) 2 (5%) 5 (4%) Previous TB disease 3 (2%) 0 3 (2%) Known/suspected COVID contact† 176 17 (10%) 6 (16%) 11 (8%) 0.15*This includes children with current TB disease (7), HIV infected (9), asthma (7), cardiac (5), oncological (6), cerebral palsy (4). Selected other conditions included one child with diabetes and two children with sickle cell disease.
†Known COVID contact was defined as having been in contact with a confirmed COVID-19 case. A suspected COVID contact was defined as having been in contact with a person meeting the case definition for COVID-19, but whose SARS-CoV-2 status was unknown.
Comparison of the clinical features, special investigations, treatment and outcomes in SARS-CoV-2 positive and negative children is shown in Table 2. In univariable analysis, measured or reported fever was more common in children with SARS-CoV-2 infection compared with those without (68% vs. 40%; P = 0.01). Children with SARS-CoV-2 were less likely to present with cough (63% vs. 85%; P = 0.01), tight chest (48% vs. 70%; P = 0.02) or wheeze (33% vs. 51%; P = 0.03). There were no other symptoms or signs, which were significantly different between the groups.
TABLE 2. - Comparison of the Clinical Presentation, Management and Outcome of SARS-CoV-2 Positive and Negative Children Symptoms n All (n = 176) SARS-CoV-2 Positive (n = 38) SARS-CoV-2 Negative (n = 138) P Value Fever* 176 81 (46%) 25 (68%) 56 (40%) 0.01 Cough† 176 142 (80%) 25 (63%) 117 (85%) 0.01 Abdominal symptoms‡ 176 48 (27%) 13 (33%) 35 (25%) 0.28 Runny nose/rhinorrhea 176 88(50%) 20 (53%) 68 (49%) 0.72 Tight chest 176 116 (65%) 19 (48%) 97 (70%) 0.02 Headache 176 9 (5%) 3 (8%) 6 (4%) 0.33 Examination features Hypoxia (<92%) 155 60 (38%) 14/32 (41%) 46/123 (37%) 0.58 Tachypnea§ 176 105 (59%) 21 (53%) 84 (61%) 0.34 Tachycardia ¶ 176 80 (46%) 16 (45%) 64 (46%) 0.64 Increased work of breathing 176 129 (72%) 29 (73%) 100 (72%) 0.64 Wheeze 176 83 (47%) 12 (33%) 71 (51%) 0.03 Crepitations 176 95 (53%) 17 (43%) 78 (57%) 0.20 Stridor 176 8 (5%) 2 (5%) 6 (4%) 0.57 Investigations CRP (median, IQR) 141 11 (2–35) 14 (2–25) 10 (2–37) 0.93 White cell count (median × 109/L, IQR) 140 12 (8.1–16.6) 12.7 (10.4–19.0) 11.9 (7.7–16.6) 0.33 Lymphocyte count (median × 109/L) 120 3.1 (1.8–4.8) 3.8 (1.7–6.3) 2.8 (1.8–4.5) 0.32 Platelet count (mean × 109/L) 136 411 422 401 0.56 Blood culture positive 88 10 (12%) 3/24 (13%) 7/64 (11%) 0.20 Chest radiography‖ Alveolar infiltrate 162 57 (35.2%) 18 (48.6%) 39 (31.2%) 0.06 No pneumonia 162 103 (63.6%) 19 (51.4%) 84 (67.2%) Other infiltrates 162 1 (0%) 0 (0%) 1 (0.7%) – Diagnosis URTI 176 32 (18%) 7 (20%) 25 (18%) 0.17 LRTI 176 133 (75%) 31 (80%) 102 (74%) 0.43 Asthma/viral wheeze 176 16 (9%) 1 (3%) 15 (11%) 0.20 Management Nasal prong oxygen (2L/min or less) 176 121 (68%) 27 (68%) 94 (68%) 0.73 High-flow (HF) 176 48 (27%) 15 (38%) 33 (24%) 0.06 CPAP 176 14 (8%) 6 (15%) 8 (6%) 0.06 Invasive ventilation (IPPV) 176 11 (6%) 3 (8%) 8 (6%) 0.64 Respiratory support (HF/CPAP/IPPV) 176 51 (28%) 15 (38%) 36 (26%) 0.11 Any oxygen supplementation 176 132 (74%) 29 (76%) 103 (75%) 0.83 Oxygen duration (median, IQR) 132 2 (1.0-6.0) 6 (1.0–9.2) 2 (1.0–4.5) 0.01 Dexamethasone 176 8 (4.5%) 4 (10.5%) 4 (2.9%) 0.07 Prednisone 176 65 (36.9%) 17 (44.7%) 48 (34.8%) 0.26 Metered dose inhaler 176 64 (36.4%) 10 (26.3%) 54 (39.1%) 0.15 Nebulization 176 45 (25.6%) 6 (15.8%) 39 (28.3%) 0.12 Intravenous antibiotics 176 98 (55.7%) 25 (65.8%) 73 (52.9%) 0.16 Oral antibiotics 176 128 (72.7%) 25 (65.8%) 103 (74.6%) 0.28 Outcome PICU admission 176 16 (9%) 7 (18%) 9 (7%) 0.03 Length of stay (median days, range) 167 3.0 (0–40) 7.0 (2.0–15.0) 3.0 (2.0–8.0) 0.01 Readmission for respiratory reason 176 27 (15%) 7 (18%) 20 (15%) 0.64*History of fever or measured fever.
†History of cough or observed cough.
‡Includes diarrhea, vomiting and abdominal pain.
§Tachypnea was defined as follows: 0–2 months respiratory rate (RR) > 60, 3–11 months RR > 50, 12–59 months RR > 40 and >60 months RR > 25.
¶Tachycardia was defined as follows: 0–2 months heart rate (HR) > 170, 3–11 months HR > 160, 12–59 months HR > 150 and >60 months HR > 120.
‖One child in the SARS-CoV-2 negative group had an radiograph which was uninterpretable due to technical issues.
CPAP indicates nasal continuous positive airway pressure.
The majority of children were diagnosed with LRTI (133/176), with a minority presenting with URTI (32/176), asthma (13/176) or viral wheeze (3/178). There was no significant difference in type of ARI between SARS-CoV-2 positive and negative children.
Using a stepwise backward logistic regression model looking at demographic and clinical features (Table 3), children with SARS-CoV-2 had statistically significantly lower weight-for-age Z-scores [odds ratio (OR): 0.76, 95% confidence interval (CI): 0.63–0.93], were more likely to be female (OR: 2.68, 95% CI: 1.19–6.07) and were more likely to have fever (OR: 3.56, 95% CI: 1.54–8.24) but less likely to have cough (OR: 0.27, 95% CI: 0.11–0.66).
TABLE 3. - Significant Variables Associated With SARS-CoV-2 After Multivariable Analysis Using Stepwise Backward Logistic Regression Model* Variable OR 95% CI Lower 95% CI Upper WAZ 0.77 0.63 0.93 Gender 2.68 1.18 6.07 Fever 3.56 1.54 8.23 Cough 0.27 0.11 0.66 *Variables included in multivariable analysis were age, sex, WAZ, any comorbidity, COVID contact, HIV exposure or disease, tuberculosis exposure or disease, as well as reported symptoms and signs as listed in Table 2.A large percentage of children required oxygen supplementation (132/176, 74%) or further respiratory support in the form of high-flow, continuous positive airway pressure or invasive positive pressure ventilatin (IPPV) (51/136, 28%), in keeping with their need for admission at a referral hospital. SARS-CoV-2 positive children were not more likely to need oxygen (76% vs. 75%, P = 0.83) or respiratory support (38% vs. 26%, P = 0.11), but were more likely to require intensive care admission (18% vs. 7%, P = 0.03), required oxygen supplementation for longer (median 6 vs. 2 days, P = 0.01) and had significantly longer hospital stay (median 7 vs. 3 days, P = 0.01). Multivariable logistic regression analysis was performed, which included age, gender, need for oxygen or further respiratory support, PICU admission, length of stay and number of days on oxygen. This showed number of days on oxygen (OR: 1.1, 95% CI: 1.01–1.20) as the only factor independently associated with SARS-CoV-2 infection. In terms of treatment received, steroid therapy, antibiotics and bronchodilator therapy were similar between the groups.
Special InvestigationsThere was no difference in laboratory features between the SARS-CoV-2 positive and negative groups. Blood cultures were performed in 88 patients, with 10 being positive. Organisms grown on blood culture included coagulase-negative staphylococci (6), methicillin-sensitive Staphylococcus aureus (1), methicillin-resistant S. aureus (1), multidrug-resistant Enterobacter cloacae (1) and Streptococcus mitis/oralis (1). Alveolar infiltrates on CXR tended toward being more frequent in the SARS-CoV-2 positive group (48.6% vs. 31.2%, P = 0.06). Respiratory viral panels were available for 108 of 176 (61.2%) patients, and the results are shown in Table 4. Overall, another respiratory virus was detected in 71 of 108 (66%) of patients, but there was no significant difference between the SARS-CoV-2 positive and negative groups (15/27 vs. 56/81, P = 0.20). The most common viruses detected were HRV (56/108, 51.9%), RSV A/B (30/108, 27.8%) and human adenovirus (10/108, 9.3%). HRV point prevalence was high and consistent throughout the winter months (May to August), whereas RSV showed a consistent gradual increase over the same time period, shown in Figure 1. There was only 1 case each of influenza, parainfluenza and human metapneumovirus.
TABLE 4. - Results of Respiratory Viral Panel Tests All (n = 108) N, % SARS-CoV-2 Positive (n = 27) N, % SARS-CoV-2 Negative (n = 81) N, % P Value Human rhinovirus 56 (51.9%) 9 (33.3%) 47 (58.0%) 0.03 RSV A/B
Comments (0)