Ethics statement
This study incorporated survey data and surveillance data on opisthorchiasis, sourced from peer-reviewed published literature and annual reports from the regional departments of the Federal Service for Supervision of Consumer Rights Protection and Human Wellbeing (Rospotrebnadzor), respectively. The original sources included statements indicating that appropriate ethics approvals were obtained. The data used in this study were aggregated at either village/community or areal level and did not include any personally identifiable information at individual or household levels. Therefore, no specific ethical concerns were identified in this research.
Disease data
We conducted a systematic review to collect relevant prevalence data of opisthorchiasis in Western Siberia and the Ural Region of Russian Federation from inception to August 31, 2024 (registered in the International Prospective Register of Systematic Reviews NO. CRD42023445574), and reported it following the Preferred Reporting Items for Systematic Reviews and Meta-Analyses (PRISMA) guidelines (Appendix A). Two general databases (i.e., ISI Web of Science and PubMed) and two local databases (i.e., eLIBRARY and Scientific Medical Library of the Siberian State Medical University) were searched with search terms “(liver fluke* OR Opisthorchi*) AND (Russia* OR RF OR Siberia OR Ural)” (Appendix C). For literature in Russian language, we enlisted the assistance of a student proficient in Russian for translation purposes, while also utilizing translation software to ensure accuracy and comprehensiveness. In our search strategy, we did not impose any restrictions on language, survey date, or study design. Protocol for the inclusion, exclusion, and extraction of survey data is provided in Appendix C, referenced to Zhao et al.’s protocol on systematic review of opisthorchiasis in Southeast Asia [20]. Briefly, we included community-based surveys that provided prevalence related data (i.e., reporting number of examined and number of positive, or prevalence). All the included records, with survey locations georeferenced by Google Maps, were extracted into a database with detailed information (e.g., literature information, survey information, location information, and disease-related information), and were verified by two independent reviewers subsequently. Finally, the quality assessment of each included literature was undertaken using a nine-point checklist (Appendix D).
Surveillance data were obtained from the annual reports of the Ministry of Health of the Russian Federation. It was accessible from the regional departments’ webpages of the Federal Service for Supervision in Consumer Rights Protection and Welfare (Appendix E). Data were included if it contained at least one of the followings: the annual number of positive cases reported or the annual incidence rate. Data lacking both of that information was excluded. Details protocols are provided in Appendix C.
Environmental, socioeconomic, and demographic data
Environmental data (i.e., land surface temperature (LST) in the daytime, normalized difference vegetation index (NDVI), land cover, elevation, annual precipitation, distance to the nearest open water bodies and soil moisture), socioeconomic data (i.e., human influence index (HII), travel time to the nearest big city), and demographic data (i.e., population count, population growth rate) were obtained from the open-access databases (Appendix F) [24]. They were further integrated into a regular grid with a spatial resolution of 5 \(\times\) 5 km2. As the collected high-resolution data on potential influencing factors did not cover the entire study period (1980 − 2019), the average value of each factor within each grid pixel over available years was utilized. In addition, similar classes of land cover were re-grouped into five categories, that is (1) croplands; (2) forests; (3) shrub and grass; (4) urban; and (5) others. As high-spatial resolution demographic data before the year 2000 were lacking, the population counts were estimated based on the nearest available year of population data and the population growth rate. The formula used for estimation was \(_= _* ^_}\). Here \(_\) and \(_\) are the population counts in year \(m\) and \(n\) (\(m\) > \(n\)), respectively.
Statistical analysisData preprocessing and variable selection
Multi-categorical predictors were converted into dummy variables, and continuous predictors were standardized with a mean of zero and a standard deviation of one. To prevent collinearity, we calculated Pearson’s or Spearman correlation coefficients for each pair of continuous variables. If the absolute values of correlation coefficients exceeded 0.8, we only retained the one more meaningful or with higher-quality in each pair [25].
To construct a parsimonious model, Bayesian variable selection was utilized to determine the optimal set of predictors. First, in order to identify the optimal functional form (continuous or categorical) for the continuous predictors, they were converted into two-level or three-level categorical variables based on preliminary, exploratory, and graphical analysis [26]. Bayesian geostatistical models, introduced in the following part, were constructed using either form as the independent variable. The functional form with the minimum Deviance Information Criterion (DIC) was chosen as the best option. Second, all possible combination subsets of variables were considered to identify the best combinations of predictors. And the one with the lowest DIC was selected in the final model. Particularly, the distance to the nearest open water bodies was included in all predictor combinations, based on the previous studies that demonstrated its importance on liver fluke infection [27]. The variable selection process was conducted within the framework of the spatial–temporal model for survey data.
Model fitting, validation and risk mapping
An advanced multivariate Bayesian geostatistical joint modelling approach was developed [28, 29], to jointly analyze both survey and surveillance data, as well as data at both point- and areal levels, that is,
$$\left\logit\left(_\right)=_+}}_}}}^}}\beta +\omega \left(s, t\right)+_, i=1,\dots ,_\#\left(a\right)\\ logit\left(_\right)=_+\widetilde}}_}}}^}}}\beta +_\right|}^_\omega \left(s, t\right)dxdt+_, i=_,\dots ,_+_\#\left(b\right)\\ log\left(_\right)=_+\alpha _\right|}^_\omega \left(s,t\right)dxdt+_ j=1,\dots ,17\#\left(c\right)\end\right.$$
(1)
For survey data, we assumed the number of positive \(_\) following a binomial distribution \(_ \sim Bin\left(_, _\right)\), where \(_\) and \(_\) denoted the probability of infection and the number of examined at location \(i\) in survey year \(t\), respectively. \(i\) represented either the location of point-referenced survey data or the area for area-level survey data. Allow \(i=_,_,\dots ,_+_\), where \(_\) was the total number of locations for point-referenced surveys and \(_\) was the total number of areas for areal level surveys, respectively. \(_\) was modeled on the logit scale.
In terms of point-referenced prevalence data [Formula 1, (a)], where\(i=_\), and \(}}_}}}^}}\) represented the vector of covariates, and \(_\) and \(}\) were the intercept and corresponding vector of regression coefficients, respectively. Under the presumption of spatial–temporal dependence among survey outcomes, we defined the \(\omega \left(s, t\right)\) as a spatial–temporal random effect for the \(^\) location in survey year\(t\). The spatial–temporal random effect was assumed to follow a zero-mean Gaussian distribution, depicting the spatial correlation between locations by a stationary Matérn covariance function and temporal correlation between different survey years through autoregressive order 1 (AR1), respectively. To reduce computational burden, regular temporal knots were set every 11 years, that is,\(\omega \left(_=1975, _=1986_=1997,_=2008,_=2019\right)\). The latent fields for remaining years were approximated by projecting \(\omega\) using a B-spline basis function of degree two [30, 31]. \(_\) was the exchangeable non-spatial random effect following a zero-mean normal distribution\(_ \sim N\left(0, _^\right)\). As for area-level prevalence data (Formula 1, (b)), where \(i=_,\dots ,_+_\), \(\widetilde}}_}}}^}}}\), \(\widetilde}}_}}}^}}}\) and \(_\right|}^_x\left(s,t\right)dxdt\) were the vector of average values of covariates and the average spatial–temporal random effects of pixels within the \(^\) area in survey year\(t\). \(\left|_\right|=__}1ds\) indicates the size of \(^\) area.
For area-level surveillance data [Formula 1, (c)], we assumed the reported number of cases \(_\) followed a Poisson distribution, \(_ \sim Poissin\left(_\right)\), where \(_\) denoted the expected number of cases in \(^\) area in reported year \(t\). In cases of insufficient survey data, surveillance data can additionally provide information on spatial characteristics based on the similarity of spatial patterns of the two kinds of data. As we assumed spatial consistency between survey and surveillance data, share component of spatial–temporal random field \(\omega \left(s,t\right)\) was introduced. And \(\alpha\) named the tuning coefficient, serving as a weight on the shared component to account for the differences in scale between the two sub-models. \(_\) was the intercept. The joint model was developed under a Bayesian framework and Integrated Nested Laplace Approximation-Stochastic Partial Differential Equation (INLA-SPDE) approach was used for model fitting, and we calculated Bayesian credible intervals (BCI) to reflect the uncertainty of the results. Additionally, sensitivity analysis was conducted to assess the robustness of the joint model (Appendix L).
Leave-one-out cross-validation (LOOCV) approach was conducted for model validation. We calculated the area under the receiver-operating characteristic (ROC) curve (AUC) to assess the model performance [21, 32, 33]. A regular grid with a spatial resolution of 5 × 5 km2 was overlaid across Western Siberia and the Ural Region, resulting in 305,463 pixels [34]. The infection risk for each pixel was estimated annually from 1975 to 2019 using Bayesian kriging. Low, moderate, and high infection risk areas were defined by prevalence rates of \(<\) 5%, 5–20%, and \(>\) 20%, respectively, based on the WHO’s recommendation [35]. All the statistical process was done in R 4.3.1 (The R Foundation, Auckland, New Zealand) and risk maps were produced using ArcGIS 10.8.1 (Esri, Redlands, The United States). The provincial and regional infection risk were calculated based on population-weighted pixel-level infection risk.


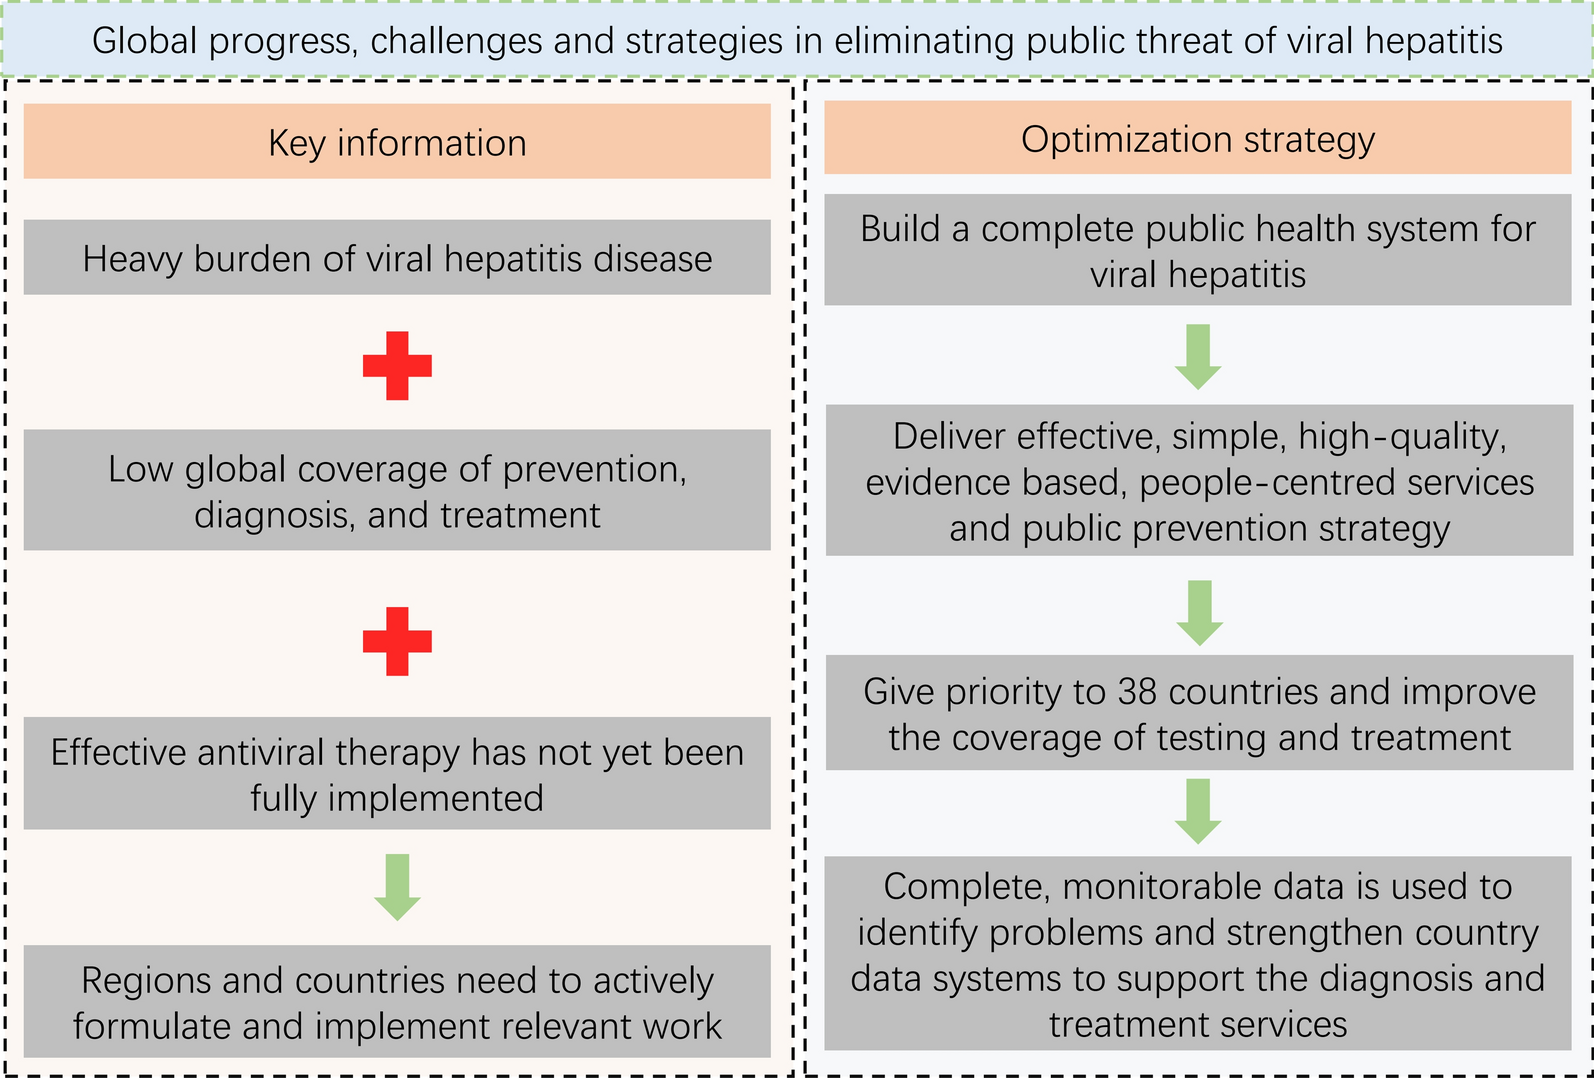

Comments (0)