Study population
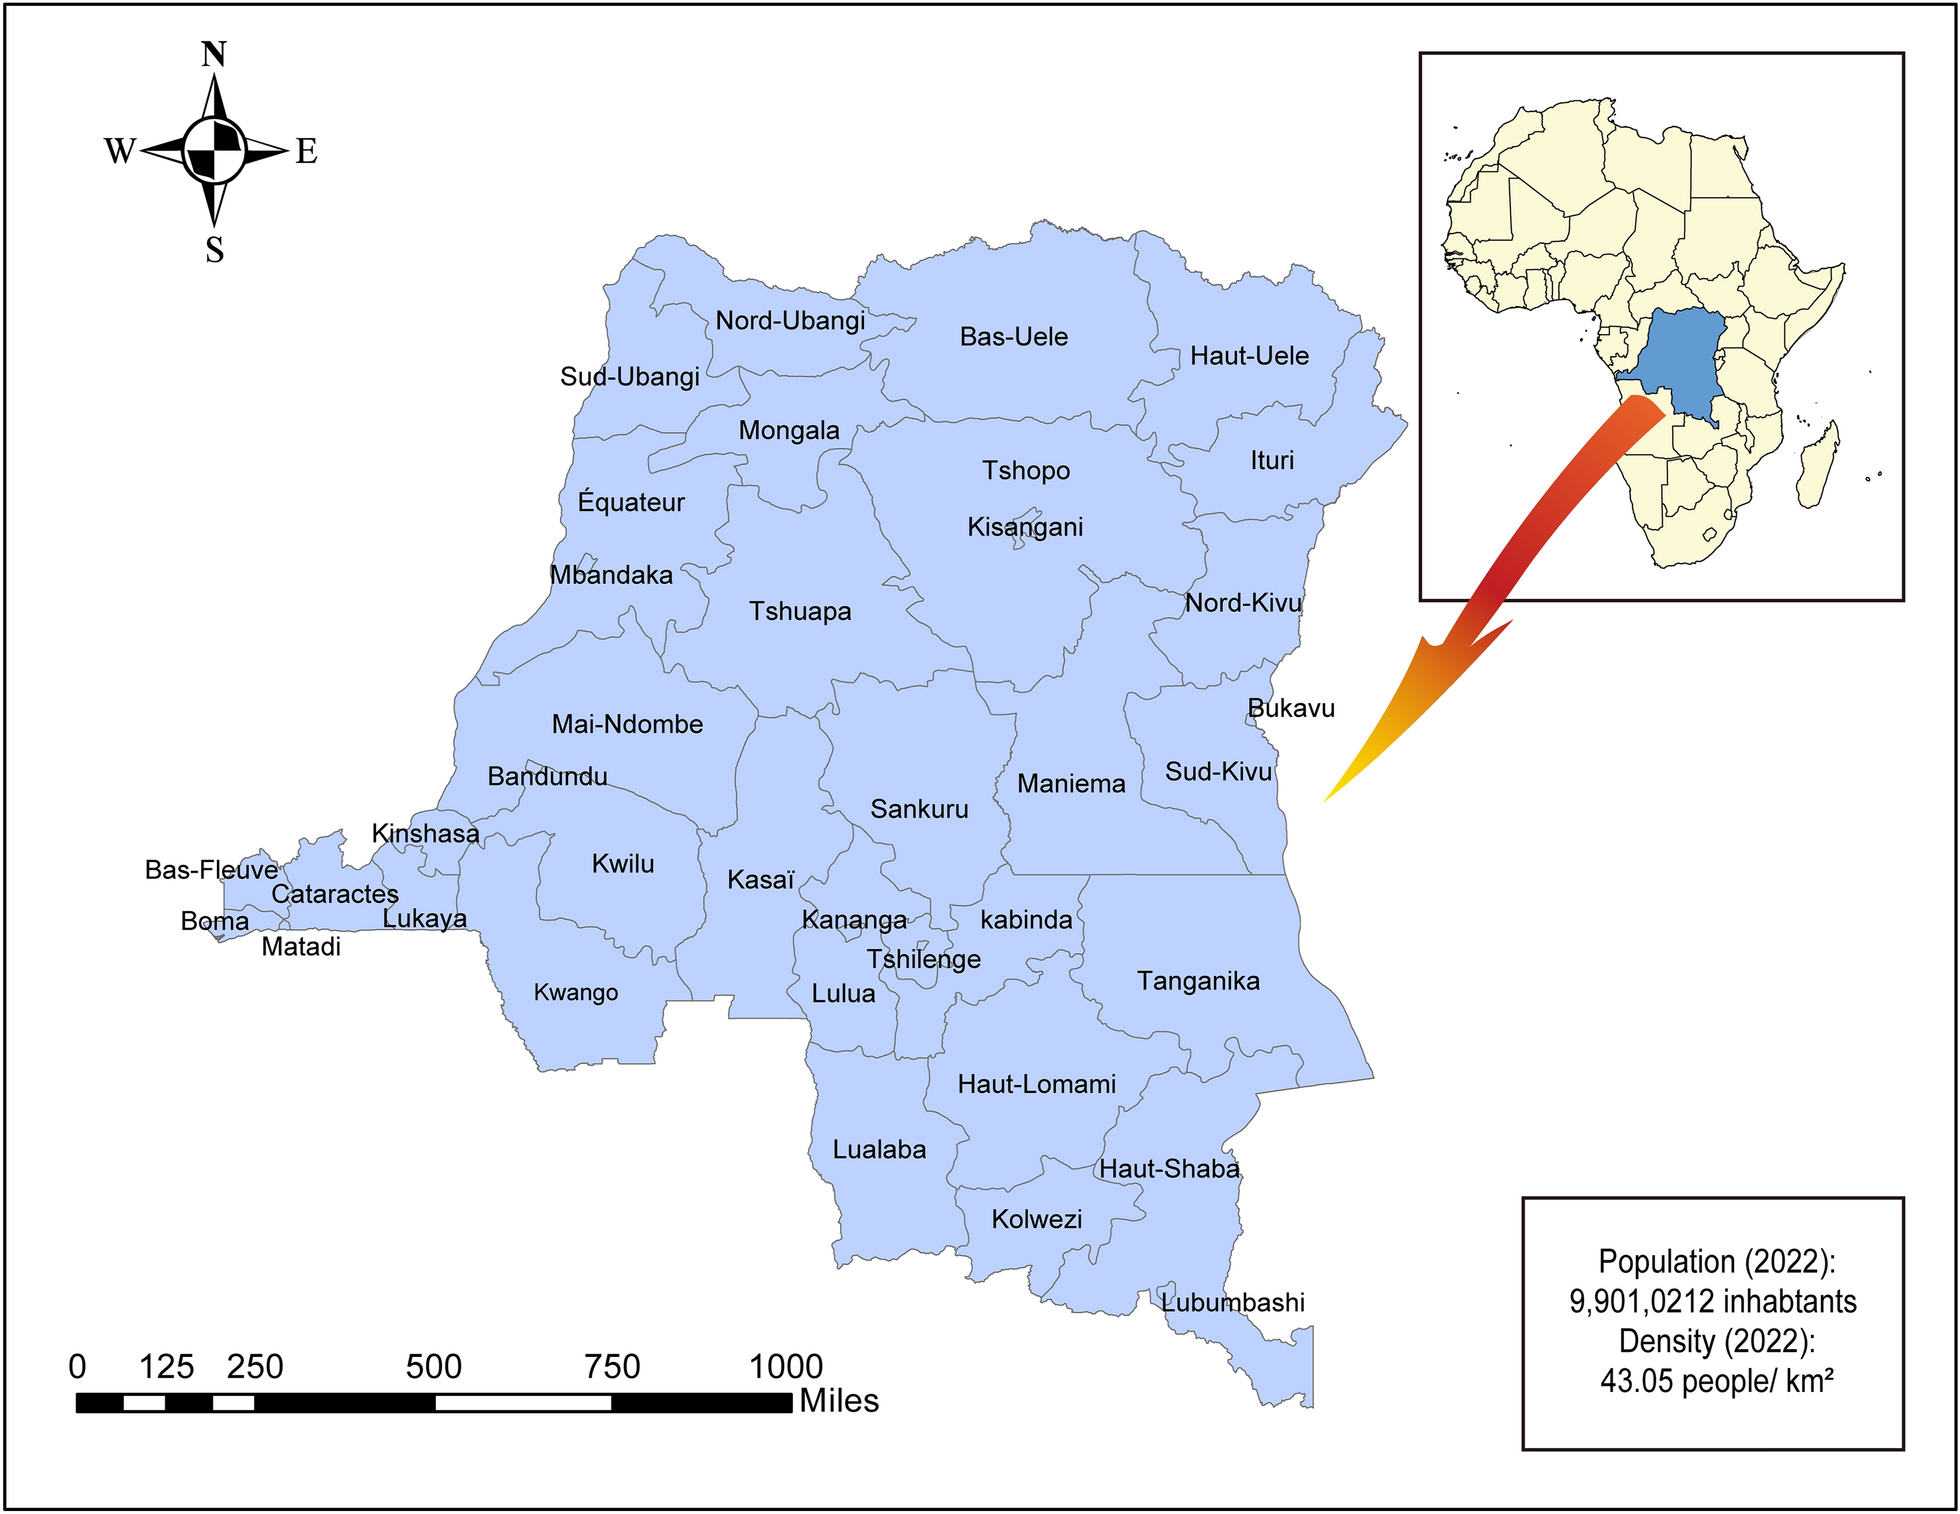
In this study, we used data from SEDSS, an ongoing facility-based study in Puerto Rico that tracks the frequency and causes of acute febrile illness [16, 17]. Our study included data from SEDSS from May 2012 to August 2024. SEDSS has included five sites: (1) Centro Médico Episcopal San Lucas (CMESL) in Ponce, a tertiary acute care facility (2012–present), (2) Hospital Episcopal San Lucas (HESL)—Guayama, a secondary acute care hospital (2013–2015), (3) Hospital de La Universidad de Puerto Rico in Carolina, another secondary acute care teaching hospital (2013–2015), (4) Centro de Emergencia y Medicina Integrada (CEMI), an outpatient acute care clinic in Ponce (2016–present), and (5) Auxilio Mutuo Hospital, a tertiary care facility in the San Juan Metro Area (2018–present).
Study enrollment and data collection
SEDSS enrolls participants using convenience sampling. Potential participants are identified by triage nurses as any patient with an acute febrile illness (AFI) defined by the presence of fever (≥ 38.0 °C for temperatures measured orally, ≥ 37.5 °C for temperatures measured rectally, and ≥ 38.5 °C for temperatures measured axillarily for both children and adults) at the time of triage or chief complaint of having a fever within the past seven days. During the Zika virus epidemic in Puerto Rico (June 2016–June 2018), patients were eligible if they presented with either rash and conjunctivitis, rash and arthralgia, or fever [18]. Starting in April 2020, patients with cough or dyspnea within the last 14 days (with or without fever) were also eligible to better capture respiratory viruses [19]. No age groups were excluded, although infants were only eligible for enrollment if they presented to the hospital after their initial discharge after birth. After meeting the inclusion criteria and being informed about the study, participants provided written informed consent. In cases where patients were incapacitated at the time of triage due to acute illness, consent was sought after their stabilization.
SEDSS collects data via patient interviews and medical record reviews at enrollment and convalescence (∼7–14 days later). The case investigation form (CIF) gathers information about patient demographics, comorbidities, and clinical features. The convalescent sample processing form (CSPF) echoes CIF data, adding the second specimen collection date and AFI severity indicators (hospitalizations, clinic visits). Inpatient medical data for participants with AFIs who were admitted to the hospital from CMESL, HESL-Guayama, and Auxilio Mutuo Hospital also were collected using a separate form (Hospital Admitted Abstraction Form) to collect key clinical indicators of disease severity and progression. For admitted patients, these data included information on extent and nature of hemorrhage, plasma leakage (e.g., ascites and pleural and cardiac effusions), hematologic indicators of increased intravascular permeability (e.g., hematocrit and serum albumin levels), additional blood pressure and heart rate measures to assess shock, and indicators of severe organ involvement (e.g., liver impairment, meningitis, and encephalitis) [17].
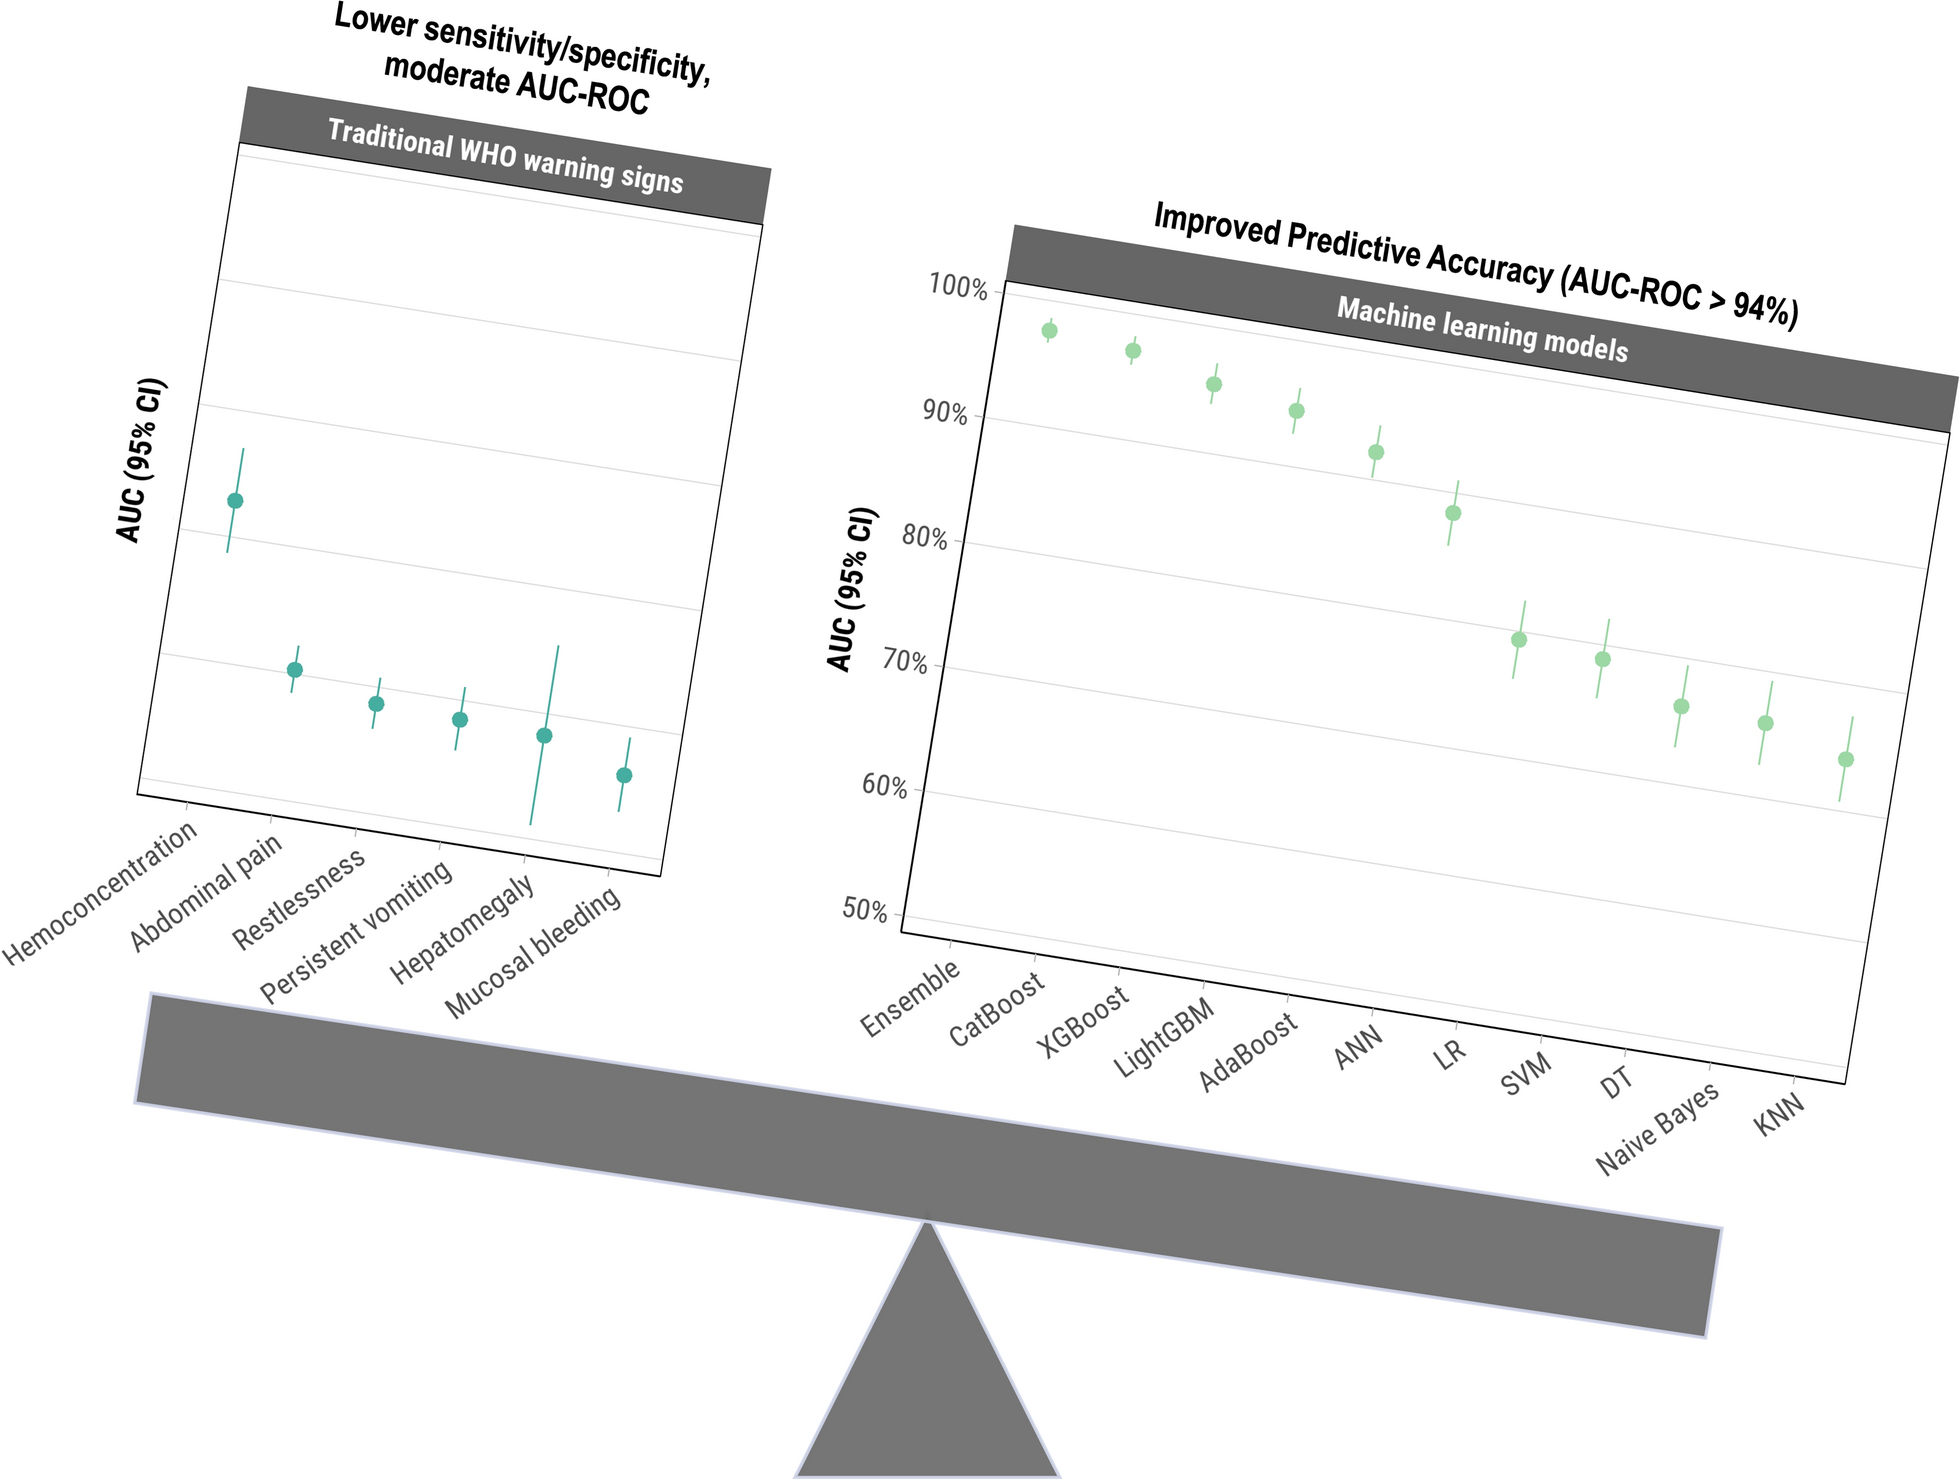
Dengue warning signs and severe dengue were defined by the World Health Organization [20], incorporating available clinical indicators from SEDSS intake and follow-up forms and abstracted inpatient medical records. Dengue warning signs were defined by abdominal pain or tenderness, persistent vomiting, plasma leakage (pleural or pericardial effusion or ascites), mucosal bleeding, restlessness, hemoconcentration (defined as either a hematocrit increase of ≥ 20% during illness or a hematocrit value ≥ 20% above baseline for age and sex), or hepatomegaly. Detailed definitions for these variables have been provided previously [21]. Severe dengue was defined as severe plasma leakage or shock, severe bleeding, or severe organ impairment [21]. The presence and overlap of warning signs among severe dengue cases were visualized using an Euler plot via the eulerr R package [22]. All analyses were done using R software, version 4.4.0 (R Foundation for Statistical Computing, Vienna, Austria) [23].
Sample collection and laboratory procedures
Blood, nasopharyngeal (NP), and oropharyngeal (OP) specimens were collected at enrollment from eligible participants. Additional blood samples (serum and whole blood) were also collected during the convalescent phase. Participation required providing at least one sample (blood or OP/NP swab). NP/OP swabs were collected for testing respiratory pathogens and are not the focus of this study. RT-PCR was conducted on specimens collected within the first 7 days post-onset to detect DENV, and ELISA for IgM antibodies was performed on specimens collected > 3 days post-onset to identify probable DENV infection [24]. The same standardized laboratory detection systems were used across all participating sites in SEDSS to ensure consistency in diagnostic methods.
Variables
A total of 40 variables were selected based on the WHO’s criteria for severe dengue, physicians’ clinical experience, and a review of current literature to potentially differentiate between severe and non-severe dengue cases [20, 21, 25,26,27,28]. These features included age group, days post onset of symptoms, clinical signs and symptoms, laboratory findings, pre-existing health conditions, and dengue virus serotype. Clinical symptoms included report of fever, rash, headache, myalgia, abdominal pain, chills, itchy skin, eye pain, nasal discharge, cough, sore throat, persistent vomiting, diarrhea, arthralgia, arthritis, back pain, calf pain, nausea, no appetite, and restlessness. Clinical signs, as observed by healthcare providers, included objective fever at the time of enrollment, yellow skin (jaundice), observed bruising, conjunctivitis, hepatomegaly, mucosal bleeding, pale skin, and blue lips (cyanosis). Clinical laboratory findings comprised leukopenia (defined as white blood cell count < 4000/mm3), the calculated value of hemoconcentration (an increase in the concentration of red blood cells due to plasma loss), and dengue immune status (primary or post-primary) as measured from results for anti-dengue virus immunoglobulin G (IgG) on or before day 5 of illness. Pre-existing health conditions like obesity (body mass index ≥ 30), gastritis, chronic arthritis, hypertension, chronic kidney disease, diabetes, thyroid disease, and high cholesterol were also considered. Additionally, dengue virus serotype was included, coded as “unknown” for probable cases identified through IgM ELISA, as serotype data was only available for confirmed reverse transcription polymerase chain reaction (RT-PCR) cases. Thrombocytopenia and clinical fluid accumulation were excluded from the analysis, as they generally manifest after the onset of severe disease or are components of its definition, making them less useful as predictive features. This comprehensive set of variables was intended to represent the multifaceted nature of factors influencing dengue infection severity.
Sensitivity analyses
To further explore the performance of the models in resource-constrained settings, where complete blood counts (CBCs), dengue immune status, and serotype information might not be readily available, we performed sub-analyses to evaluate model robustness and applicability. The sub-analyses included: (1) excluding results found on a CBC (i.e., leukopenia and hemoconcentration), (2) excluding IgG and serotype results, and (3) excluding leukopenia, hemoconcentration, IgG, and serotype results. These analyses were designed to assess how well the models could predict progression to severe dengue in various clinical scenarios, particularly where access to comprehensive clinical laboratory results or pathogen-specific testing might be limited.
To ensure the robustness of our models and account for potential confounding from co-circulating arboviruses, we performed a sensitivity analysis using CatBoost, the highest-performing individual ML model, excluding cases that tested positive for chikungunya virus (CHIKV) by either IgM or RT-PCR. This analysis aimed to confirm that the predictive features for severe dengue remain consistent even in the absence of CHIKV, given the potential overlap in clinical presentations between the two viruses. Additionally, we evaluated CatBoost performance separately for RT-PCR-confirmed and ELISA-probable cases to assess its applicability across sampling methods and collection timings.
Sampling
Our analysis included laboratory-confirmed dengue cases, confirmed by either molecular or serologic testing, focusing on differentiating between severe and non-severe cases. Due to an imbalance in the dataset, where non-severe cases were more prevalent, we used upsampling to balance the class distribution. Upsampling involved increasing the number of minority class samples (severe dengue cases) through duplication, which helps to prevent model bias towards the majority class and improves the model’s ability to accurately predict severe dengue cases [29]. Upsampling was done using the upSample function from the caret package in R [30]. To mitigate the risk of overfitting commonly associated with upsampling, we incorporated additional measures, including cross-validation and the use of regularization techniques within the ML algorithms. These strategies ensured that the models generalized well to unseen data by minimizing reliance on duplicated samples during training. Furthermore, model performance was assessed on a separate, unaltered test set comprising 30% of the original dataset, ensuring that evaluation metrics were not artificially inflated by the upsampling process. This partitioning, combined with robust evaluation, validated that upsampling improved model performance without compromising generalizability.
Machine learning models
An initial logistic regression (LR) model served as a baseline simple model to explore the relationship between potential predictors and the outcome of severe dengue. Stepwise selection, implemented using the stepAIC function from the MASS package in R [31], was used to iteratively add or remove variables to identify the optimal model with the lowest Akaike Information Criterion. This approach balances model complexity and goodness-of-fit by selecting variables that contribute significantly to the model. The final logistic regression model, derived from stepwise selection, was evaluated on both the training and testing sets.
In addition, we used nine ML methods to predict severe dengue and analyze feature importance. A comprehensive selection of models was used to leverage different strengths, enhance predictive performance, and provide a nuanced understanding of the factors contributing to severe dengue. The algorithms used include Decision Trees (DT), K-Nearest Neighbors (KNN), Naïve Bayes, Support Vector Machines (SVM), Artificial Neural Networks (ANN), Adaptive Boosting (AdaBoost), Categorical Boosting (CatBoost), Light Gradient Boosting Machine (LightGBM), and eXtreme Gradient Boosting (XGBoost). DTs create a tree-like structure to make predictions by recursively splitting the data based on feature values [32]. KNNs predict the class of a data point by considering the majority class of its closest neighbors in the feature space [33]. Naïve Bayes is a probabilistic classifier that applies Bayes’ theorem, assuming independence between predictors [34]. SVMs identify the optimal hyperplane to separate classes, making them effective for high-dimensional data [35]. ANNs are inspired by biological neural networks and consist of interconnected nodes that can capture complex patterns [36]. AdaBoost, CatBoost, LightGBM, and XGBoost are ensemble methods that combine multiple weak learners to improve predictive performance [37, 38]. AdaBoost adjusts weights to focus on difficult-to-predict instances, CatBoost handles categorical features effectively, LightGBM is efficient with large datasets due to its leaf-wise tree growth, and XGBoost uses regularization techniques to prevent overfitting, enhancing accuracy and robustness [37,38,39].
The hyperparameters (model-specific settings, such as learning rate, maximum tree depth, or number of estimators) for each ML model were carefully tuned using a grid search strategy to optimize performance. The area under the receiver operating characteristic curve (AUC-ROC) was used as the optimization metric, ensuring a focus on maximizing classification performance. We used fivefold cross-validation during model training to enhance robustness and mitigate overfitting. Specific details of the grid search strategy and parameters included in each model are provided in Table S1.
The following R packages were used for model implementation: rpart [40] for DT, e1071 [41] for Naïve Bayes and SVM, caret [30] for KNN, nnet [42] for ANN, keras [43] for DNN, ada [44] for AdaBoost, catboost [45] for CatBoost, lightgbm [46] for LightGBM, and xgboost [47] for XGBoost.
Ensemble model
To leverage the predictive power of multiple ML algorithms, we used an ensemble learning approach with a stacked generalization framework. This method combines the strengths of various individual models to improve overall predictive performance and robustness. We used predictions from LR and the nine different ML models as base learners in our ensemble. Specifically, we used a logistic regression model as the meta-learner to combine the outputs of the base models. This approach allows the meta-model to learn the optimal combination of base models’ predictions. To improve the performance of the meta-model, we again used stepwise selection with the stepAIC function from the MASS package [31].
Pearson correlation coefficients were calculated to measure the linear correlation between the predictions of the ML models. Comparing correlations provides insights into the degree of agreement between different ML approaches, which can highlight model consistency and reliability in capturing relevant patterns in the data. High correlations between models may indicate robustness in variable selection and prediction, whereas low correlations can signal differences in how models leverage the dataset. This helps assess whether ensemble approaches could enhance predictions by combining complementary model strengths. The results were visualized in a heatmap using ggplot2 [48].
Performance evaluation
Model performance for each ML model and the meta-model was evaluated on both the training and testing sets using AUC-ROC as the primary performance metric. AUC-ROC is an aggregate measure of performance across all possible classification thresholds, providing a comprehensive assessment of the model’s ability to distinguish between classes. We used the DeLong method to calculate the confidence intervals for the AUC-ROC to ensure accurate estimation of the model’s performance [49].
The performance of the ensemble model was further evaluated using several metrics, including accuracy, sensitivity, specificity, positive predictive value (PPV), negative predictive value (NPV), F1 score, and Cohen’s kappa. These metrics provide a comprehensive view of the model’s performance, capturing both the ability to correctly classify severe dengue cases and the overall agreement between predicted and actual classifications.
Feature importance
Feature importance was calculated for each ML model to quantify the contribution of each variable to the model’s predictive accuracy. This approach enables the identification of the most influential features, which enhances our understanding of the factors driving the predictions for severe dengue. Feature importance was assessed for both the 40-variable feature set and a subset excluding CBCs, IgG, and serotype results. Different methods were applied across the ML algorithms to determine feature importance. For ensemble-based methods, including XGBoost, LightGBM, and CatBoost, feature importance was calculated using the Gain metric, which measures the contribution of each feature to the model’s decision-making process. Gain represents the improvement in the model’s accuracy brought by a feature, with higher values indicating greater importance. For XGBoost, LightGBM, and CatBoost, we used the xgb.importance, lgb.importance, and catboost.get_feature_importance functions from the xgboost [47], lightgbm [46], and catboost [45] packages, respectively.
Permutation importance was applied to assess feature importance for KNN, Naive Bayes, and ANN. This method involves randomly shuffling feature values and measuring the subsequent decline in model performance. A substantial decrease in accuracy indicates a highly influential feature. For DT, feature importance was determined by the reduction in impurity (Gini index or entropy) achieved by splitting data based on that feature. AdaBoost assigned importance to features based on their contribution to correcting errors in subsequent models, with higher weights indicating greater influence. For SVM, feature importance was derived from the absolute value of the model coefficients. The magnitude of these coefficients reflects the influence of each feature on the decision boundary, with larger coefficients indicating greater importance.
We also calculated and plotted SHapley Additive exPlanations (SHAP) values for the top three performing models based on AUC-ROC. SHAP values provide a nuanced measure of each feature’s contribution to the prediction of severe dengue cases, enabling a deeper understanding of model decision-making. Positive SHAP values indicate a higher likelihood of severe dengue, whereas negative values suggest a protective effect. The SHAP approach is particularly valuable as it allows for the decomposition of the prediction into individual feature contributions, offering a clear interpretation of how different variables influence the model’s predictions.
Post-hoc variable reduction analysis
To assess the predictive performance of a simplified variable set, we conducted a post-hoc analysis using CatBoost, the ML model that achieved the highest AUC. This analysis aimed to identify the minimum number of features needed to maintain high accuracy. We began with the top features identified through SHAP values in the original 40-variable analysis, adding one feature at a time, starting with the highest-ranking. At each step, we evaluated the AUC-ROC to determine the impact of including additional features. The goal was to develop a more streamlined model that remains feasible and interpretable, especially in clinical settings with limited diagnostic resource.
Diagnostic accuracy of warning signs
In addition to ML, we evaluated the diagnostic accuracy of individual warning signs for identifying severe dengue cases. The performance of each warning sign was assessed using sensitivity, specificity, PPV, NPV, and AUC-ROC. Sub-analyses assessed the performance of warning signs by dengue serotype and immune status. Dengue serotype was determined via RT-PCR, whereas immune status was classified based on IgG antibody results in the first 5 days after illness onset (primary: IgG; post-primary: positive IgG). Cases lacking serotype or immune status data were excluded from sub-analyses. This approach aimed to identify potential clinical differences in the presentation and predictive capacity of warning signs for severe dengue across serotypes and infection statuses.
Ethics statement
The Institutional Review Boards at the Centers for Disease Control and Prevention (CDC), Auxilio Mutuo, and Ponce Medical School Foundation approved the SEDSS study protocols 6214, and 120,308-VR/2311173707, respectively. Written consent to participate was obtained from all adult participants and emancipated minors. For minors aged 14 to 20 years, written consent was obtained, and for those aged 7 to 13 years, parental written consent and participant assent were obtained.


Comments (0)