
Remember me
Participants were recruited between April and September 2022 through a database maintained by the principal investigator, physical advertisements posted throughout the City of Winnipeg, Manitoba, Canada and through social media. This involved posting advertisements on the social media pages associated with the research team and those aimed at Winnipeg-based parenting and food allergy communities. Families were eligible to participate if their annual net family income after deducting all federal, and provincial taxes, was less than $70,000 CAD and they had a child 12 or under who had an Immunoglobulin E (IgE) or non-IgE-mediated food allergy. To ensure individuals met the eligibility criteria, participants were asked to provide a proof of allergy letter from their child’s allergist or pediatrician. Any costs incurred by families to obtain the letter were reimbursed with study funds. Our a priori recruitment target for the study was 40 participants. A sample size of 40 was deemed to be appropriate given that it would afford an 80% chance of detecting a $45.00 dollar difference in costs between the case and control periods at a two-sided alpha value of 0.05 and a standard deviation of $100.00 between the two conditions. All participants were enrolled by the first author.
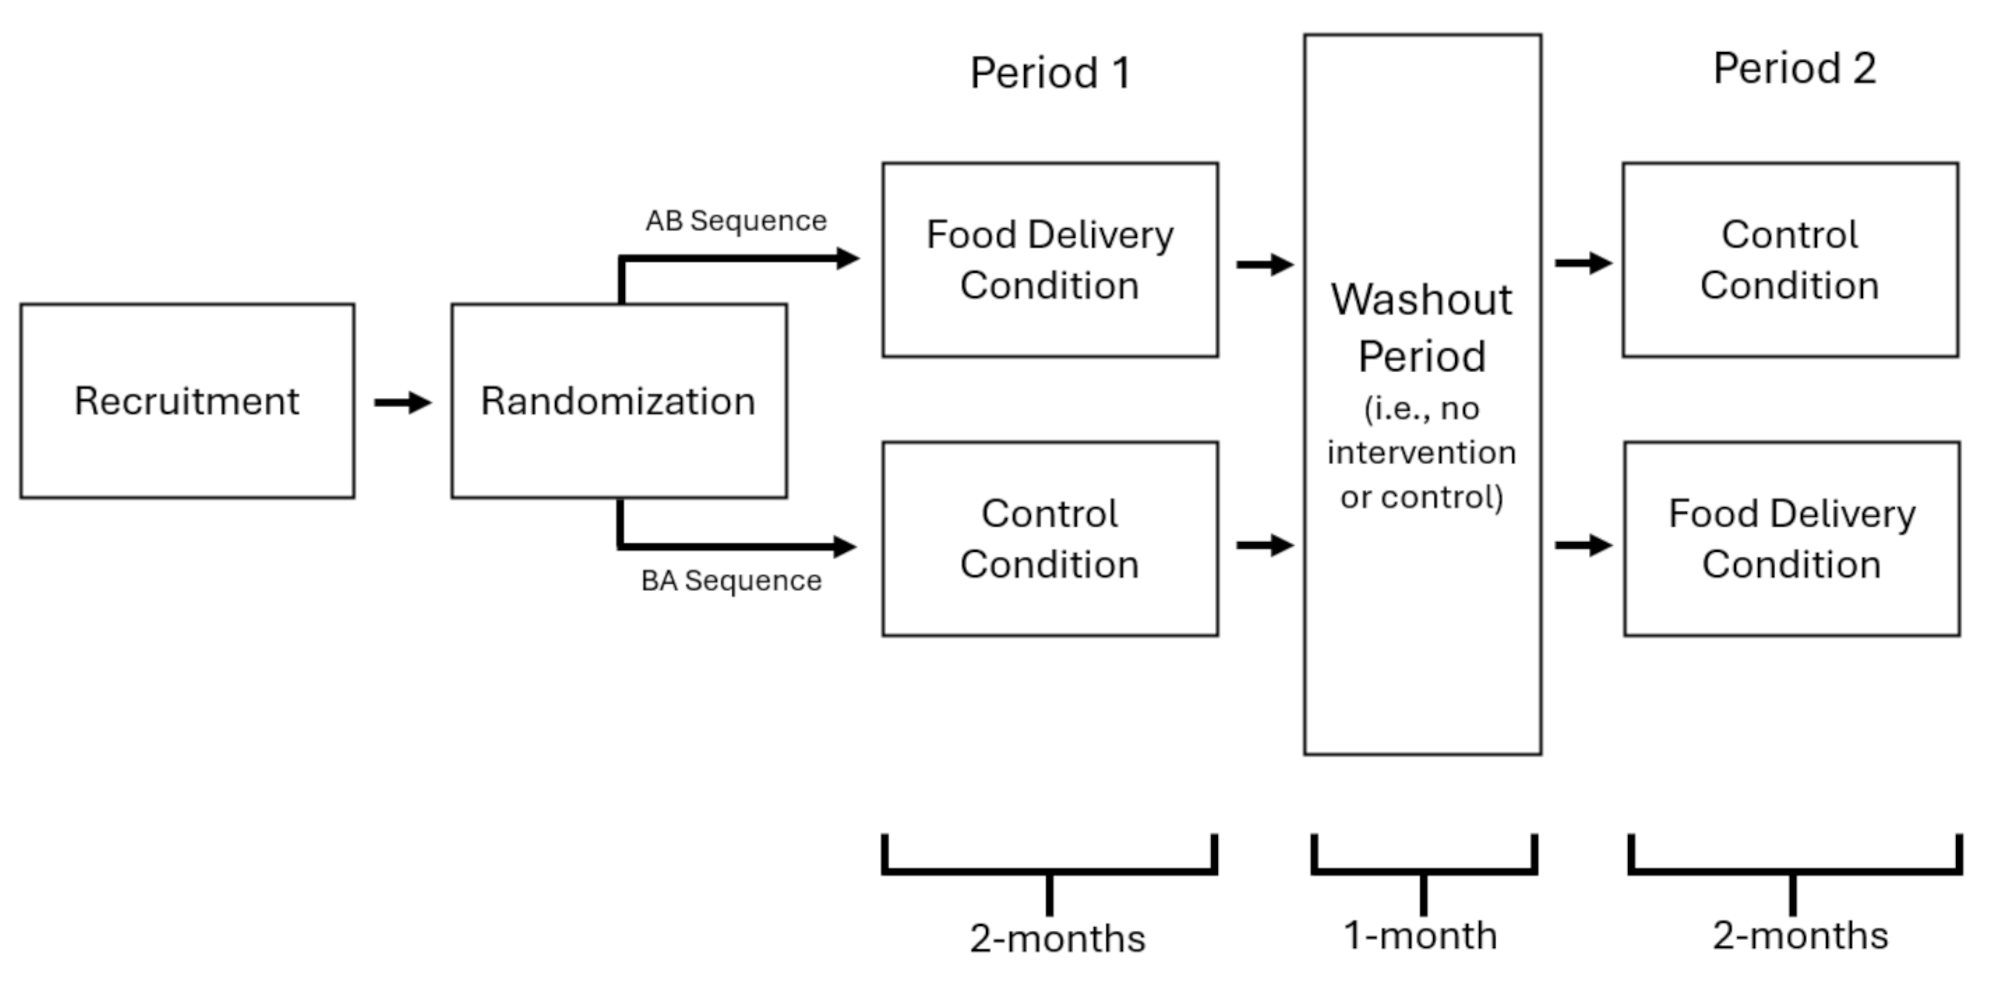
Intervention and designThe current study employed an AB/BA crossover design (See Fig. 1 for a visual representation). In this design, “AB/BA” is used to denote how the experimental conditions are ordered. Participants randomized to the AB sequence began the study in the case condition (i.e., A condition) and then moved to the control condition (i.e., B condition), while those in the BA sequence started the study in control condition (i.e., B condition) and then progressed to the case condition (i.e., A condition). This design was selected over parallel group designs for both ethical and statistical reasons. Because crossover designs compare the effect of the intervention within participants, they tend to be more powerful than parallel group designs. Moreover, they also afford all participants the opportunity to reap the potential benefits of the intervention because each individual participates in both the case and control condition.
The study’s design was informed by the CONSORT 2010 statement: extension to randomized crossover designs (please see Additional File 1 for a completed CONSORT checklist) [20]. Families who met the eligibility criteria and provided their informed consent were randomized to start the study in either the case (i.e., A) or control (i.e., B) condition. Randomization was performed by the first author, in Stata, using code disseminated by the World Bank [21]. In this approach, each participant is assigned a random number between 0 and 1, using the “runiform” function and then rank ordered based on their randomly assigned number. Participants whose random number placed them in the lower half of the sample were assigned to begin the study in the control condition, while those in the greater half were assigned to the case condition (hereafter referred to as the “food delivery condition”). This meant 50% of participants were assigned to begin the study in the food delivery condition and 50% were assigned to begin in the control condition. Given that the intervention consisted of biweekly deliveries of allergy-friendly foods, it was not feasible to blind the experimenters or the participants to the assigned sequences.
Fig. 1
Overview of the AB/BA crossover design
Participants randomized to begin the study in the food delivery condition received an allergy-friendly food basket every two-weeks for two months (i.e., period 1). Each basket was delivered to the participant’s home via contactless delivery by a pair of research assistants and contained allergen-friendly recipes, food products, and coupons for allergen-friendly food. Each basket was valued at approximately $75.00 CAD. Roughly 40%-50% of the basket’s total value was comprised of allergen-friendly food products and coupons donated by Daiya Foods Inc. These included allergen-friendly cheese products, convenience foods like macaroni and cheese, and coupons for free Daiya products. The other 50–60% of the basket’s value was largely devoted to ingredients that families could use to make the allergen-friendly recipe that was included in each package. If the value of the package was still under $75.00 after purchasing these ingredients, the remaining budget was spent on allergen-friendly staple items or snacks. Please see Additional File 2 for an example of the types of items included in the baskets.
Individuals who began the study in the control condition were provided with allergen-friendly recipes and food allergy-related management information every two weeks over the course of the first, 2-month study period. Following the initial period, both groups entered a 1-month washout period in which neither group received allergen-friendly foods, recipes, or other materials. This period was primarily aimed at ensuring families in the food delivery condition had ample opportunity to consume the food they were provided before crossing over into the control condition. At the end of the washout period, the experimental conditions were switched. This meant participants who received food packages and recipes in the first period began receiving educational materials and recipes; whereas, participants who began the study receiving educational materials and recipes received biweekly deliveries of food packages and recipes throughout the 2nd study period.
Mixing of methodsThe study employed a concurrent nested mixed-methods design. In this approach, the qualitative and quantitative data are collected concurrently, but one method is given priority [22]. Given that the current project was focused on financial costs, the quantitative data were primarily of interest, while the qualitative data were used to help explain the quantitative findings. The quantitative data were collected online through a series of questionnaires that participants completed about six weeks after the beginning of each condition. In addition to the quantitative measures, participants were also asked to complete a series of two phone interviews. One interview was completed near the end of the food delivery condition and the other near the end of the case condition. After the quantitative and qualitative data were collected and analysed, the findings from these two methods were integrated. The results from this integration are described in the discussion section of the current publication.
MeasuresFood allergy-related costs were a primary outcome of the current study and were measured using the Food Allergy Economic Questionnaire (FA-EcoQ), a validated, self-report measure designed to assess the direct and indirect costs associated with food allergy [23]. Direct costs describe out-of-pocket medical and non-medical expenses associated with the maintenance of one’s health [9]. Indirect costs, on the other hand, include costs stemming from lost time or productivity [9]. In the present study, direct costs included those incurred through the purchase of medication, groceries, and prepared meals (e.g., takeout, fast-food, and other restaurant meals). Indirect costs included lost time from work or school due to the child’s food allergy and time spent grocery shopping and preparing meals. Indirect costs were derived using a human capital-based method in which the number of hours lost were multiplied by the after-tax hourly wage reported by the family member incurring the cost [24]. If an individual was unemployed, their time was valued at the provincial after-tax minimum wage at the time of data analysis (i.e., $11.95 CAD). All reported costs reflect the previous month, unless stated otherwise.
As part of the FA-EcoQ, participants were also asked to complete several demographic questions related to the age, gender, education, and health history of each of their household’s members. The questionnaire also contained items related to employment and household income. In order to ease the burden on participants, several items that were irrelevant to the aims of the current study were omitted from the FA-EcoQ.
Qualitative data collectionQualitative data were collected from participating caregivers through a series of two phone interviews conducted approximately one week before the end of each study condition. Each interview was led by trained research assistants and made use of a semi-structured interview guide. The guides were tailored to the experimental condition that preceded the interview, but also contained some general questions on the costs of food allergy that were common to both interviews (Both guides can be found in Additional File 3).
Data analysesDescriptive analyses were used to characterize the composition of the sample. Afterwards, a series of linear mixed models were used to assess quantitative changes in costs between the food delivery and control conditions. Similar to multiple linear regression, linear mixed models can be used to assess the relationship between a continuous outcome variable and a series of predictors. However, unlike multiple regression, linear mixed models can handle repeated-measures data by modelling the correlation between repeated observations in the same participants (Interested readers can find a general equation that describes the conceptual basis of linear mixed models in Additional File 4). In each of the models used in the current study, condition (food delivery vs. control), period (fall vs. winter), and sequence (AB vs. BA) were specified as fixed effects, while participant was specified as a random effect to account for the non-independence between time-points. Given the small size of the sample, the Kenward-Rogers approximation was used to calculate the degrees of freedom for testing the fixed effects [25]. Stata 18 was used for each of these analyses (StataCorp; College Station, TX).
Qualitative data stemming from the interview transcripts were analysed by the second author through thematic analysis [26]. In this approach, the analyst organizes the data by applying short descriptions (i.e. codes) to relevant sections of text. In the current study, the analyst first read the transcripts to become familiar with their content. Following this initial reading, the transcripts were coded and afterwards the codes were reviewed for their inappropriateness. Inadequate codes were then revised, before a final coding of the transcripts was completed. Once coding was complete, the analyst looked for broader patterns among the codes, which are referred to as themes in the language of thematic analysis. Unlike codes, which typically express one idea, themes describe broad patterns in the data related to the research question and contain several different aspects organized around a central concept [26].
Comments (0)