
Remember me


Nineteen undergraduate and graduate students (13 women; mean age: 21.2 ± 2.0 [standard deviation: SD] years) were recruited. The sample size was determined by a priori power analysis using G*power (version: 3.1.9.4). In our power analysis, we used the medium effect size as the smallest effect size of interest because we wanted to ensure replicability of the effect, if detected. The power analysis suggests that for a medium-effect size (f = 0.25; Cohen 1992), a sample size of 14 participants was required (α error probability = 0.05, power [1 − β error probability] = 0.80) for an analysis of variance (ANOVA) with two within-participants factors of box (2; with-box and without-box) and distance (5; nearest to farthest distances) conditions for measuring trunk-centered PPS. Finally, we adopted 19 because we expected several dropouts. Excluding five dropouts, we finally analyzed the 14 participants (12 women; mean age: 20.7 ± 1.2 [SD] years) who completed both Experiments 1 and 2. Twelve of the fourteen participants were right-handed. The Chapman handedness questionnaire was used to evaluate each participant’s dominant hand (Chapman and Chapman 1987). All participants also reported normal or corrected-to-normal vision, normal touch sensation, and no vestibular system disease. All participants were unaware of the purpose of the experiments. This study was approved by the Ethics Committee of the Graduate School of Humanities and Social Sciences, Kumamoto University, and was conducted in accordance with the principles of the Declaration of Helsinki (1964). Written informed consent was obtained from all participants before they commenced their participation.
Apparatus and stimuliAll the visual stimuli were presented using a head-mounted display (HMD; VIVE Pro Eye; HTC Corporation). We used our virtual reality environment, which successfully measured trunk-centered PPS in our previous study (Kuroda and Teramoto 2021). A rectangular parallelepiped tunnel consisting of left–right walls, a floor, and a ceiling (11.8 m [horizontal] × 10 m [height] × 21 m [depth]) was simulated in the virtual reality environment. The walls were covered with a square wave grating (dark grey and white pattern, each striped width: 2.1 m) perpendicular to the depth direction, which provided a depth cue. In the virtual environment, the participants viewed all the visual stimuli at 1.2 m height from the floor, 5.9 m from both sidewalls, and 1.0 m from the entrance of the tunnel. Therefore, the participants perceived themselves as being located at the center of the tunnel. A large box (color: black; size: 0.9 m3) was used to fix the body in a real environment, and participants were not able to move their trunks but could slightly move their legs within the box. The same size and colored boxes were simulated in the virtual reality environment. The fixation point was a red sphere (diameter: 2.0 cm) located 0.95 m above the floor and 1.8 m ahead of the participants along the midsagittal plane. To measure the trunk-centered PPS, a purple sphere (diameter: 2.0 cm) was used as the approaching probe. It was located 0.95 m above the floor. The initial position of the probe was either at 0.69 m, 1.29 m, 1.89 m, 2.49 m, or 3.09 m. The probe moved at 0.09 m/s for 1.0 s based on a previous study (Teramoto 2018), reached up to 0.6 m, 1.2 m, 1.8 m, 2.4 m, or 3.0 m, respectively, and then vanished. The probe size was presented without correction for retina size, resulting in an increased visual angle as the probe moved nearer.
To present a tactile stimulus, we utilized a vibrotactile stimulator with a 0.95 cm diameter (Vibrating Mini Motor Disc #1201; Adafruit, USA). The vibrotactile stimulator was set to vibrate at a 300-Hz frequency for 100 ms at an amplitude far above the detection threshold. As tools to measure subjective body immobilization, a white bar (size: 1.0 m [horizontal] × 0.02 m [vertical]) and a red bar as a marker (size: 0.01 m [horizontal] × 0.2 m [vertical]) were simulated in the virtual reality environment. A gamepad (Gamepad F310; Logicool) was used as the response device. All stimuli were controlled by Unity (Unity Technologies, USA; version: 2019.4.4) on a computer (GALLERIA ZG, Thirdwave Corporation) running 64-bit Windows 10.
Visuotactile taskWe measured the trunk-centered PPS using a visuotactile procedure (Teramoto 2018) in our virtual reality system (Kuroda and Teramoto 2021). In the visuotactile procedure (Teramoto 2018), the visual probe approached the participant’s body at a constant speed (0.09 m/s) for 1 s from one of several distances and then disappeared. The participants were tasked with responding as soon as possible to tactile stimuli delivered to their chest while seeing an approaching visual probe against a static background. This paradigm was designed to minimize the effects of time expectancy (Holmes et al. 2020; Kandula et al. 2017; Noel et al. 2015) because a visual probe moved toward participants a short distance in each distance condition (no overlap in the probe trajectory between distance conditions), and each distance condition had equal tactile delays. The time expectancy effects indicate that a longer delay in tactile onset can speed up the response to the tactile stimulus. While some previous studies used the fastest RTs when only the tactile stimulus was presented as the baseline to minimize this time expectancy effect (e.g., Noel et al. 2015; Serino et al. 2015), the procedure cannot directly exclude the effect. Unlike previous studies, we independently presented a visual probe for 1 s for each distance condition. Thus, our paradigm had equal time expectancy effects across distance conditions (Kuroda and Teramoto 2021, 2022; Teramoto 2018; Teraoka et al. 2024): a nearer probe never has a higher time expectancy than a farther probe. The PPS range is defined as the distance at which the visual probe facilitates tactile detection.
ProcedureThe experimental design consisted of two within-participants variables: box condition (with-box and without-box) and probe distance condition (0.6 m, 1.2 m, 1.8 m, 2.4 m, and 3.0 m).
The participants sat on a chair with an HMD worn on their heads. The participant’s whole-body was immobilized using the box in the with-box condition, where the chest, shoulders, and back of the participants were in contact with the box. The vibrotactile stimulator was attached to participant’s chest at 5 cm above the top of the box (the simulator height: 0.95 m above the floor; the box height: 0.9 m above the floor). In the without-box condition, participants observed visual stimuli without using a box to immobilize their bodies. In the virtual reality environment, we simulated the same size and colored box as in the real environment in each with-box condition and provided a visual cue that the observer was in a box. Participant’s body was not presented in the virtual reality environment however, participants could see the box below the field of view, allowing them to maintain the perception of being inside it (Fig. 1).
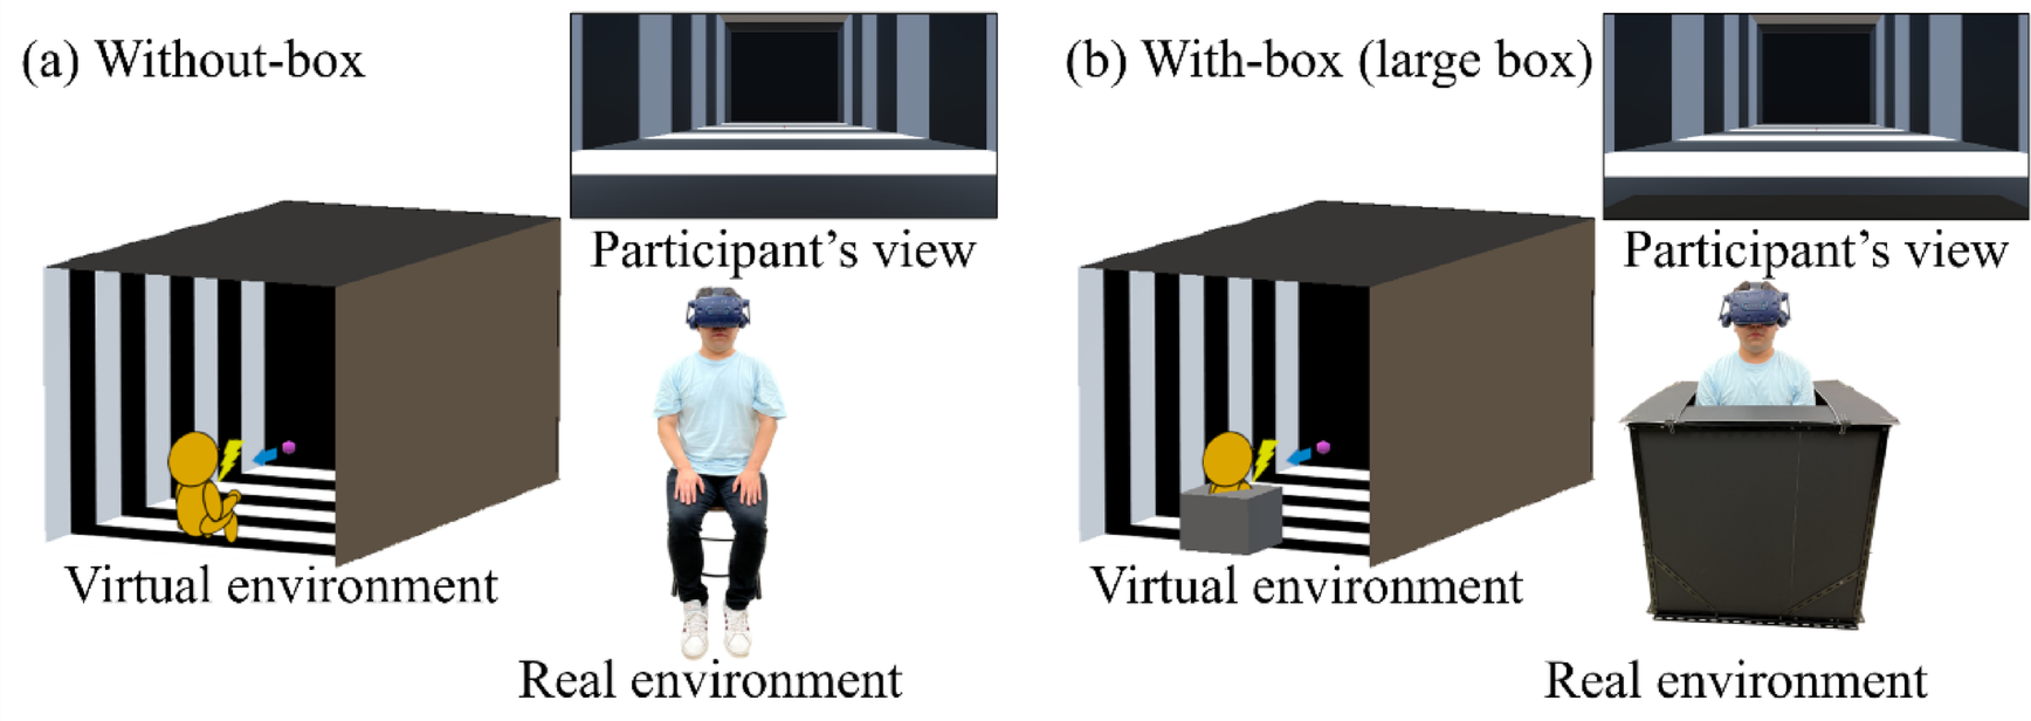
Fig. 1
A schematic diagram of the virtual reality environment presented through a head-mounted display and the real environment. (a) and (b) indicate each of box conditions conducted in Experiment 1. In the virtual environment, a rectangular parallelepiped tunnel covered with black and white striped pattern (each striped width: 2.1 m) were illustrated. In the with-box condition, the box placed in the real environment was also visually simulated in the virtual environment. Although participants’ bodies were not presented in the virtual environment, they could see the simulated box below the field of view, allowing them to maintain the perception of being inside it. A purple sphere (probe, 0.95 m height from the floor) appeared at several distances and approached for 1 s. Participants were tasked to respond as quickly as possible to a tactile stimulus delivered to their chest with and without body immobilization by the box
Each box condition was tested in a different session. Each session included probe and baseline trials that presented tactile stimuli with and without the probe, respectively. Baseline trials were included as a baseline tactile detection measure to clarify the visual facilitation effects and estimate the PPS boundary. At the beginning of each trial, the fixation was presented for 0.5 s, and disappeared. One second after the fixation disappearance, the probe appeared in one of distance conditions and approached the participants for 1.0 s in the probe trials, while the tactile stimulus was presented at either timing of 0.25 s, 0.5 s, or 0.75 s after the probe’s onset. In the baseline trials, the probe was not presented and the tactile stimulus was delivered with a delay of either 1.25 s, 1.5 s, or 1.75 s after the disappearance of the fixation. Thus, delays in tactile stimulation from fixation disappearance were consistent in both the probe and baseline trials. In addition to these probe and baseline trials, no vibrotactile stimulus was delivered in catch trials to avoid automatic motor responses to tactile stimuli, whereas the probe was presented in some trials and not in others. The participants were tasked with responding as quickly as possible to the tactile stimulus when presented with their dominant index finger using the response device. The next trial started after 3.0 s–4.0 s from the disappearance of the fixation point.
Each box condition had one session of 84 trials: 60 probe trials (5 distances × 3 timings × 4 repetitions), 12 baseline trials (3 timings × 4 repetitions), and 12 catch trials (with probe: 5 distances × 2 repetitions; without probe: 2 repetitions). Each trial was conducted in random order in each session. The order of the box conditions was counterbalanced across the participants.
Immediately after each session, while wearing the HMD, the participants were asked to evaluate how much they felt unable to move their body in the given experimental condition using a visual analog scale (white bar). The bar was placed 5 m ahead at the center of the display and 1 m above the floor in a VR environment. The midpoint of the bar was aligned with the midsagittal plane. The participants moved the marker horizontally using the response device. The left and right ends of the white bar indicate “easy to move” and “hard to move,” respectively. The scale was in centimeters in the virtual reality coordinates. The participant’s answer was transformed to a value (0–100: “easy to move” to “hard to move”) and was recorded. A short break was given between sessions.
Before the series of main sessions, a practice session was conducted without a box. The practice session consisted of one session of 42 trials: 30 probe trials (5 distances × 3 timings × 2 repetitions), 6 baseline trials (3 timings × 2 repetitions), and 6 catch trials (with probe: 5 distances × 1 repetition; without probe: 1 repetition). Unlike in the main session, the accuracy and reaction time (RT) (if any) of the responses were recorded immediately after each trial. All sessions took approximately 30 min.
Statistical analysisAnalyses were performed using JASP (version 0.17.3.0; https://jasp-stats.org/), R (version 4.2.0), and MATLAB (version R2020b).
Analyses of visual facilitation effectsRTs in the probe and baseline trials were utilized to investigate PPS boundaries. The outlier trials were defined as those where RTs exceeded ± 2 standard deviations (SD) from the mean across all trials in each distance in each box condition. These trials were excluded from the following RT analyses and were regarded as miss trials. The tactile timings from the fixation disappearance (1.25 s, 1.5 s, and 1.75 s) were set to just prevent the participants from predicting tactile onset, so that these timings were collapsed for the analysis. Participants’ mean RTs for the probe trials (probe RTs) were calculated for each distance in each box condition. Those for the baseline trials (baseline RTs) were calculated for each box condition because they did not have distance variables. The baseline RTs were then subtracted from the probe RTs at each distance for each box condition (visual facilitation effect). In the subtracted data, positive and negative values indicate visual interference and visual facilitation effects, respectively. If the approaching probes had no effect on tactile detection, the value of the subtracted data should be zero. We defined larger visual facilitation effects as larger interactions between body and the environment in PPS (De Paepe et al. 2016; de Haan et al. 2016; Fogassi et al. 1996). In addition, the PPS boundary was defined as the farthest distance at which visual facilitation effects remained. The Shapiro–Wilk tests revealed violation of normality assumption in the visual facilitation data at several distances. To clarify the PPS boundary, we performed one-sample Wilcoxon signed-rank tests (Holm corrected) against zero for each distance in each box condition. To investigate the differences in visual facilitation effects between the box conditions, we performed a two-way repeated-measures analysis of variance (ANOVA) (box × distance) on the aligned rank-transformed (ART) data using the ARTool (Elkin et al. 2021; Wobbrock et al. 2011) package for R. In addition, to reveal whether the baseline RTs between box conditions were not significantly different, we conducted a Wilcoxon signed-rank test because the Shapiro–Wilk tests indicated a violation of the normality assumption in the without-box condition.
Analyses of perceived body immobilizationThe Shapiro–Wilk tests showed normal distribution of the values for perceived immobilization in both box conditions. A paired Student t-test was performed.
Analyses of error rates and startle responsesThere are two types of error trials: miss and false alarm (FA). Miss trials included trials with no response in the probe and baseline trials, and the outlier trials described above. Trials in which participants responded mistakenly in the catch trials were counted as FAs. The Shapiro–Wilk tests showed normal and violated normal distributions in the miss and FA rates, respectively. Thus, the miss and FA rates were analyzed using a paired Student t-test and a paired Wilcoxon signed-rank test, respectively, to investigate the differences in the speed-accuracy trade-off between the box conditions. Moreover, we analyzed d-primes calculated from miss and FA rates based on signal detection theory (Peterson et al. 1954; Tanner and Swets 1954). We performed a paired Wilcoxon signed-rank test for d-primes between the box conditions because these d-primes included FAs that violated normality assumption.
Startle response is a phenomenon in which participants are surprised at a stimulus to which their responses get faster (Graziano and Cooke 2006). We conducted the following analyses to investigate whether the differences in visual facilitation effects between the box conditions were induced by differences in startle responses. Probe presentation at the nearest distance was expected to induce the strongest startle response (Kuroda and Teramoto 2021, 2022). In general, startle responses decrease rapidly when stimuli are presented repeatedly (Graziano and Cooke 2006). Based on our previous studies (Kuroda and Teramoto 2021, 2022), the probe RTs in the nearest distance condition (0.6 m) were divided into the first and second halves of the session in each box condition and averaged for each half-session in each box condition. If startle responses strongly affected the visual facilitation effects, the first half of the RTs would be faster than the second half. The Shapiro–Wilk tests revealed violation of normality assumption in all RTs of the first and second halves of the session. We conducted a paired Wilcoxon signed-rank test between the first and second halves of the RTs for each box condition.
Holm correction was applied to multiple comparisons and denoted as adjusted p-values (pholm). In each analysis, effect sizes were determined using Cohen’s d (absolute value), Cliff’s d (absolute value), or partial Eta squared (ηp2).
Results and discussionsRaw data (anonymized) are available at Open Science Framework (https://osf.io/5dvek/). Figure 2a shows the visual facilitation effect as a function of the distance for each box condition (see a supplementary file for individual plots). One-sample Wilcoxon signed-rank tests revealed significant visual facilitation effects for all distance conditions in the with-box [Vs < 1.01, pholm < 0.001] and without-box conditions [Vs < 0.01, pholm < 0.001]. These results suggest that the PPS boundary in both conditions is outside the range measured in this study. A two-way ANOVA with ART revealed significant main effects of box [F (1, 117) = 31.86, p < 0.001, ηp2 = 0.21] and distance [F (4, 117) = 7.10, p < 0.001, ηp2 = 0.20], but no interaction [F (4, 117) = 0.35, p = 0.841, ηp2 = 0.01]. The visual facilitation effect was significantly greater in the with-box condition than in the without-box condition. A multiple comparison for the main effect of distance revealed a significant difference between the 0.6 m and other distance conditions, suggesting that the visual facilitation effect decreased with increasing distance. As for baseline RTs, a Wilcoxon signed-rank test revealed non-significant differences between the box conditions [V = 26, p = 0.100, Cliff’s d = 0.13], suggesting that the box had no effect on the tactile-only responses.
Fig. 2
Results of the visual facilitation effects (a) and perceived whole-body immobilization (b) in Experiment 1. a Each plot represents an average of visual facilitation effects across participants as a function of distance in each box condition. Each distance function was illustrated slightly lateral shifted for a visibility purpose. The values were calculated by subtracting the baseline RTs from the probe RTs in each distance in each box condition. Negative and positive values indicate visual facilitation and interference effects, respectively. b Each bar graph represents an average of perceived whole-body immobilization across participants in each box condition. Larger values indicate that participants perceive to be more immobile. Error bars indicate standard errors. ****p < .001
Figure 2b shows the mean perceived body immobilization across participants for each box condition. A paired Student t-test revealed significantly perceived immobility in the with-box than without-box conditions (t (13) = 6.15, p < 0.001, d = 1.64) so that our manipulation using the box succeeded.
The miss rates (± SD) were 6.2% (± 0.6%) and 5.2% (± 0.6%) in the with-box and without-box conditions, respectively. The FA rates were 0.6% (± 0.6%) and 1.8% (± 1.3%) in the with-box and without-box conditions, respectively. A paired Student t-test and paired Wilcoxon signed-rank test revealed no significant differences between the box conditions for miss rates [t (13) = 1.11, p =.286, d = 0.43] and FA rates [W = 4.50, p =.586], respectively. For d-primes, a paired Wilcoxon signed-rank test revealed no significant differences [W = 47.50, p =.500]. Thus, the effect of the speed-accuracy trade-off on the difference between the box conditions was negligible. In addition, paired Wilcoxon signed-rank tests revealed no significant differences between the RTs in the first and second halves of the session in each box condition [Ws > 27.99, ps >.134], suggesting that the differences in startle responses between the box conditions cannot fully explain the difference in the visual facilitation effect between them.
The results of Experiment 1 suggest that the visuotactile interaction can be stronger when it is difficult to move the whole-body. The main effect of the box was significant, with visual facilitation effects being greater in the with-box than without-box conditions. Furthermore, the main effect of distance was also significant, as visual facilitation effects decreased at farther distances. In addition, there was no significant difference in baseline RTs between the box conditions. Although we did not clearly estimate PPS boundary, taken together the significant main effects and the non-significant baseline RTs, support the speculation that PPS boundary might be located at a farther distance in the with-box than without-box condition. The participants perceived themselves as more immobile when restricting their whole-body movements using the box, suggesting that body immobilization affected visuotactile facilitation. However, another interpretation would be also raised. There is a possibility that the embodiment of the box could have been induced, and the visuotactile interaction might have been stronger, corresponding to the box itself. Previous studies have reported that when humans continue to use a tool (e.g., a stick) with their hand, they take the tool into their bodies (Maravita et al. 2002). This phenomenon can be induced in virtual environments (D’Angelo et al. 2018). Although these findings assume active tool use, studies on rubber/mirror hands in the real environment suggest that a tool could be embodied not by actively using it but just by seeing it (Holmes and Spence 2005; Litwin et al. 2020).
Comments (0)