
Remember me

This study used the same data source, data extraction, sample selection, and UDS variables as those reported by Schumacher et al. [22], and a similar data analytic strategy. The following subsections summarize these procedures and detail adaptations or departures from the previous methodology.
Data sourceThis study included county government-operated jails across the U.S. served by a correctional healthcare provider of medical, mental health, and pharmacy services (NaphCare, Inc.). Individuals accused of criminal offenses or convicted of minor/misdemeanor crimes (arrestees) who underwent screening while held in custody were included in this study. Data related to the screening, diagnosis, and management of health conditions, including drug use and UDS results, among these arrestees were collected as part of routine care and documented in a proprietary electronic health record (EHR) software system (TechCare 5.0). The researchers obtained these clinical data on arrestees in a de-identified manner under a confidential data-sharing agreement. This study was deemed exempt from institutional review board as the secondary data analysis of archival, anonymized data did not meet the definition of human subjects research (per Salus IRB, Case ID #23102-01).
Out of the 30 secure facilities where the healthcare company was contracted to provide healthcare services in 2023, 25 jails met the following study inclusion criteria: (1) facilities with an active contract with the correctional healthcare provider throughout 2023; (2) facilities where arrestees with a self-reported history of drug use or suspicion of withdrawal risk consented to undergo the UDS in 2023; and (3) facilities that recorded UDS results from 2023.
Distribution of the 25 study jails spanned the Western, Midwestern, and Southern regions defined by the U.S. Census Bureau, but excluded the Northeast, limiting generalizability across all four major U.S. regions [22]. Jail size was defined by contractual bed capacity and categorized into three groups as follows: Medium-Large (250–499), Large (500–999), and Mega (≥ 1,000). Of the 25 jails included, 12 were located in the West (48%), five in the Midwest (20%), and eight in the South (32%). Jail size distribution included eight Medium-Large (32%), 10 Large (40%), and seven Mega (28%) jails.
Compared to national jail demographics [25], the Schumacher et al. [22] sample had a higher proportion of females (36.6% vs. ~ 10–15%), a similar overrepresentation of Black individuals (34.3% vs. ~ 33%), and a comparable age distribution, with most arrestees aged 20–39 (60.3%). In terms of drug screening policies, the participating jails used a systematic UDS protocol for arrestees at risk of withdrawal, a more structured practice than the national average, where only approximately 25% of U.S. jails conduct routine drug testing [22, 24].
Data extractionThe de-identified jail characteristics, arrestee demographics, and UDS results among arrestees across the 25 jails between 1 st January 2023 and 31 st December 2023 were extracted from the EHR system using Structured Query Language (SQL) scripts/queries and exported in Excel files. After creating two separate pandas DataFrames—one for demographics and jail characteristics and one for UDS results—descriptive statistics were computed using Python and its libraries to generate appropriate frequencies, tables, and figures.
Study populationAll arrestees across the 25 jails underwent screening assessments for acute and chronic health conditions at the time of booking and were triaged for additional assessments as necessary. However, only those arrestees who self-reported or were suspected to be using or chemically dependent on substances such as alcohol, benzodiazepines, or opioids and potentially at risk of withdrawal were approached for a UDS within 48 h of booking. As described elsewhere (see [22]), withdrawal risk was determined by healthcare staff through observations, review of arrestees’ self-reported substance use, history of prescription medicine misuse or medically assisted drug detoxification, symptoms of drug withdrawal, and/or drug-related hospitalizations.
Since UDS administration was limited to arrestees self-reporting and/or otherwise believed to be at risk of withdrawal or needing withdrawal management, the true frequency of drug use cannot be determined. Instead, these data are best understood as reflecting drug use frequency and patterns as known to correctional and healthcare staff, which constitute the information guiding interventions and policy decisions in these naturalistic settings. The collection, observation, analysis, and EHR documentation of UDS samples were conducted by on-site healthcare professionals.
Urine drug screen (UDS)Urine samples were screened with the Quick Test Cup™ Multi-Drug Urine Cup (MD-U261) and the Rapid Test Strip, Urine, for fentanyl (FYL-U11) manufactured by 12 Panel NOW™. MD-U261 test results were negative or presumed positive for the following drugs: opioid (OPI), methamphetamine (MET), amphetamine (AMP), benzodiazepine (BZO), cocaine (COC), methadone (MTD), oxycodone (OXY), marijuana (THC), barbiturates (BAR), buprenorphine (BUP), 3,4-Methylenedioxymethamphetamine or “Ecstasy” (MDMA), and phencyclidine (PCP).
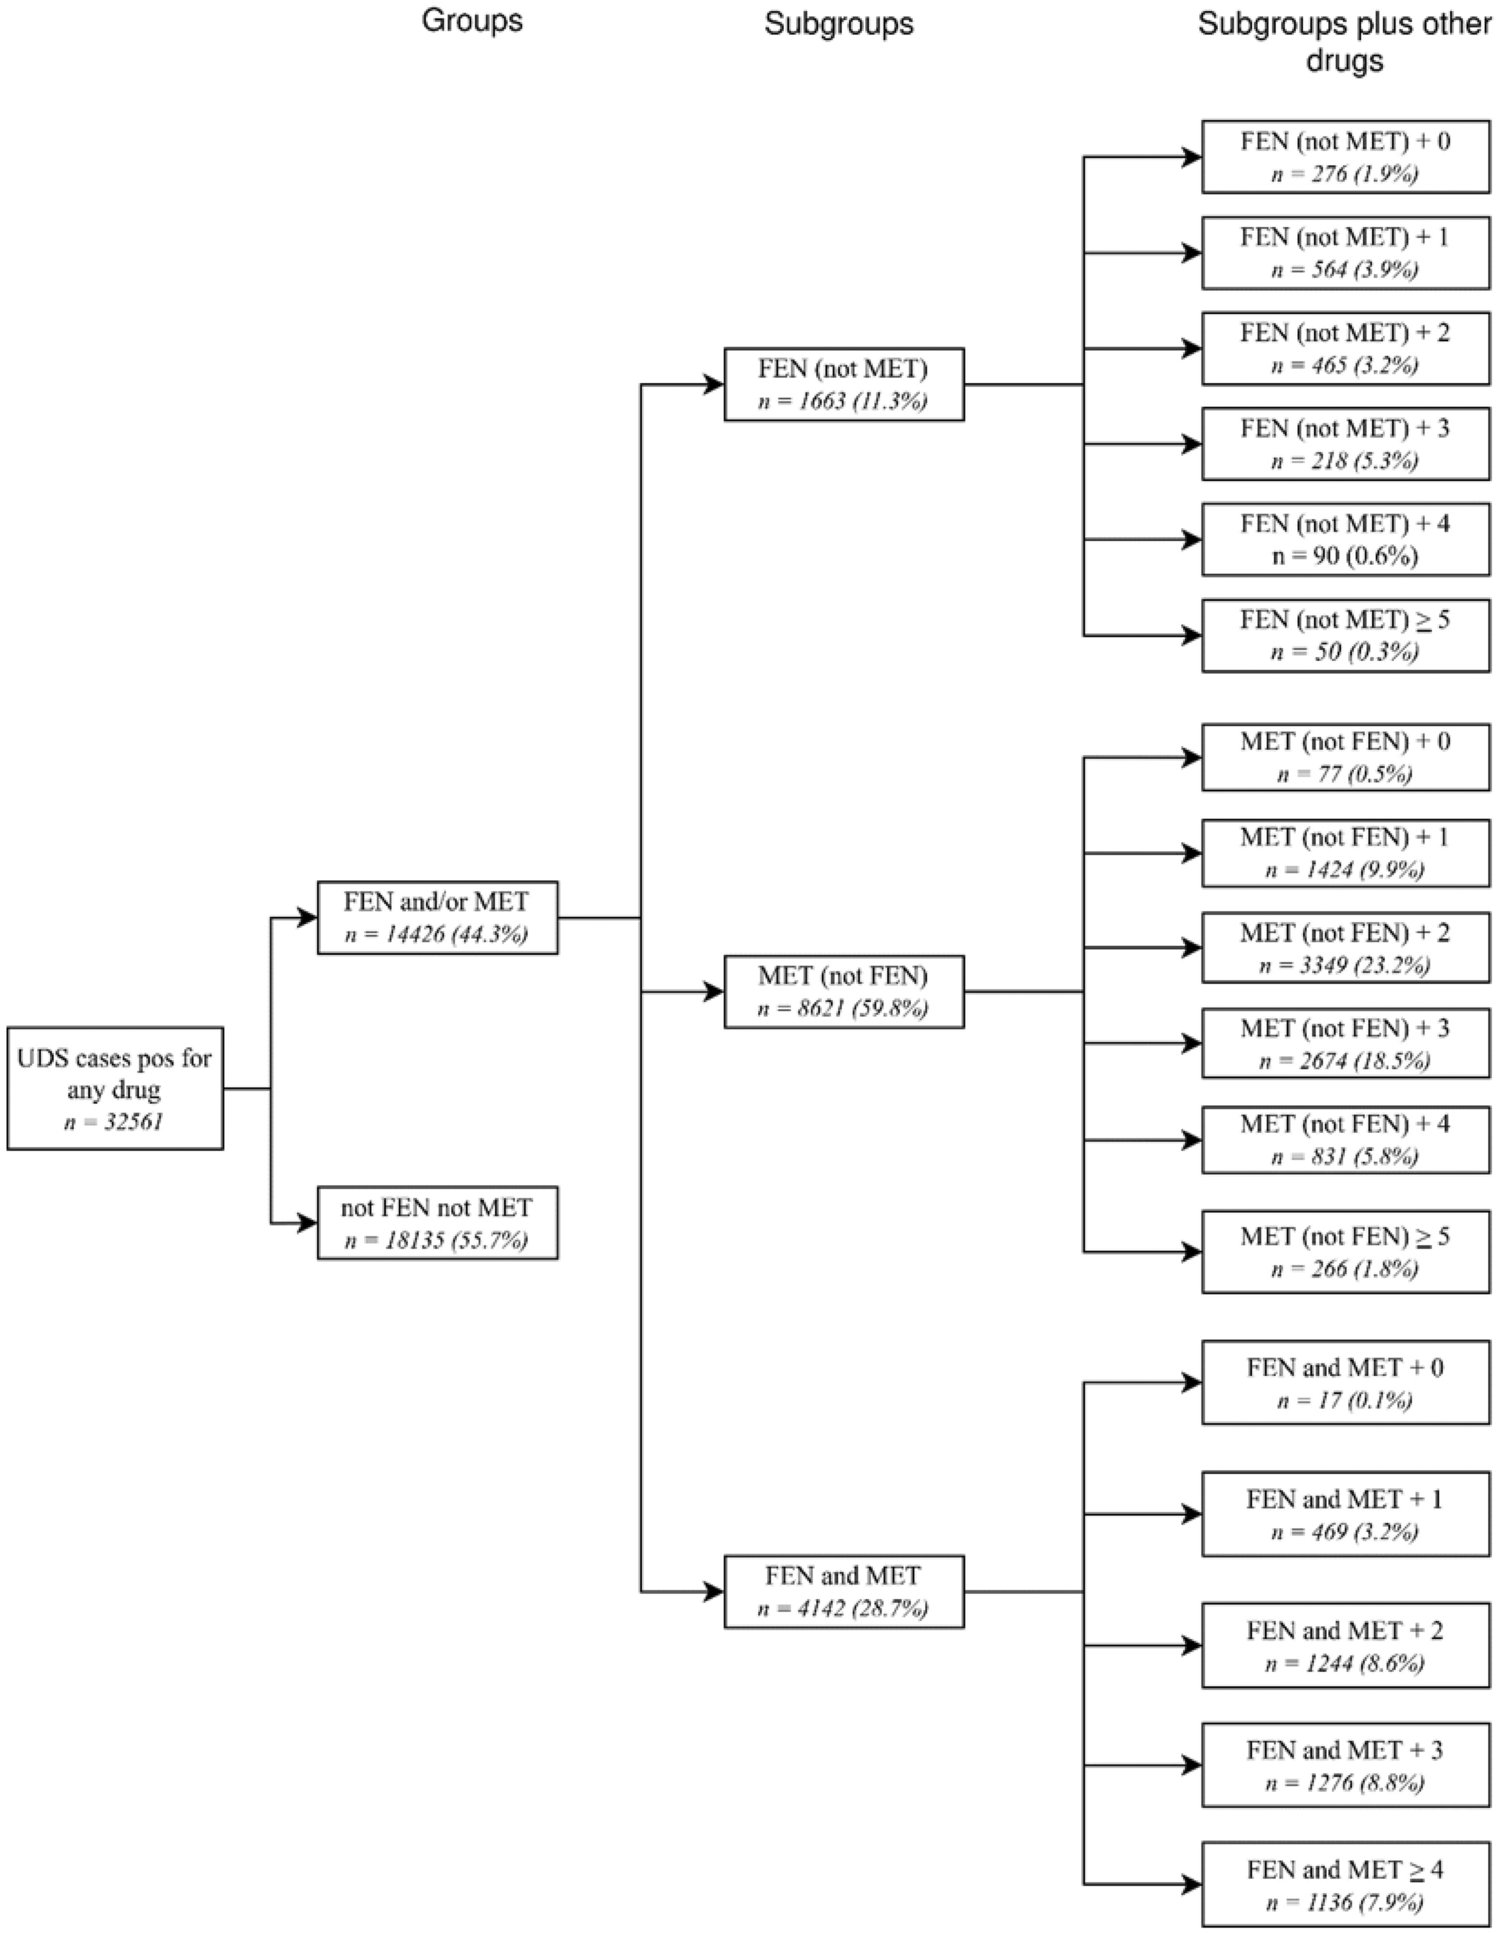
FEN/MET positivity groups and subgroups and sample sizesFigure 1 provides a breakdown of fentanyl and methamphetamine groups, subgroups, and subgroups plus other drugs and their sample sizes from the total sample of UDS cases positive for any drug (N = 32,561). UDS cases positive for any drug were divided into two groups: (1) UDS for fentanyl and/or methamphetamine were positive (FEN and/or MET) or (2) neither fentanyl nor methamphetamine UDS were positive (not FEN not MET). FEN and/or MET was further separated into three subgroups: UDS for fentanyl was positive, but negative for methamphetamine—FEN (not MET); UDS for methamphetamine was positive, but negative for fentanyl—MET (not FEN); and UDS for both fentanyl and methamphetamine were positive—FEN and MET. Lastly, each subgroup (total of 17) was categorized based on the number of drugs other than FEN or MET used.
Fig. 1
Breakdown and sample sizes for FEN/MET groups, subgroups, and subgroups plus other drugs. Variable definitions are found in the Methods section
Sample selectionBuilding on prior work focused on first-time arrestees (e.g., [22]), the current sample was limited to individuals who, according to available records, were arrested and received a urine drug screen (UDS) for the first time in 2023. Of the 283,884 arrestees identified that year, 81,842 (28.8%) underwent UDS. From these, we included only those with complete UDS results (77,074,27.1%) and no prior arrest history before 2023 (50,524; 17.8%). Arrestees were excluded if they did not undergo UDS, had missing results for any of the 13 substances tested, or had a prior arrest. For individuals with multiple arrests or UDS in 2023, only the first UDS was retained. This yielded a final sample of 43,533 first-time arrestees with a complete UDS, of whom 74.8% (n = 32,561) tested positive for any drug. Among these, 44.3% (n = 14,426) were positive for fentanyl (FEN), methamphetamine (MET), or both, while 55.7% (n = 18,135) were not. As shown in Fig. 1, this study focused on the subsample of arrestees with UDS positive for FEN and/or MET.
Statistical analysesAfter determining (sub)sample arrestee demographics (see Table 1), frequencies and percentages were calculated for FEN and/or MET, FEN (not MET), MET (not FEN), and FEN and MET subgroups and partitioned by jail characteristics and arrestee demographics (see Table 2). To gain insight into patterns of the UDS results, a series of Pearson’s chi-square tests of independence were performed to statistically analyze associations between UDS results and jail characteristics and arrestee demographics. Significant chi-square test results were probed by examining standardized residuals to clarify the nature and significance of within-group differences in proportions. Standardized residuals greater than zero were interpreted as indications of higher prevalence of certain drug combinations than expected for a specific subgroup (i.e., a greater likelihood than expected under the null), and those less than zero signifying a frequency smaller than expected under the null. Absolute standardized residuals equal to or greater than 1.96 were deemed significantly different from zero (i.e., at p < 0.05).
Table 1 Frequencies and percentages of urine drug screen (UDS) cases positive for any drug and fentanyl/methamphetamine (FEN/MET) groups by jail characteristics and arrestee demographicsTable 2 Frequencies and percentages of urine drug screen (UDS) cases positive fentanyl and/or methamphetamine (FEN and/or MET) and three FEN and/or MET subgroups by jail characteristics and arrestee demographics
Comments (0)