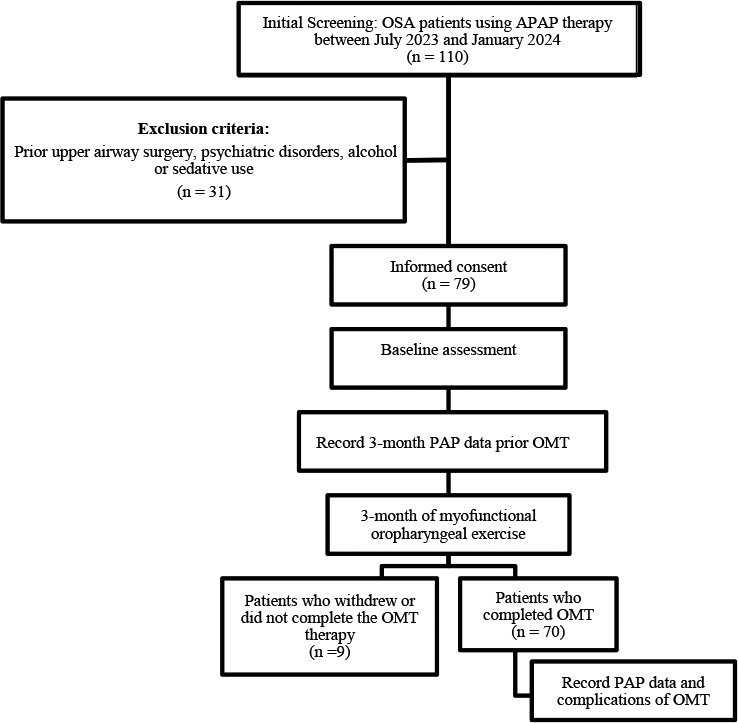
This was a sub-study of a pilot double-blinded randomized controlled crossover trial that aimed to investigate the effects of two different light therapy interventions on objectively measured sleep quality in people over 50 years who self-reported disturbed sleep (CleverLights Study: Clinical Trial registration ID 12619000138189 at ANZCTR.org.au; See clinical trial registry for inclusion/exclusion criteria.). The present analyses do not report the original hypotheses being tested in the CleverLights trial.
Between February 2021 and June 2022, participants completed two 3-night stays at the Woolcock Institute of Medical Research in Sydney, Australia, with 2 weeks washout period. During each visit, participants stayed in the laboratory for three nights: two for habituation and one for testing. PSG and actigraphy measurements were recorded on the third night. Throughout their stay, participants maintained their habitual bedtime and wake time, as determined from a 7-day sleep diary. Sleep patterns were monitored using GeneActiv actigraphy, which recorded tri-axis accelerometry data at 50 Hz. Additionally, participants’ electrophysiological brain activity during sleep was recorded using high-density electroencephalography (HD-EEG) (Electrical Geodesics (EGI, Inc), United States).
Sleep was staged by a single experienced polysomnographic technologist and sleep parameters were calculated following standard guidelines by the American Academy of Sleep Medicine (AASM) criteria [7]. The tri-axis actigraphy data were transformed into the Euclidean Norm Minus One [8] and the angle of the orientation of the device in the z-axis [9], averaged across 5 s epochs, and scored through a custom open-source software (i.e., Cicada, https://cicada-actigraphy-suite.readthedocs.io). Sleep parameters were calculated as follows. The time in bed (TIB) was determined manually using the Euclidean Norm Minus One, sleep diaries and lab notes. Within the TIB period, epochs were annotated as sustained inactive where the change in the angle of the actigraph was less than 5 degrees for at least 5 min. The sleep period was the period between the first and last sustained inactivity epoch. Sleep onset latency (SOL) was the time between the onset of the TIB period to the first epoch of sustained inactivity, wake after sleep onset (WASO) was the total duration of non-sustained inactivity epochs within the sleep period, total sleep time (TST) was the total duration of all sustained inactivity epochs, sleep efficiency (SE) was calculated as 100 × (TST / TIB), and number of awakenings were the total number of non-sustained activity bouts within the sleep period.
Analysis
Descriptive statistics were utilised to characterise the study sample and evaluate data distributions. All descriptive statistics are presented as mean ± SD unless otherwise specified. Data analysis was conducted using SPSS (version 26). Data was visually inspected to confirm normality. We used the Intraclass Correlation Coefficient (ICC) to evaluate the reliability i.e., the level of absolute agreement for both average measures across two nights and separately for each night between the two devices. Additionally, Pearson correlation (Spearman rho for non-normally distributed data) was employed to investigate the relationship between between PSG measurements and actigraphy measurements.
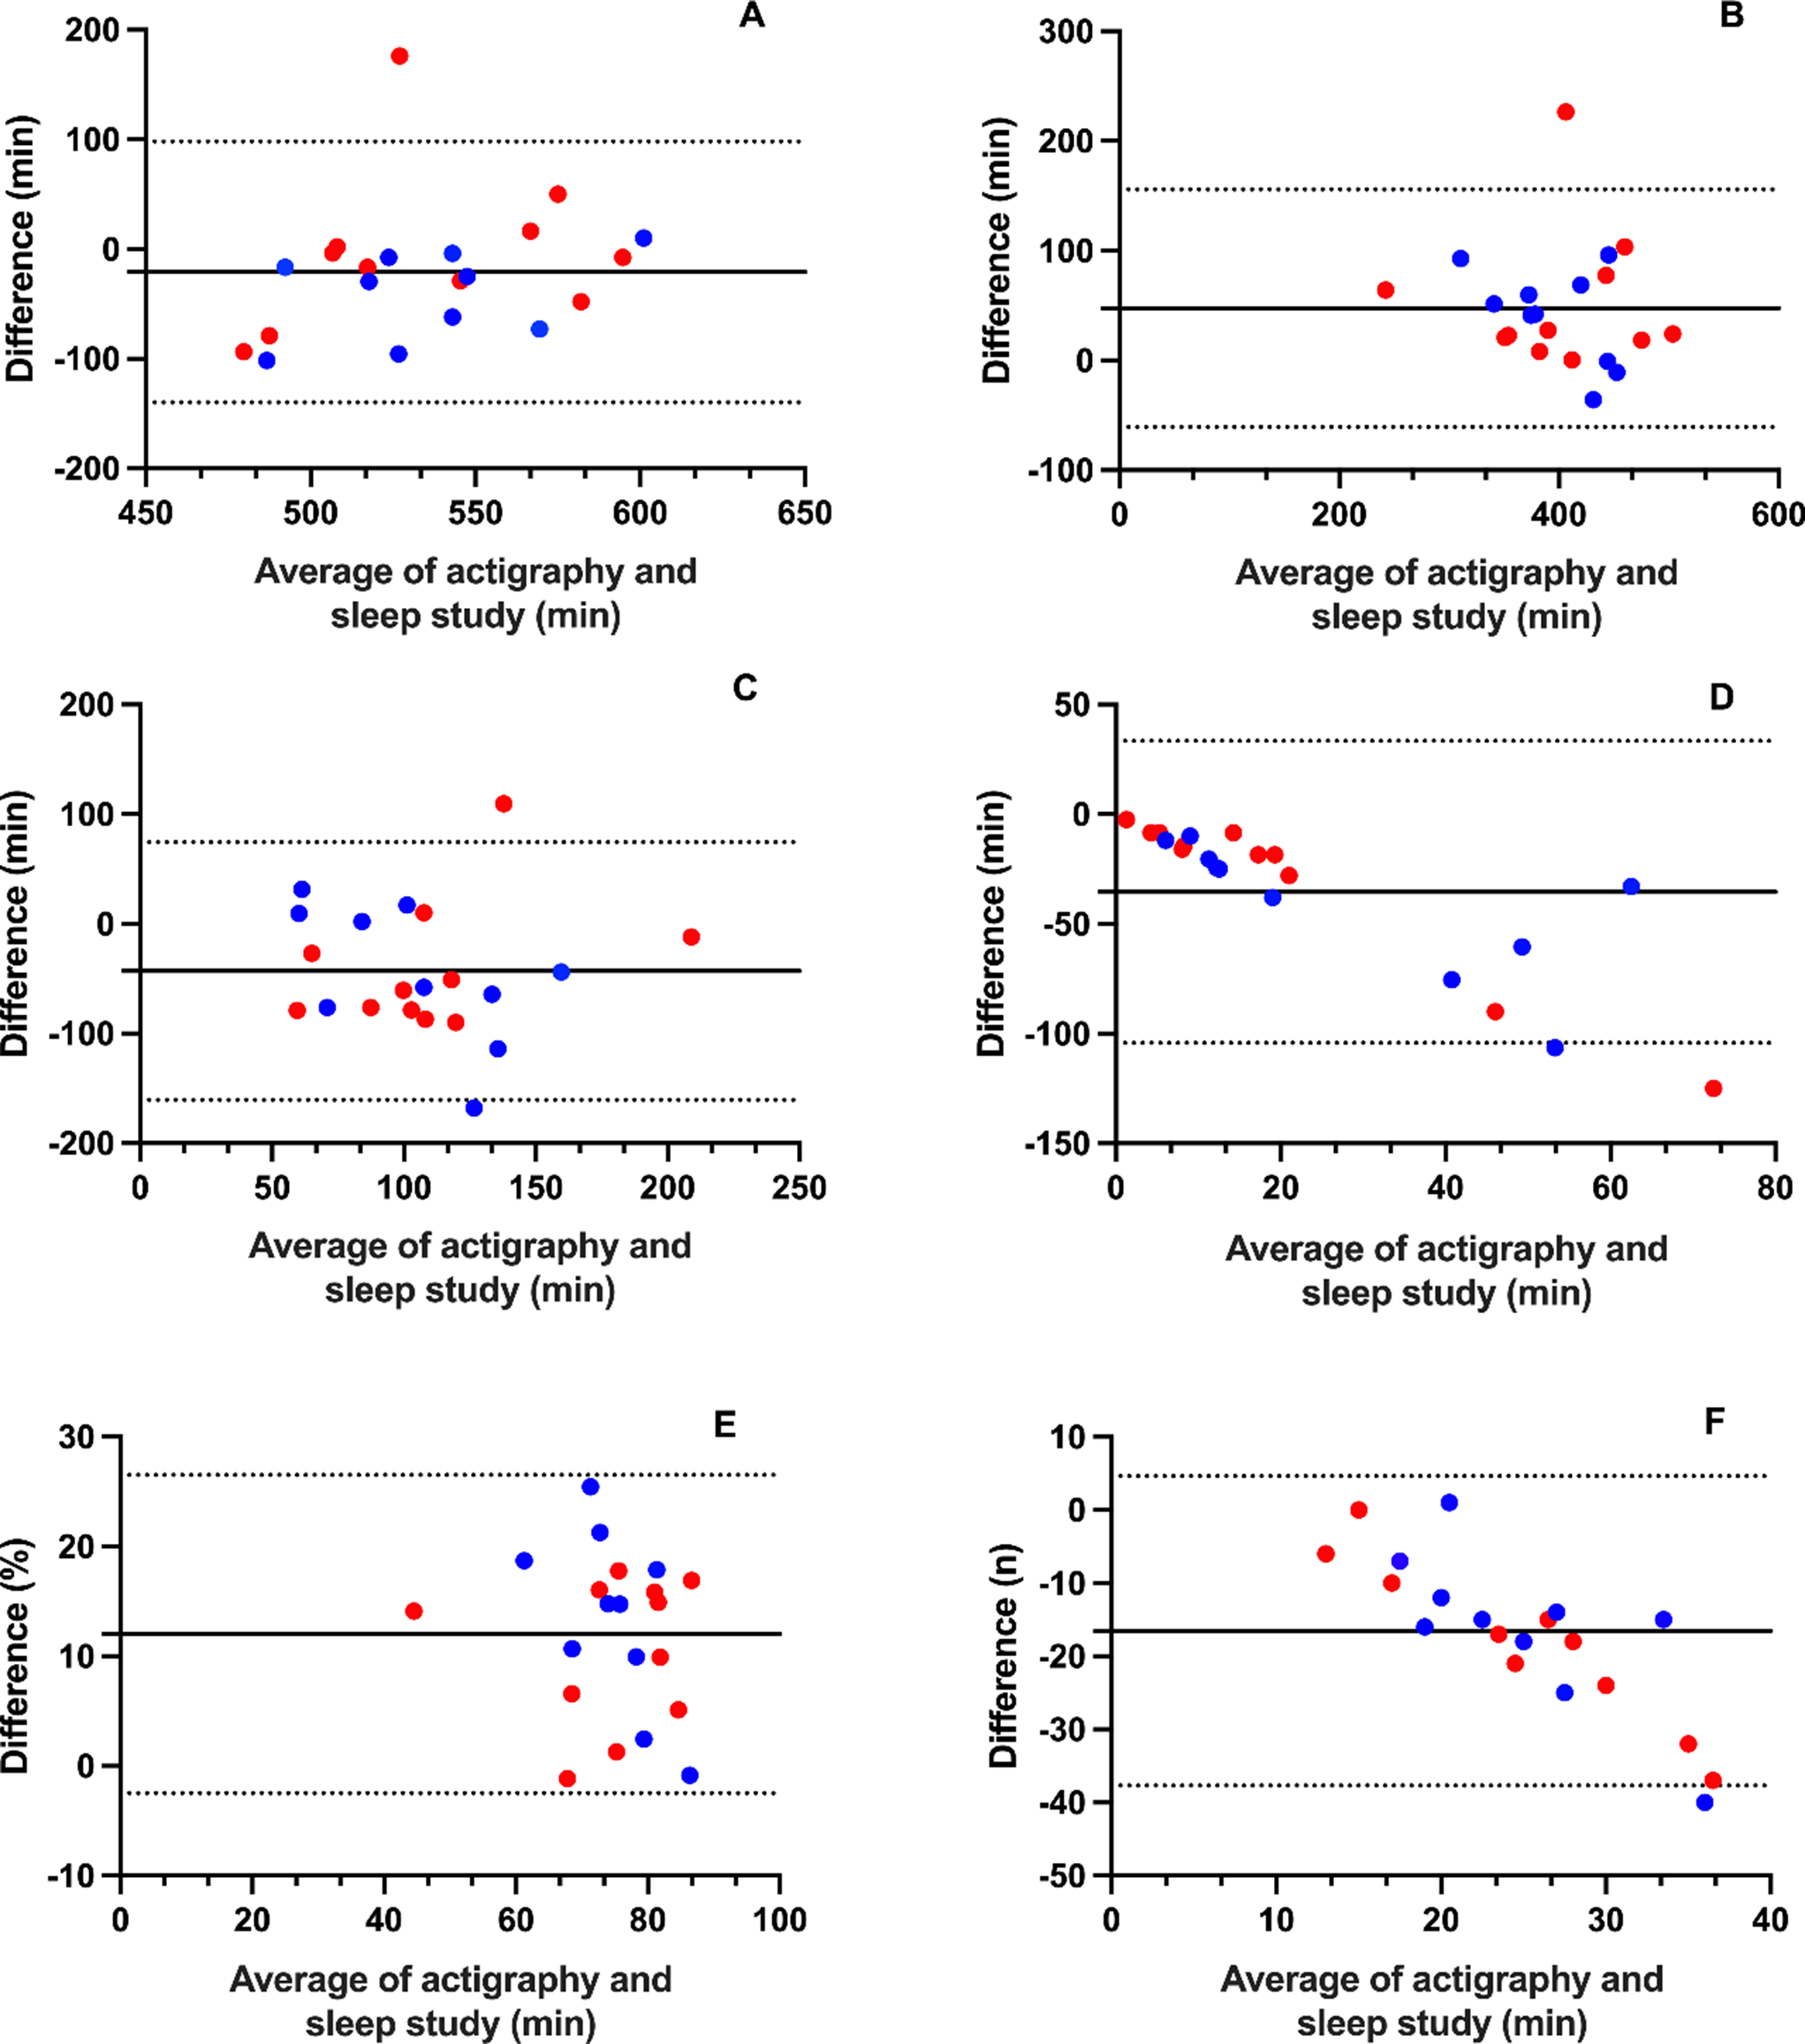
Bland-Altman plots [10] were constructed to visually display the agreement between actigraphy and PSG sleep parameters. These plots allowed for the examination of proportional bias, which indicates that the difference between measurements from PSG and actigraphy varies systematically as a proportion of the magnitude of the measurements themselves.
To determine the precision of the measurements, the 95% limits of agreement, calculated as ± 1.96 times the standard deviations of the differences were utilised.

Comments (0)