
Remember me
Patient selection and OA treatment protocol followed the same methodology as a prior randomized crossover trial evaluating the effect of elastic bands in OA treatment, with results published in 2024 by Opsahl et al. [20].
Men and women aged 18 years and older with moderate or severe OSA who were non-adherent to PAP therapy were considered for inclusion in the study. Recruitment was conducted through the “Sleep Registry” at the Center for Sleep Medicine, Haukeland University Hospital. Exclusion criteria were mild or no OSA, inadequate dentition to support an OA, the presence of complete dentures, and the inability to read and/or speak the Norwegian language. Individuals unable to provide informed consent were also excluded.
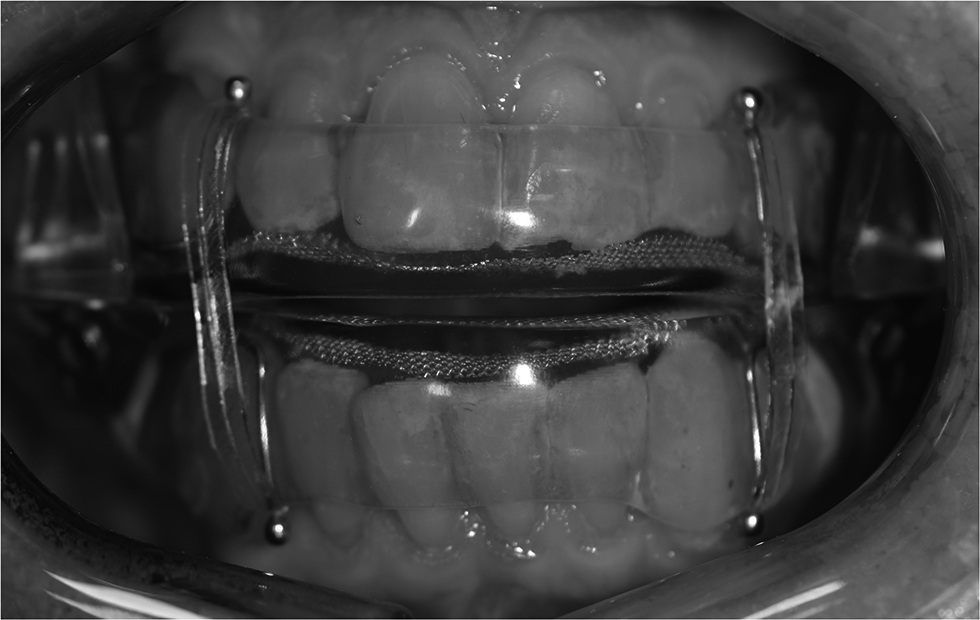
Patients were treated with a custom-made OA with bibloc design (SomnoDent Fusion, SomnoMed Ltd), with and without elastic bands in randomized order (Fig. 1), with a duration of > 3 weeks for each treatment modality. Maximal protrusion was measured using the George Gauge™ bite fork, measured from habitual bite position. The overjet in the habitual bite position on the George Gauge™ bite fork replicated the intercuspal position. The sagittal distance from habitual bite position to the retruded position was also measured using the George Gauge™ bite fork. The starting position in which the OAs were fabricated was with 63% and 69% of maximal protrusion, for patients with moderate and severe OSA, respectively. These positions have been identified as optimal through stepwise, objective titration [21]. The increase of the occlusal vertical dimension was reduced to the minimal height required for the “SomnoDent® Fusion” appliance (4–5 mm.) Prior to treatment start, included patients answered questionnaires regarding variables associated with sleep and OSA, and the objective effect of the treatment was investigated with home respiratory polygraphy registrations (PG) with type III devices (Nox T3®, Nox Medical) at the end of each treatment period, including manual scoring.
Fig. 1
Photo of the oral appliance with elastic bands as applied in the study
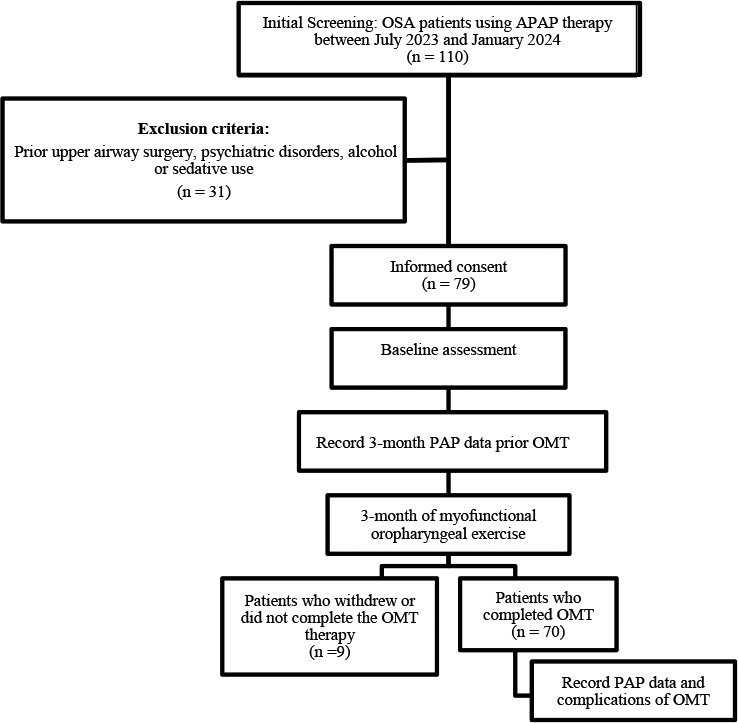
After completion of both treatment periods, patients were asked to choose treatment modality for further OA treatment (with or without elastic bands) based on objective effect, but also other factors deemed important by the patients, i.e. comfort and side effects. Patients who did not comply with the use of elastic bands (n = 5) but were able to utilize their OA without elastic bands, were included in the follow-up in this study (Fig. 2).
Fig. 2
Study flow chart. OA Oral appliance, EB Elastic bands, OSA Obstructive sleep apnea
Success after the initial treatment, without titration of the OAs, were defined using criteria specified by Gjerde et al. [22]: REI < 5 was defined as success criterion 1, REI < 10 and > 50% reduction of REI as success criterion 2, reduction of REI > 50% as criterion 3, and reduction of REI ≤ 50% as failure. Patients achieving success criterion 1 or 2 after the initial treatment were considered successful, and not titrated further. Patients reaching success criterion 3 or being deemed as failures after the initial treatment were titrated further aiming to improve treatment effect. OAs were titrated with 1 mm increment, followed up with PG-recordings after each titration. The OAs were considered optimally titrated when reaching one or more of the following preconditions: Success criterion 1 or 2 achieved, follow-up REI did not improve after titration, or the patient felt uncomfortable with further titration of the OA.
Responders to OA treatment after titration were defined as reduction of REI > 50%, whereas non-responders were defined as reduction of REI ≤ 50%.
More detailed information regarding the study protocol, as well as the eligibility, inclusion, and exclusion criteria, is available in the publication by Opsahl et al. [20].
Endotypical trait definitionsCollapsibilityIt has been shown that therapeutic PAP-levels ≤ 8 cmH2O indicate mildly collapsible upper airway, with 89% sensitivity and 84% specificity, and with positive- and negative predictive values of 57% and 97%, respectively [13]. Thus, patients with therapeutic PAP-levels > 8 cmH2O are considered having severe airway collapsibility, and were scored accordingly in this study.
Arousal thresholdArousal threshold was scored from available PG registrations according to a previously developed methodology [14]: Three variables were scored with one point each if fulfilled: REI < 30, nadir oxygen saturation > 82.5%, and proportion hypopneas of total respiratory events > 58.3%. Scores ≥ 2 has been shown to predict low arousal threshold with 80.4% sensitivity and 88.0% specificity [14], and patients in this study were thus scored with low arousal threshold if exhibiting ≥ 2 of these variables.
Ventilatory controlVentilatory control was assessed by a validated model for clinical prediction of high and low loop gain [15]: Loop gain = 0.72 + 0.0016*REI – 0.0019*proportion hypopneas of total respiratory events. The threshold for high loop gain was set at 0.682 in this study, which was the Youden index reported in the validation study [15], with corresponding sensitivity of 0.53 (95%CI: 0.44–0.64) and specificity of 0.83 (95%CI: 0.76–0.88).
Number of endotypical traits per patientThe number of endotypical traits per patient was calculated by adding the number of endotypical traits severe collapsibility, low arousal threshold, high loop gain, scored per patient.
StatisticsThe statistical analyses and sample size calculation were performed with Stata version 18 (StataCorp LLC) [23].
A sample size calculation was conducted for the randomized crossover trial based on a 5% level of significance and 80% statistical power. The calculation utilized data from a pilot study with a comparable design [24], which reported treatment success rates (defined as > 50% reduction in REI) of 90% with elastic bands and 70% without elastic bands. The calculation determined that 124 participants (62 per group) would be required. Since the study followed a crossover design, this translated to a total of 62 participants. To accommodate an anticipated attrition rate of 10%, a total of 69 participants were recruited. Following the intervention phase of the randomized crossover trial, the OAs of the included patients were titrated until optimized. Data collected at the point of optimization form the basis for the analysis in this study.
To investigate differences in baseline variables between responders and non-responders to OA treatment following titration, Student’s t-test was applied to analyze continuous variables, while Pearson’s chi-squared test was used for categorical variables. The Shapiro-Wilk test was employed to assess the normality of continuous variables. For continuous variables that did not follow a normal distribution, the Wilcoxon Rank-Sum test was utilized to examine differences (Tables 1, 2, 3 and 4).
Table 1 Baseline demographic and anthropometric measurements in responders (> 50% reduction of respiratory event index (REI)) and non-responders (REI ≤ 50% reduction) to oral appliance treatment (n = 57)Table 2 Baseline polygraphic measurements in responders (> 50% reduction of respiratory event index (REI)) and non-responders (REI ≤ 50% reduction) to oral appliance treatment (n = 57)Table 3 Baseline subjective variables in responders (> 50% reduction of respiratory event index (REI)) and non-responders (REI ≤ 50% reduction) to oral appliance treatment (n = 57)Table 4 Baseline OSA endotypes in responders (> 50% reduction of respiratory event index (REI)) and non-responders (REI ≤ 50% reduction) to oral appliance treatment (n = 57)Table 5 Logistic regression model for the odds of being classified as non-responder (REI ≤ 50% reduction) after OA treatment with and without elastic bands, with “non responder” as a binary dependent variable, for the 57 patients in the study. Independent variables for the unadjusted analyses were selected based on observed differences between responders and non-responders in Tables 1–4, exhibiting p-values < 0.1 adjusted logistic regression analysis was performed with a Stepwise forward conditional method, including the independent variables exhibiting p < 0.1 in the unadjusted analyses. In the adjusted model, adjusted odds ratios with p-values < 0.05 were deemed statistically significantLogistic regression analysis was performed to investigate variables associated with not responding to OA treatment after titration (reduction of REI ≤ 50%) as the dependent variable (Table 5). Independent variables for the unadjusted analyses were selected based on observed differences between responders and non-responders in Tables 1, 2, 3 and 4, exhibiting p-values < 0.10. Thereafter, an adjusted logistic regression analysis was conducted with a stepwise forward conditional method, including the selected independent variables from the unadjusted analyses. In the adjusted regression model, odds ratios with p-values < 0.05 were deemed statistically significant.
EthicsThe study was approved by the regional ethics committee of Western Norway (protocol no: 550079 REK Vest), in addition to being approved by the health and social representative of both Haukeland University Hospital and the University of Bergen. Written informed consent was obtained by all participants before the treatment started. The study was registered at clinicaltrials.gov prior to trial start (ID: NCT05987618).
Comments (0)