
Remember me
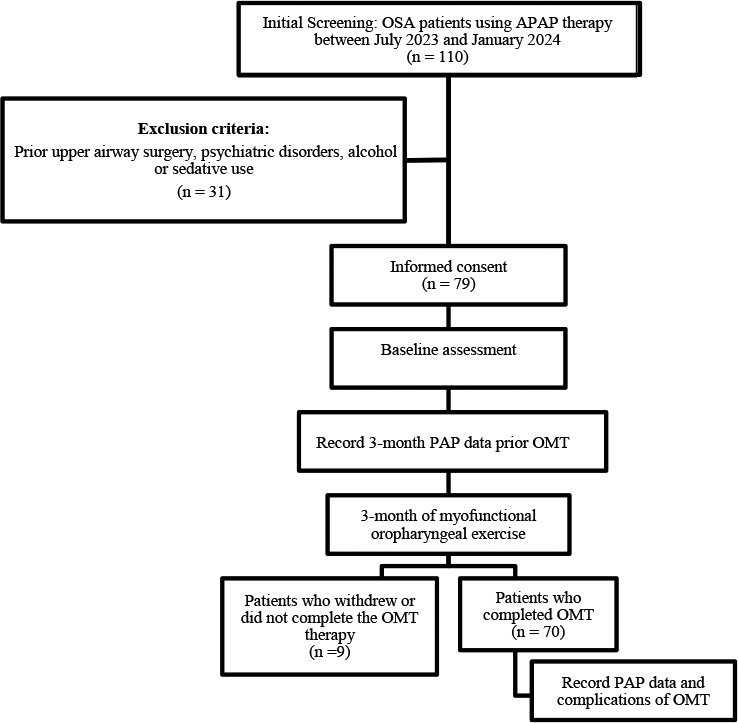
A prospective cohort study with consecutive inclusion of the first 3 patients who attended for treatment each day. All patients had previously undergone a sleep study at home or in hospital using a suitably validated respiratory polygraph device.
Patients diagnosed with moderate-severe OSA treated with CPAP (according to recommendations from the Spanish Society of Pneumology– SEPAR [18]) were recruited. The study lasted 2 years. OSA was diagnosed according to the AASM criteria [19] based on a manual reading of a polygraph from the Philips Respironics Alice PDx diagnostic recording device. Four weeks after the start of CPAP treatment, the equipment was titrated by downloading the Built-in-software (BIS) of the equipment. We considered correct titration of the equipment to be as follows: residual AHI < 10 events/hour, with unintentional leak < 24 L/min (< 95 percentile [95th ]) with nasal mask and < 36 L/min (< 95th ) with full face mask, over 3 consecutive nights). OCT was performed within 3 days of the patient’s inclusion and 12 months after the start of CPAP treatment.
Demographic variables recorded were age, sex, body mass index (BMI), arterial hypertension (AH), type 2 diabetes mellitus (T2DM), dyslipidaemia, smoking status, and Epworth score. Polygraphic variables analysed were AHI, cumulative percentage of time spent with oxygen saturation < 90% (CT90), mean oxygen saturation (SpO2), ODI, nocturnal respiratory failure (NRF), defined as CT90 ≥ 30% or mean SpO2 ≤ 90%, and HB, which was considered to be high when it was greater than p50 of the study population (> 100%min/h).
The study protocol and the informed consent form were approved by our Ethics Committee (CEIM) (Internal Code 2017.236), and the study was performed in accordance with the principles of the Declaration of Helsinki. Informed consent forms were signed by all participants prior to examinations.
Inclusion and exclusion criteriaPatients between 18 and 75 years of age diagnosed with moderate-severe OSA (AHI ≥ 15) based on a respiratory polygraph with indication for CPAP treatment were included consecutively.
All participants underwent a through ophthalmic examination on the day of OCT imaging, comprising the following eye assessments: best-corrected visual acuity (Snellen charts), anterior segment biomicroscopy, refraction, OCT measurements, axial length (AL) assessment, intraocular pressure (IOP) quantification with Goldmann applanation tonometer (GAT) and dilated fundus examination. Participants received no pupil dilation drops to avoid changes in choroidal thickness [20]. The refractive error was recorded using an auto refractometer Canon RK-F1. Axial length (AL) was measured using the Lenstar LS 900. Each individual was randomised to decide which eye was to be examined first.
Exclusion criteria included previous CPAP treatment, the presence of respiratory failure (defined as SpO2 < 90% or PaO2 < 60 mmHg) or home oxygen therapy, an unstable situation, uncontrolled or acute psychiatric illnesses, heart failure (NYHA grades III or IV), central apnea (> 50% of the register with central apneas), a refractive error > 6.0 or < -6.0 diopters (D) of spherical equivalent or 3.0 D of astigmatism, any history of ocular surgery, ocular disease such as central serous chorioretinopathy, pachychoroid spectrum, uveitis and related macular degeneration, best corrected visual acuity as poor as 20/40, IOP ≥ 18 mmHg, past history of elevated IOP, neuroretinal rim notching, or optic disc hemorrhages. Similarly, other exclusion criteria included clinically relevant opacities of the optic media and low-quality images due to unstable fixation, or severe cataracts. All acquired spectral domain-OCT data sets had a quality score(Q) > 25.
Optical coherence tomography assessmentOCT measurements were taken using Spectralis OCT. The examinations included horizontal and vertical non-isotropic scans measuring 8741 μm, resulting in dimensions of 8741 × 8741 µm2.
Retinal thickness was measured using spectral-domain (SD) Spectralis SD-OCT based on the images obtained by the posterior pole analysis scan.
The average retinal layer measurement of each 8 × 8 (3˚x3˚) sector (64 sectors) was determined. Since glaucoma initially damages the centre of the macula, to determine the correlation between the ganglion cell-inner plexiform layer thickness measured with cirrus HD-OCT and macular visual field sensitivity measured with microperimetry [21], only 4 × 4 central grids were analysed to expedite the study (Fig. 2A). These 16 sectors were numbered as previously published [22], with temporal (T), nasal (N), superior (S) and inferior (I) added to help with understanding.
Fig. 2
Optical coherence tomography parameters. A: Ganglion Cell Layer (GCL). B: Bruch’s membrane opening–minimum rim width (BMO-MRW). C: Retinal nerve fiber layer (RNFL), D: Lamina cribrosa (LC), E: Choroidal thickness (CT)
Bruch’s membrane opening-minimum rim width (BMO-MRW) is automatically centered at the optic nerve head, and 24 radial B-scans were acquired over a 15º area. The shortest distance from each identified BMO point to the internal limiting membrane (Fig. 2B) was measured.
RNFL thickness measurements of each individual eye were normalised for anatomic orientation of the fovea to optic nerve to an accurate and consistent positioning of the RNFL thickness measurement across eyes (automatic real-time tracking mean 100). Although the module includes 3 circle scans (inner circle: 3.5 mm, middle circle: 4.1 mm, and outer circle: 4.7 mm), we only recorded the figures provided by the inner circle scan (standard) (Fig. 2C). Six sector areas (superotemporal, superior, superonasal, inferonasal, inferior, and inferotemporal) and the average were measured in both analyses.
LC was measured by performing one vertical scan closest to the centre of the optic nerve head, at the point where the visibility of the anterior LC surface was as complete as possible, by excluding the main vessels using enhanced depth image technology, with an average of over 100 scans using the automatic averaging mode. A reference line connecting the two Bruch’s membrane end points was drawn, and one equidistant point (middle), with these then matched to the anterior prelaminar tissue surface and anterior LC surface (Fig. 2D).
Prelaminar tissue thickness (PTT) and anterior LC surface depth were measured at the three aforementioned points. Measurements were taken using the Spectralis software manual caliper tool by the aforementioned masked investigators (AC, AL).
Statistical analysisAccepting an alpha risk of 0.05 and a statistical power greater than 0.8 in a bilateral contrast, at least 23 subjects (46 observations) are required to detect a statistically significant difference equal to or greater than 5 units. A standard deviation for the first measurement is estimated at 11.38, and 6.89 for the second measurement (assuming a correlation of 0.2). A loss to follow-up rate of 0% is estimated. The sample size was calculated using Granmo v8.0.
A 1–sample Kolmogorov–Smirnov test was used to verify the normality of data distribution. A logistic regression analysis was performed considering the dependent variable of Bruch’s membrane opening-minimum rim width (BMO-MRW), RNFL and the independent variables as age, gender, BMI and cardiovascular risk factors (CVRF), AHI, CT90, mean Sp02, ODI and HB. For the selection of variables for the multivariate analysis, a univariate analysis was carried out with each of the variables according to the model proposed by Hosmer and Lemeshow [23]. Variables with a significance of less than 0.25 were considered, as well as their clinical relevance, regardless of their statistical significance.
All statistical analyses were performed using IBM SPSS Statistics V.20.0. The level of statistical significance was set at a p-value below 0.05.
Comments (0)