
Remember me
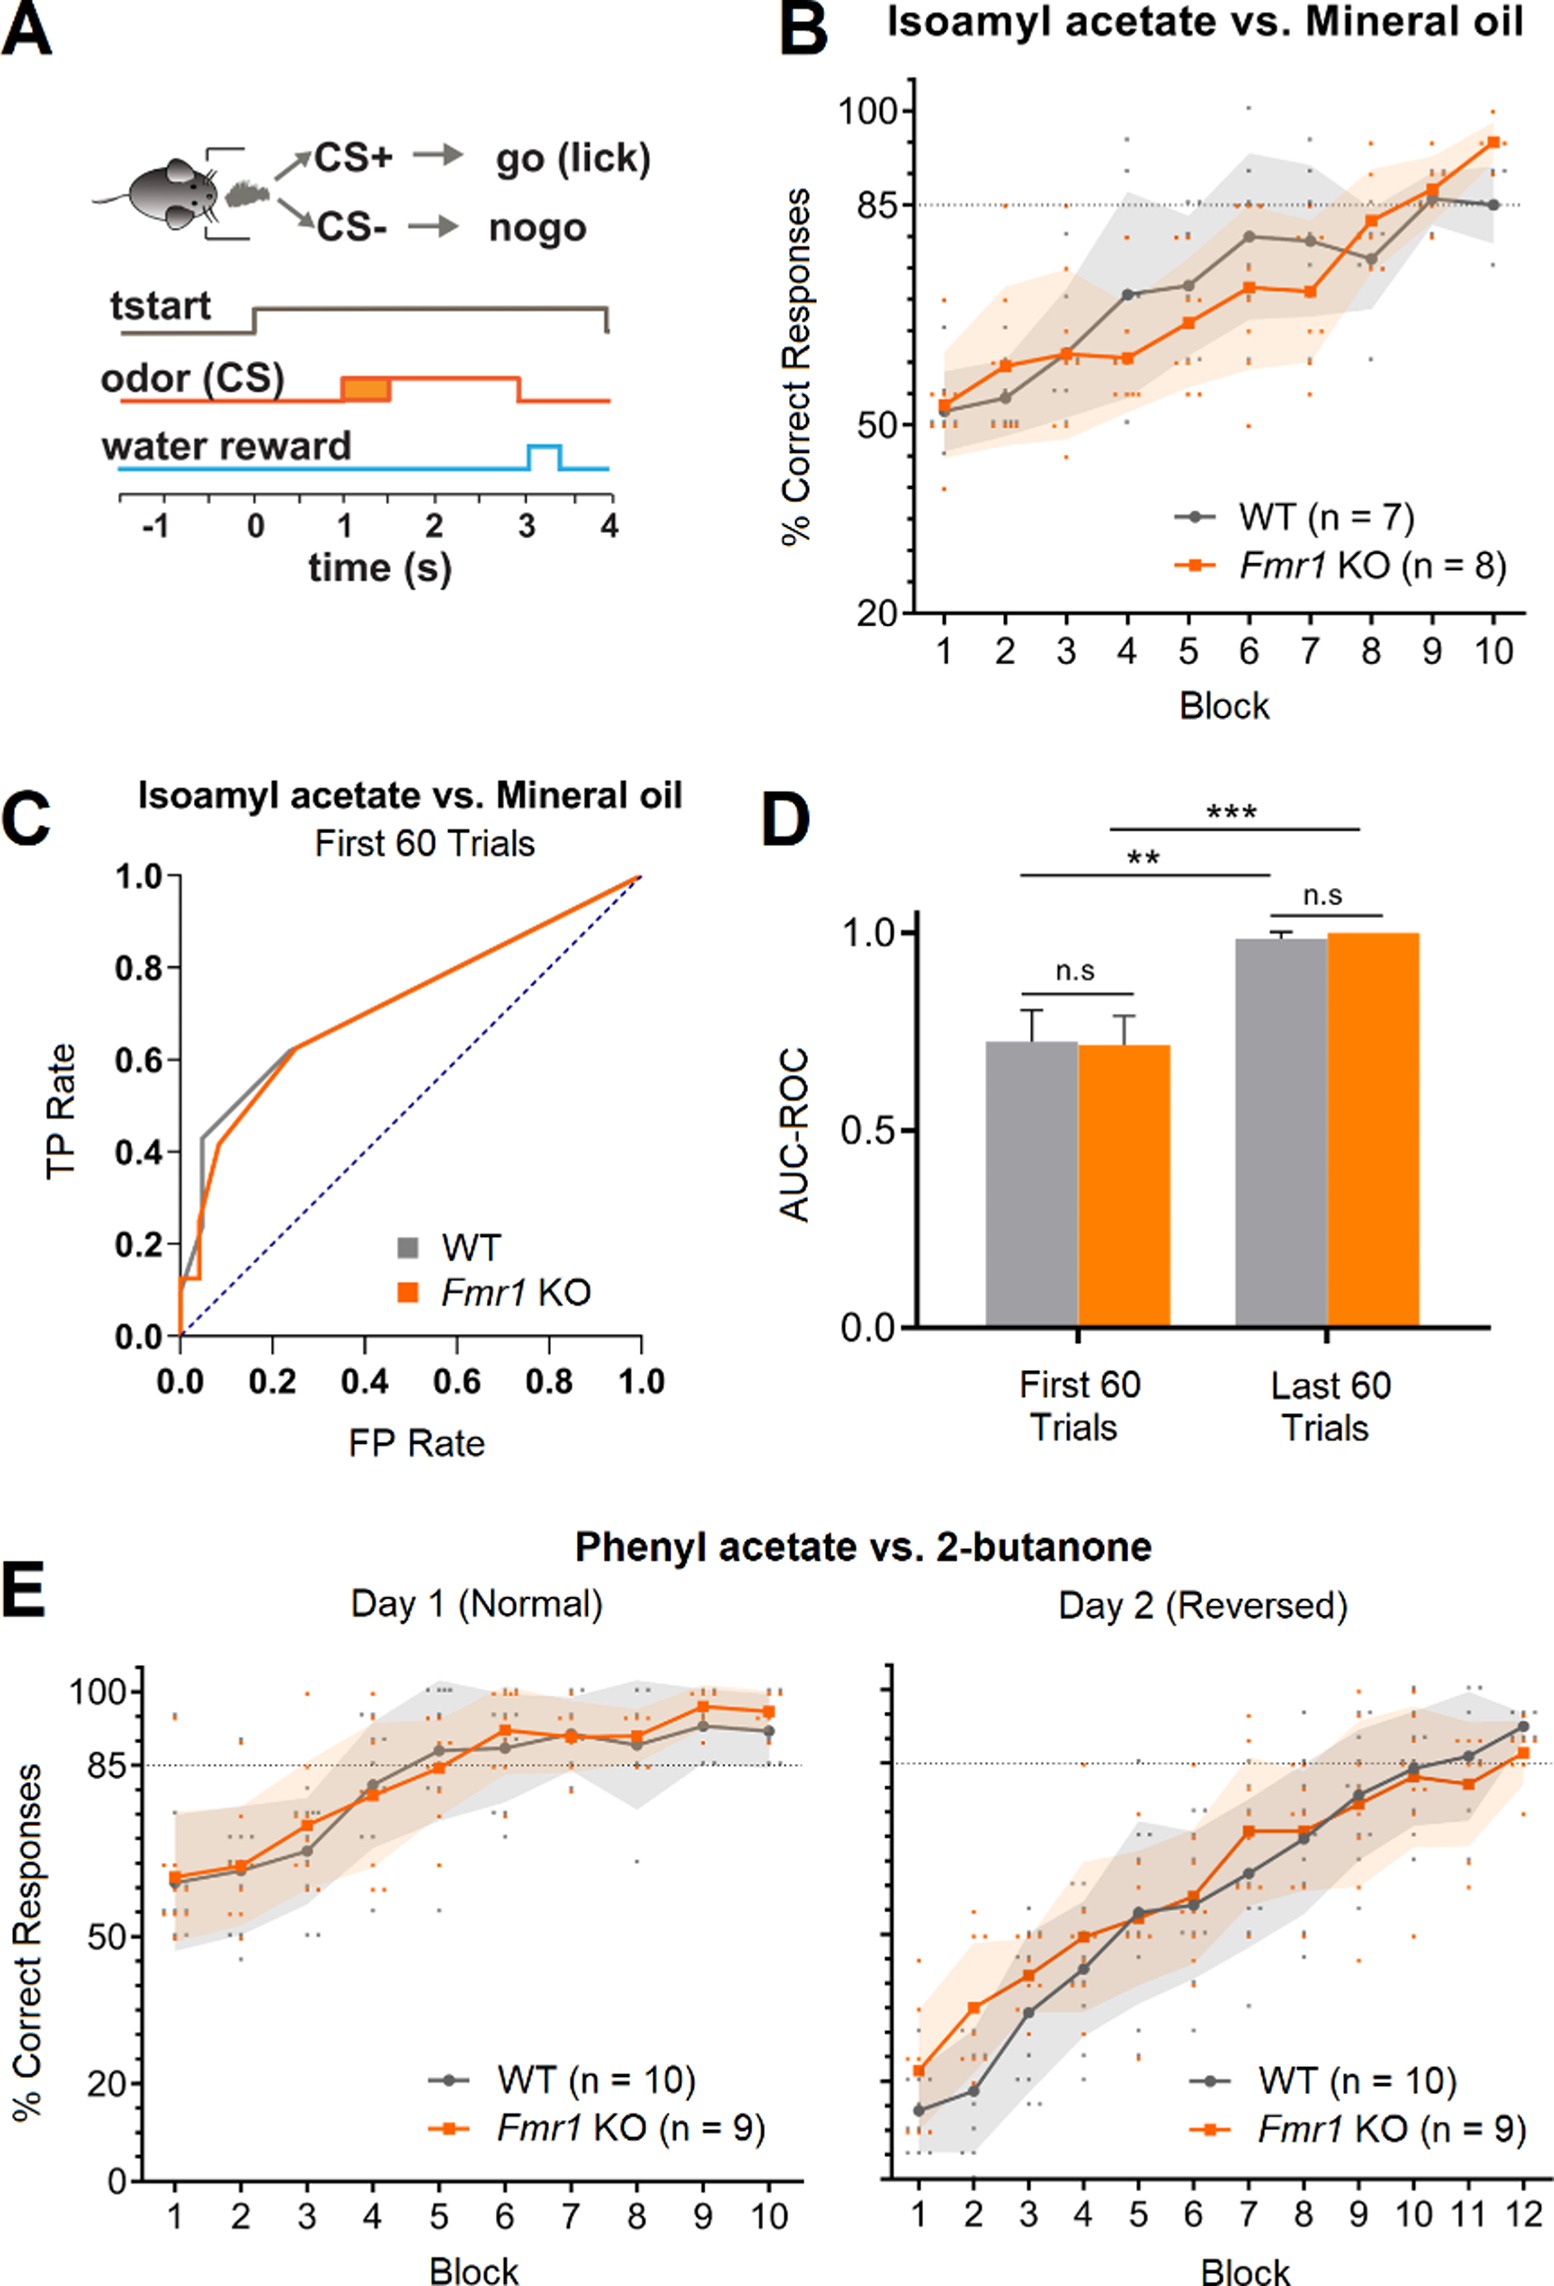


The ability of the Fmr1 KO to discriminate olfactory stimuli was assessed using an olfactory go-no go behavioral task. In this task, thirsty animals are trained to lick into a metal tube located below the odor port in response to a rewarded stimulus (CS+) and refrain from licking in response to an unrewarded stimulus (CS-). If the task is performed correctly, water is given as a reward (Fig. 1A). Animals perform one session per day consisting in 200 trials or 10 blocks (20 trials are randomly assigned to CS + and CS- per block and averaged together for visualization and analysis purposes) [23]. Licking in response to CS+ (hit) and refrain from licking in response to CS- (correct rejection) are considered correct responses. On the other hand, licking in response to CS- (false alarm) and not licking following CS+ (miss) are considered incorrect responses. We first trained the animals in a binary discrimination task to study whether Fmr1 KO mice were able to associate an olfactory stimulus with a reward. We used mineral oil (CS-) versus isoamyl acetate diluted in mineral oil (CS+) [23], which is classified as an “easy” task for mice (Nunez-Parra, 2020) since both of them elicit dramatically different activation maps in the glomerular layer of the olfactory bulb [28]. We found that Fmr1 KO mice can discriminate between mineral oil and isoamyl acetate, quickly reaching above chance criteria (85% or more of correct responses in three consecutive blocks) in only one session (Fig. 1B). We also did not find differences in the number of blocks Fmr1 KO mice performed per session indicating proper motivation response. In a similar study, the Larson group [12] studied Fmr1 KO mice using a two alternative olfactory forced choice paradigm and found that Fmr1 KO could learn to associate an olfactory cue with a reward, but also observed that the KO made more errors and learn slower compared to WT. Therefore, to compare the performance of WT and Fmr1 KO we performed a receiver operating characteristics (ROC) analysis. The ROC curve depicts the relative tradeoffs between the true positive rate: TP rate, probability of licking to CS+, and false positive rate: FP rate, the probability of licking to CS-. The diagonal (blue dotted line) represents random behavior and the bigger the area under the curve (AUC-ROC), that is the higher left the curve goes, the better the classifier and the performance (Fig. 1C). We found that there is a significant increase in the AUC-ROC value during the first 60 trials of the session (when the animal is learning to associate the CS with the reward) compared to random behavior, and that there is an even better performance during the last 60 trials of the task where animals reach proficiency (Fig. 1D; WT AUC-ROC: 0.73 ± 0.08 in the first 60 trials and 0.98 ± 0.02 in the last 60 trials, n = 7, Hanley-McNeil: p = 0.0015; Fmr1 KO AUC-ROC: 0.72 ± 0.08 in the first 60 trials and 1 ± 0 in the last 60 trials, n = 8, Hanley-McNeil: p = 0.0002. AUC-ROC values are presented as Mean ± SEM). However, we did not find any differences between strains, suggesting that WT and Fmr1 KO mice performance in the go-no go task do not differ (WT vs. Fmr1 KO AUC-ROC in the first 60 trials, Hanley-McNeil: p = 0.93; WT vs. Fmr1 KO AUC-ROC in the last 60 trials, Hanley-McNeil: p = 0.38). To confirm our results, when animals were proficiently discriminating mineral oil from isoamylacetate, we trained them to discriminate an additional pair of odorants: 2-butanone (CS-) and phenylacetate (CS+). We found that both, proficient WT and Fmr1 KO animals, were faster at discriminating novel olfactory stimuli, with some of them reaching more than 85% of correct responses during the second block of the session (Fig. 1E, left; n = 10 WT and 9 Fmr1 KO, Mixed-effects analysis with post hoc Bonferroni’s multiple comparison test between WT and Fmr1 KO: p > 0.05 in all blocks of Day 1). Moreover, WT and Fmr1 KO were able to reverse the hedonic value of the stimuli and discriminating 2-butanone as the (CS+) and phenylacetate as the (CS-). Note that they start close to 20% of correct responses and in one session they reach criteria (Fig. 1E, right; n = 10 WT and 9 Fmr1 KO, Mixed-effects analysis with post hoc Bonferroni’s multiple comparison test between WT and Fmr1 KO: p > 0.05 in all blocks of Day 2). Next, we evaluated whether Fmr1 KO animals were able to discriminate complex odor mixtures. To do this, we used a mixture of 10 odorants as the rewarded stimulus (10 C, CS+; isoamyl acetate, ethyl valerate, 5-methyl-2-hexanone, isopropyl benzene, 1,7-octadiene, 2-heptanone, heptanal, 4-methyl-3-penten-2-one, 1-pentanol, and nonane) versus the same mixture but lacking nonane as the unrewarded stimuli (10–1C, CS-). Perceptual discrimination of these two particularly similar (and complex) olfactory stimuli has been suggested to be a “hard task” as the stimuli will induced overlapped neuronal activation patterns [24]. Compared to monomolecular odorants, we found that this task was harder for animals to complete and took WT mice on average two sessions to reach criteria (Fig. 2A). Importantly, Fmr1 KO were not capable of reaching criteria even after two training sessions, suggesting that olfactory processing is altered in this animal model(Fig. 2A; Day 1: n = 12 WT and 9 Fmr1 KO, Mixed-effects analysis with post hoc Bonferroni’s multiple comparison test between WT and Fmr1 KO: p < 0.05 on blocks 7 to 10; Day 2: n = 6 WT and 7 Fmr1 KO, Mixed-effects analysis with post hoc Bonferroni’s multiple comparison test between WT and Fmr1 KO: p < 0.01 on blocks 2 to 7). Consistent with these results, the AUC-ROC analysis also showed differences between the WT and the Fmr1 KO when the last 60 trials where compared during Day1 and Day2 (Fig. 2B; WT AUC-ROC = 0.99 ± 0.007 and Fmr1 KO AUC-ROC = 0.72 ± 0.070 in the last 60 trials of Day 1, Hanley-McNeil: p = 0.0001; WT AUC-ROC = 0.99 ± 0.005 and Fmr1 KO AUC-ROC = 0.70 ± 0.08 in the last 60 trials of Day 2, Hanley-McNeil: p = 0.0003. AUC-ROC values are presented as Mean ± SEM).
Fig. 1
Fmr1 KO mice have similar olfactory learning capabilities compared to WT mice but show a higher detection threshold for nonane. (A) Diagram of the go-no go behavioral task. Once the animal placed its snout in the odor port the olfactory stimulus was delivered for two seconds. The animal was required to stay at least for 500ms in the odor port after the stimulus was delivered for a trial to be considered as valid. If the animal licked a water tube during CS + presentation, water was delivered as a reward. (B) Behavioral responses to isoamyl acetate (CS+) vs. mineral oil (CS-). WT and Fmr1 KO mice show similar olfactory learning. Mice who did not reach criterium on the first day repeated the test the following day (Fig. S1). (C) Receiver operating characteristics (ROC) analysis. The ROC graph depicts relative tradeoffs between benefits (true positives: TP, licking to CS+) and costs (false positives: FP, licking to CS-). The diagonal (blue dotted line) represents random behavior, and the bigger the area under the curve (AUC-ROC) the better the classifier. (D) AUC-ROC summary of the first and last 60 trials of the isoamyl acetate vs. mineral oil task. (E) Behavioral responses to phenyl acetate vs. 2-butanone. On the first day, phenyl acetate served as the CS + and 2-butanone as the CS-. The following day, the hedonic values of the two odorants were reversed. In B and E, shaded area represents mean ± standard deviation (SD). In D, bars represent the standard error (SEM; *p < 0,05, **p < 0,01, ***p < 0,001, ****p < 0,0001)
Fig. 2
Fmr1 KO mice show impairments in the discrimination of complex odor mixtures. (A) Behavioral responses of the go/no-go task involving the discrimination of two complex odor mixtures: 10 C (CS+) is a mixture of 10 monomolecular odorants diluted in mineral oil, while 10 C-1 (CS-) is composed of 9 of the 10 odorants used for 10 C. Mice who did not reach the criterium on the first day repeated the test the following day. Compared to WT mice, Fmr1 KO shows deficiencies in correctly discriminating 10 C from 10 C-1. (B) AUC-ROC summary of the first and last 60 trials of each session of 10 C vs. 10 C-1 task. (C) Behavioral responses to isoamyl acetate (CS+) vs. mineral oil (CS-), 5 weeks later. Only the mice that previously reached criterium on this task were allowed to perform the test in this instance. Compared to WT mice, Fmr1 KO shows a worse performance in the first blocks of the session, suggesting deficiencies in correctly remembering previously learned olfactory tasks. (D) AUC-ROC summary of the first and last 60 trials of the session. In A, shaded area represents mean ± standard deviation (SD). In B and D, bars represent the standard error (SEM; *p < 0,05, **p < 0,01, ***p < 0,001, ****p < 0,0001)
These results suggested that other cognitive functions involving the PC could also be altered in the Fmr1 KO. Therefore, we decided to test long-term memory in these mice. To do this we evaluated whether mice could still distinguish between isoamyl acetate and mineral oil five weeks after they became proficient in the go-no go task. In this case, we found differences between groups. Both started the test at chance levels, but the WT animals rapidly reached criteria suggesting that they remember the task (Fig. 2C). On the contrary, the Fmr1 KO animals showed similar behavior as the first day of training in the go- no go task (Fig. 1B), slowly reaching criteria during the first session (Fig. 2C; n = 6 WT and 8 Fmr1 KO, Mixed-effects analysis with post hoc Bonferroni’s multiple comparison test between WT and Fmr1 KO: p < 0.001 on blocks 2 and 3). The AUC-ROC analysis confirmed that there are differences in the performance of KO when the first and last 60 trials were compared (Fig. 2D; WT AUC-ROC = 0,93 ± 0,05 and Fmr1 KO AUC-ROC = 0.85 ± 0.06 in the first 60 trials, Hanley-McNeil: p = 0.28; WT AUC-ROC = 1 ± 0 and Fmr1 KO AUC-ROC = 1 ± 0 in the last 60 trials, first 60 vs. last 60 trials in the Fmr1 KO, Hanley-McNeil: p = 0.009; AUC-ROC values are presented as Mean ± SEM).
Taken together our results show that neuronal processes such as olfactory discrimination and long-term memory are deficient in Fmr1 KO suggesting that physiological alteration in the PC could in part underpin these observations.
Layer II principal neurons of the piriform cortex display enhanced excitabilityBecause several cortical regions have been reported to exhibit a hyperexcitable phenotype in the Fmr1 KO mice model [4], we examined if the olfactory behavioral alterations seen in the Fmr1 KO might be related to differences in PC cellular excitability. To do this, we performed whole-cell patch clamp recordings from PC layer II principal neurons to evaluate active and passive membrane properties of this cell population. An example of a principal cell was confirmed by immunostaining of biocytin-filled recorded neurons (Fig. 3A). First, we assessed neuron excitability measuring the number of action potentials (AP) elicited in response to a series of current steps of increasing amplitude and equal duration (F-I curve, see Methods). Results from these experiments show that layer II principal cells from Fmr1 KO mice exhibit a higher firing frequency response to similar current injections (Fig. 3B and C; n = 12 for WT and Fmr1 KO; Two-way ANOVA: p = 0.02). The increment in AP frequency in the Fmr1 KO group was detected for current stimuli as low as 225pA and gets stronger for larger current steps (Fig. 3C; Post hoc Sidak’s multiple comparison test p = 0.039). As a measure of the gain, we quantified the slope of the linear segment of the F-I curve for each recorded cell (see Methods). Our data indicate that layer II principal neurons from Fmr1 KO display a significantly steeper F-I curve slope than WT neurons (Fig. 3D; WT: 4.54 ± 1.8 Hz/pA, n = 12; Fmr1 KO: 6.76 ± 2.2 Hz/pA, n = 12; t-test, p = 0.014), further supporting the hypothesis of an increased principal neuron excitability. As an additional measure of excitability, we evaluated the rheobase, which is the minimum current needed to elicit at least one AP. We found that Fmr1 KO layer II principal cells display a lower rheobase compared to WT neurons (Fig. 3E; WT: 208.3 ± 96 pA, n = 12; Fmr1 KO: 116.7 ± 36 pA, n = 12; Welch’st-test, p = 0.008), indicating that less current is needed to reach AP threshold.
Fig. 3
Whole cell patch clamp recordings showed that Piriform Cortex (PC) layer II neurons from Fmr 1 KO mice are hyperexcitated compared to WT control. (A) Confocal fluorescent microphotography of a biocytin-labeled neuron recorded in layer II of the PC from a brain slice of a Fmr1 KO mouse. The nuclei from surrounding cells are stained with DAPI. (B) Representative whole-cell current-clamp recordings in response to a current pulse of 125 pA (blue traces) of neurons from WT (black) and Fmr1 KO (red) mice. (C) Firing frequency in response to increasing current steps from WT (black circles) and Fmr1 KO (red squares) neurons, starting from a holding voltage of -85 ± 2.5 mV. For both groups, n = 12. Light colors represent individual cells while bold colors show the average firing frequency vs. current curves of WT and Fmr1 KO cells. Two-way ANOVA results: strain factor p < 0.0001; current factor p < 0.0001; interaction: p = 0.0212. Sidak’s multiple comparison (*: p < 0.05, **: p < 0.01; ***: p < 0.0001). (D) Rheobase of WT and Fmr1 KO neurons obtained from the intercept with the X axis of each firing frequency curve shown in B. (E) Firing frequency slope of the linear segment of each curve shown in B. Here, and in all following figures, middle horizontal line and bars correspond to the mean and S.E.M respectively. All the upcoming figures follow the same color scheme used here, where black represents data from WT cells and red from Fmr1 KO cells
We next evaluated whether these alterations in excitability are associated to changes in active membrane properties using a protocol of small current steps (see details in Methods) to examine AP threshold, half width, amplitude and overshoot, as well as fast afterhyperpolarization amplitude (fAHP) (Fig. 4). To establish an initial comparison between APs from each mice line, phase plots were constructed to allow easier visualization and analysis of the AP trajectory and properties (Fig. 4B). Thus, AP threshold was calculated taking the voltage point for which dV/dt surpassed 10 mV/ms [25, 26], showing that Fmr1 KO cells have more hyperpolarized AP thresholds than WT neurons (Fig. 4C; WT: -51.2 ± 4.5 mV, n = 12; Fmr1 KO: -56.5 ± 5.7 mV, n = 13; t-test, p = 0.0165), which is consistent with the previously described increased excitability. We also found that the AP overshoot, corresponding to the voltage value at the peak, was different between groups (Fig. 4E; WT: 48.7 ± 6.8 mV, n = 12; Fmr1 KO: 42.2 ± 4.5 mV, n = 13; t-test, p = 0.009). Interestingly, there was no difference in AP amplitude measured from the threshold to the peak voltage (Fig. 4D; WT: 99.93 ± 6.23 mV, n = 12; Fmr1 KO: 98.67 ± 5.99 mV, n = 13; p = 0.612). On the other hand, we found no differences in AP half-width (Fig. 6G; WT: 0.77 ± 0.11ms, n = 12; Fmr1 KO: 0.75 ± 0.12 ms, n = 13; p = 0.5721). While it would be tempting to interpret this observation as suggesting that conductances involved in repolarization are not altered, a diversity of voltage-gated Ca2+ currents and voltage- and Ca2+-dependent K+ channels could differentially fasten or retard this phase, such that changes in specific components could be masked (See Discussion). Moreover, the average phase plot in Fig. 4B shows a lower dV/dt for the AP rising phase (upstroke) in Fmr1 KO neurons, which could also affect half-width.
Fig. 4
Fmr1 KO pyramidal neurons have lower threshold for action potential generation compared to the WT. (A) Representative traces of voltage responses to depolarizing current steps of 5 pA until the appearance of an action potential, triangles indicate the first spike. Inset shows examples of first spikes aligned by peak, highlighting relevant properties: threshold (Thr), amplitude, overshoot, half-width (H-W) and fast after hyperpolarization (fAHP) are indicated. (B) Average phase-plot of the first evoked spike of each cell. Arrows illustrate the relevant information that can be obtained from the plot. (C) Action potential (AP) threshold determined as the voltage where dV/dt > 10 mV/ms. (D) AP amplitude determined from threshold to peak. (E) AP overshoot form 0 mV. (F) AP half-width. (G) Latency to reach threshold from onset of the stimulus. (H) fAHP amplitude calculated as the minimum voltage reached minus threshold (*: p < 0.05; **: p < 0.01)
The latency, defined here as the time for the cell to reach the first AP threshold from stimulus onset, was also not different (Figs. 4G and 141.1 ± 98.22 ms, n = 12; Fmr1 KO: 152.2 ± 67.8 ms, n = 13; p = 0.7447). Lastly, we assessed the fast afterhyperpolarization (fAHP), a behavior of membrane potential after an AP is elicited. The presence of a fAHP has been associated to increase firing rates due to the removal of Na+ channel inactivation and the subsequent triggering of APs. We measured fast AHP (fAHP), which usually rely on fast inactivating Kv3 subfamily K+ channels [29] as well as large-conductance voltage- and Ca2+-dependent K+ channels (BK channels), promoting repetitive spiking. We found that fAHP, measured with respect to AP threshold (Fig. 4H), was not different between groups (WT: -35.6 ± 8.7 mV, n = 12; Fmr1 KO: -40.4 ± 7.0 mV, n = 13; p = 0.1471). Altogether, the change in AP threshold suggests the involvement of voltage-dependent conductances in the hyperexcitable phenotype seen in Fmr1 KO cells.
Finally, because hyperexcitability can arise from changes in cell passive properties involving leak channels modulation, expression and function [30,31,32], as well as cell size we also examined resting potential, membrane capacitance, input resistance and time constant in WT and Fmr1 KO neurons. Briefly after attaining the whole-cell configuration, we switched to current clamp (I = 0) to estimate the resting membrane potential (Fig. 5A). We found no difference between WT (-79.0 ± 4.4 mV, n = 12) and Fmr1 KO (-77.7 ± 6.8 mV, n = 15) animals (Welch’s t-test; p = 0.56). These values are consistent with previous reports on PC layer II pyramidal neurons from WT mice [33]. Similarly, membrane capacitance (Cm), a correlate of somatic size, showed no differences between Fmr1 KO and WT neurons (Fig. 5B; WT: 50.7 ± 23.1 pF, n = 12; Fmr1 KO: 45.7 ± 21.5 pF, n = 15; Welch’s t-test; p = 0.57). Then, we evaluated the cell membrane resistance, which determines the amount of current needed to change the membrane potential, and the time constant (time needed to charge/discharge the membrane capacitor). Both parameters showed no differences between groups (Fig. 5C; WT = 133.3 ± 70.4 MΩ, n = 12; Fmr1 KO = 164.9 ± 67.6 MΩ, n = 15, t-test. p = 0.25; and WT = 11.8 ± 4.4 ms, n = 12; Fmr1 KO = 12.7 ± 2.9 ms, n = 15; t-test, p = 0.55, respectively).
Fig. 5
There are no differences in the passive membrane properties and sag ratio from layer II PC neurons in the Fmr1 KO mice compared to WT. (A) Resting membrane potential measured briefly after attaining whole cell configuration in current-clamp mode I = 0. (B) Left: Sample traces of voltage clamp step protocol used to calculate the membrane capacitance (Cm). The dashed box shows the capacitive transient used to calculate Cm. Right: membrane capacitance for each cell. (C) Left: Sample traces from the protocol used for input resistance (Rin) and Tau (τ) calculation. Dashed boxes show the segment used for τ (1) and Rin (2) calculation as described in materials and methods. Middle: Rin for each cell. Right: Cm for each cell. (D) Left: Sample traces of the protocol used to calculate sag ratio. Inset shows zooming of one recording illustrating the presence of sag. Arrows indicate the minimum voltage reached and bar shows the steady state segment used for Sag ratio calculation. No differences between both groups’ means where found for all data shown
Fig. 6
Spontaneous excitatory postsynaptic currents (sEPSC) recordings from Fmr1 KO mice show similar average amplitude, frequency, and kinetics. (A) Representative sample traces of sEPCS recorded from Fmr1 KO (red) and WT (black) neurons. Inset shows representative sEPSC events from Fmr1 KO and WT cells. Graphs (B), (C), (D) and (E) show the per-cell average of sEPSC amplitude, frequency, rise time and decay time, respectively, for Fmr1 KO and WT cells
While it is not a passive property, we included in this figure a quantification of the sag ratio as a measure of the presence of the hyperpolarization-dependent current, h-current, which can affect cell intrinsic excitability by reducing the effective input resistance. While h-current has been showed to be augmented in Fmr1 KO in neurons of the somatosensory cortex [34], we found no alterations in sag ratio in PC neurons from Fmr1 KO (Fig. 5D.2 ± 2.5%, n = 12; Fmr1 KO: 4.1 ± 2.6% n = 12, Welch’s t-test p = 0.96) suggesting that this current does not contribute to the observed hyperexcitability. Altogether, passive membrane properties do not underlie the hyperexcitability phenotype observed in the layer II principal cells of the PC.
Altered synaptic excitatory-inhibitory balance in the piriform cortex of the Fmr1 KO miceAt the network level, hyperexcitability alterations can depend on excitatory-inhibitory imbalance of the neuronal circuits in FXS, as has been reported in other neurodevelopmental disorders [35, 36]. Thus, using whole-cell voltage-clamp we explored excitatory and inhibitory neurotransmission in the PC of Fmr1 KO mice by recording both excitatory (Fig. 6) and inhibitory (Fig. 8) spontaneous synaptic currents (sEPSC and sIPSC, respectively). We found no differences for sEPSC per cell in mean amplitude (Fig. 6A, B; each point corresponds to a cell; WT: 10.5 ± 1.8 pA, n = 9; Fmr1 KO: 11.1 ± 1.0 pA, n = 10; t-test, p = 0.37) or frequency (Fig. 6C; WT: 3.8 ± 3.5 Hz, n = 9; Fmr1 KO: 3.8 ± 4.1 Hz, n = 10; t-test, p = 0.99) between groups. Since changes in the distribution can be hidden by average calculation, we proceeded to compare the distribution of amplitudes and inter-event intervals between WT and Fmr1 KO. We recorded a total of 2843 and 4318 events from neurons from WT and Fmr1 KO animals, respectively, and calculated the cumulative probability distributions (CPDs) using a bootstrapping approach to address potential biases caused by imbalances in sample sizes per cell (see Methods). We observed that Fmr1 KO neurons displayed sEPSC amplitudes distributed toward higher values (Fig. 7A; permutation-based KS (pb-KS) test D = 0.09 ± 0.01; p < 0.0001) when compared to WT controls. The CPDs for the inter-event intervals were also different between groups, as Fmr1 KO sEPSC distribute with more probability towards shorter times (Fig. 7B; pb-KS test D = 0.05 ± 0.01; p < 0.01).
Fig. 7
Distribution of sEPSC population´s amplitude, inter-event interval and kinetic parameters from Fmr1 KO and WT neurons are different. (A) Left: Histogram of sEPSC amplitudes from all WT and all Fmr1 KO cells (bin = 2 pA). Right: bootstrapped cumulative probability distribution (CPD) graph of sEPSC amplitudes. Graphs (B), (C) and (D) show the same as in (A) but for inter-event intervals (bin = 50 ms), rise times (bin = 0.2 ms) and decay times (bin = 0.5 ms) respectively. Distributions are different between groups (**: p < 0.01; ****: p < 0.0001)
Fig. 8
Spontaneous inhibitory postsynaptic currents (sIPSC) recordings from Fmr1 KO mice display similar sIPSC average amplitude, frequency, and kinetics. (A) Representative sample traces of sIPCS recorded from Fmr1 KO (red) and WT (black) neurons. Inset shows representative sIPSC events from Fmr1 KO and WT cells. Graphs (B), (C), (D) and (E) show the per-cell average of sIPSC amplitude, frequency, rise time and decay time, respectively, for Fmr1 KO and WT cells
The kinetics of synaptic currents recorded at the cell body depend on how far from the soma the synaptic contacts and neurotransmitter receptors are located [37, 38], the subunit composition of the neurotransmitter receptors [39, 40], as well as other factors such as receptor clustering and transmitter clearing from the synaptic cleft [41]. Since FMRP is known to affect the expression of AMPA and GABAA receptors [42, 43] it is possible that the observed differences in the CPDs of sEPSC might arise due to differences in the types of neurotransmitter receptors expressed in these cells. Therefore, we evaluated sEPSC kinetics in WT and Fmr1 KO cells, finding no differences for sEPSC decay times (Fig. 6C; WT: 3.7 ± 0.6 ms, n = 9; Fmr1 KO: 3.3 ± 0.7, n = 10; t-test, p = 0.21) and rise times (Fig. 6D; WT: 1.5 ± 0.2 ms, n = 9; Fmr1 KO: 1.3 ± 0.3 ms, n = 10; t-test, p = 0.077) between groups. However, CPD of rise and decay times of sEPSC strongly differ between WT and Fmr1 KO, showing that rise times (Fig. 7D; pb-KS test D = 0.14 ± 0.01; p < 0.0001) as well as decay times (Fig. 7C; pb-KS test D = 0.10 ± 0.01; p < 0.0001) distribute towards faster kinetics in Fmr1 KO cells.
With respect to sIPSC, there were no differences for sIPSC mean amplitude (Fig. 8B; WT: 23.6 ± 6.7 pA, n = 10; Fmr1 KO: 23.9 ± 8.1 pA, n = 9; t-test, p = 0.93) and frequency (Fig. 8C; WT: 10.4 ± 5.6 Hz, n = 10; Fmr1 KO: 11.7 ± 5.4 Hz, n = 9; t-test, p = 0.61) between Fmr1 KO and WT controls. We recorded a total of 10,648 and 9949 events in WT and Fmr1 KO neurons, respectively. As for sEPSC, we calculated the CPDs using a bootstrapping approach to evaluate possible differences in the distribution of sIPSC properties. However, CPDs of Fmr1 KO sIPSC amplitudes were slightly shifted toward lower values (Fig. 9A; pb-KS test D = 0.043 ± 0.0063; p < 0.0001) when compared to WT controls. The CPDs for the inter-event intervals distribute with more probability towards shorter intervals (Fig. 9B; pb-KS test D = 0.066 ± 0.0049; p < 0.0001) compared to WT. There are also no differences in sIPSC decay times (Fig. 8E; WT: 3.8 ± 0.4, n = 10; Fmr1 KO: 3.7 ± 0.4, n = 9; t-test, p = 0.63) nor rise times (Fig. 8D; WT: 1.1 ± 0.2, n = 10; Fmr1 KO: 1.2 ± 0.2, n = 9; t-test, p = 0.93) between groups. However, CPD of sIPSC rise times distributes towards slower kinetics (Fig. 9C; pb-KS test D = 0.03 ± 0.01; p < 0.05), while the decay times (Fig. 9D; pb-KS test D = 0.03 ± 0.01; p < 0.01) CPDs distributed towards faster kinetics in Fmr1 KO. Thus, our data suggests that there is a change in the synaptic population responsible to sustain excitatory-inhibitory balance that may favor a higher excitability in the Fmr1 KO PC.
Fig. 9
Distribution of sIPSC population´s amplitude, inter-event interval and kinetic parameters from Fmr1 KO and WT neurons are different (A) Left: Histogram of sIPSC amplitudes from all WT and all Fmr1 KO cells. Right: bootstrapped CPD graph of sIPSC amplitudes (bin = 5 pA). Graphs (B), (C) and (D) show the same as in (A) but for inter-event intervals (bin = 20 ms), rise times (bin = 0.2 ms) and decay times (bin = 0.5 ms) respectively. (*: p < 0.05, **p < 0.001; ****: p < 0.0001)
Comments (0)