Data collection and preprocessing
The gene expression profile GSE213337 was retrieved from the NCBI Gene Expression Omnibus database. The dataset was produced by Li et al., which contains the sc-RNA-seq data of hearts from the control and streptozotocin (STZ)-induced diabetic mice [6]. Briefly, male C57BL/6 mice (22–25 g, 8 weeks old ) were injected with 150 mg/kg of STZ intraperitoneally to construct a diabetic model. The glucose level above 16.7 mmol/L indicated that the diabetic model was successfully completed, and the equal volume of sodium citrate was injected intraperitoneally as control. The mice were sacrificed eight weeks after injection, and the hearts of mice were extracted. The single-cell suspension was obtained by enzyme digestion, and scRNA-Seq was performed.
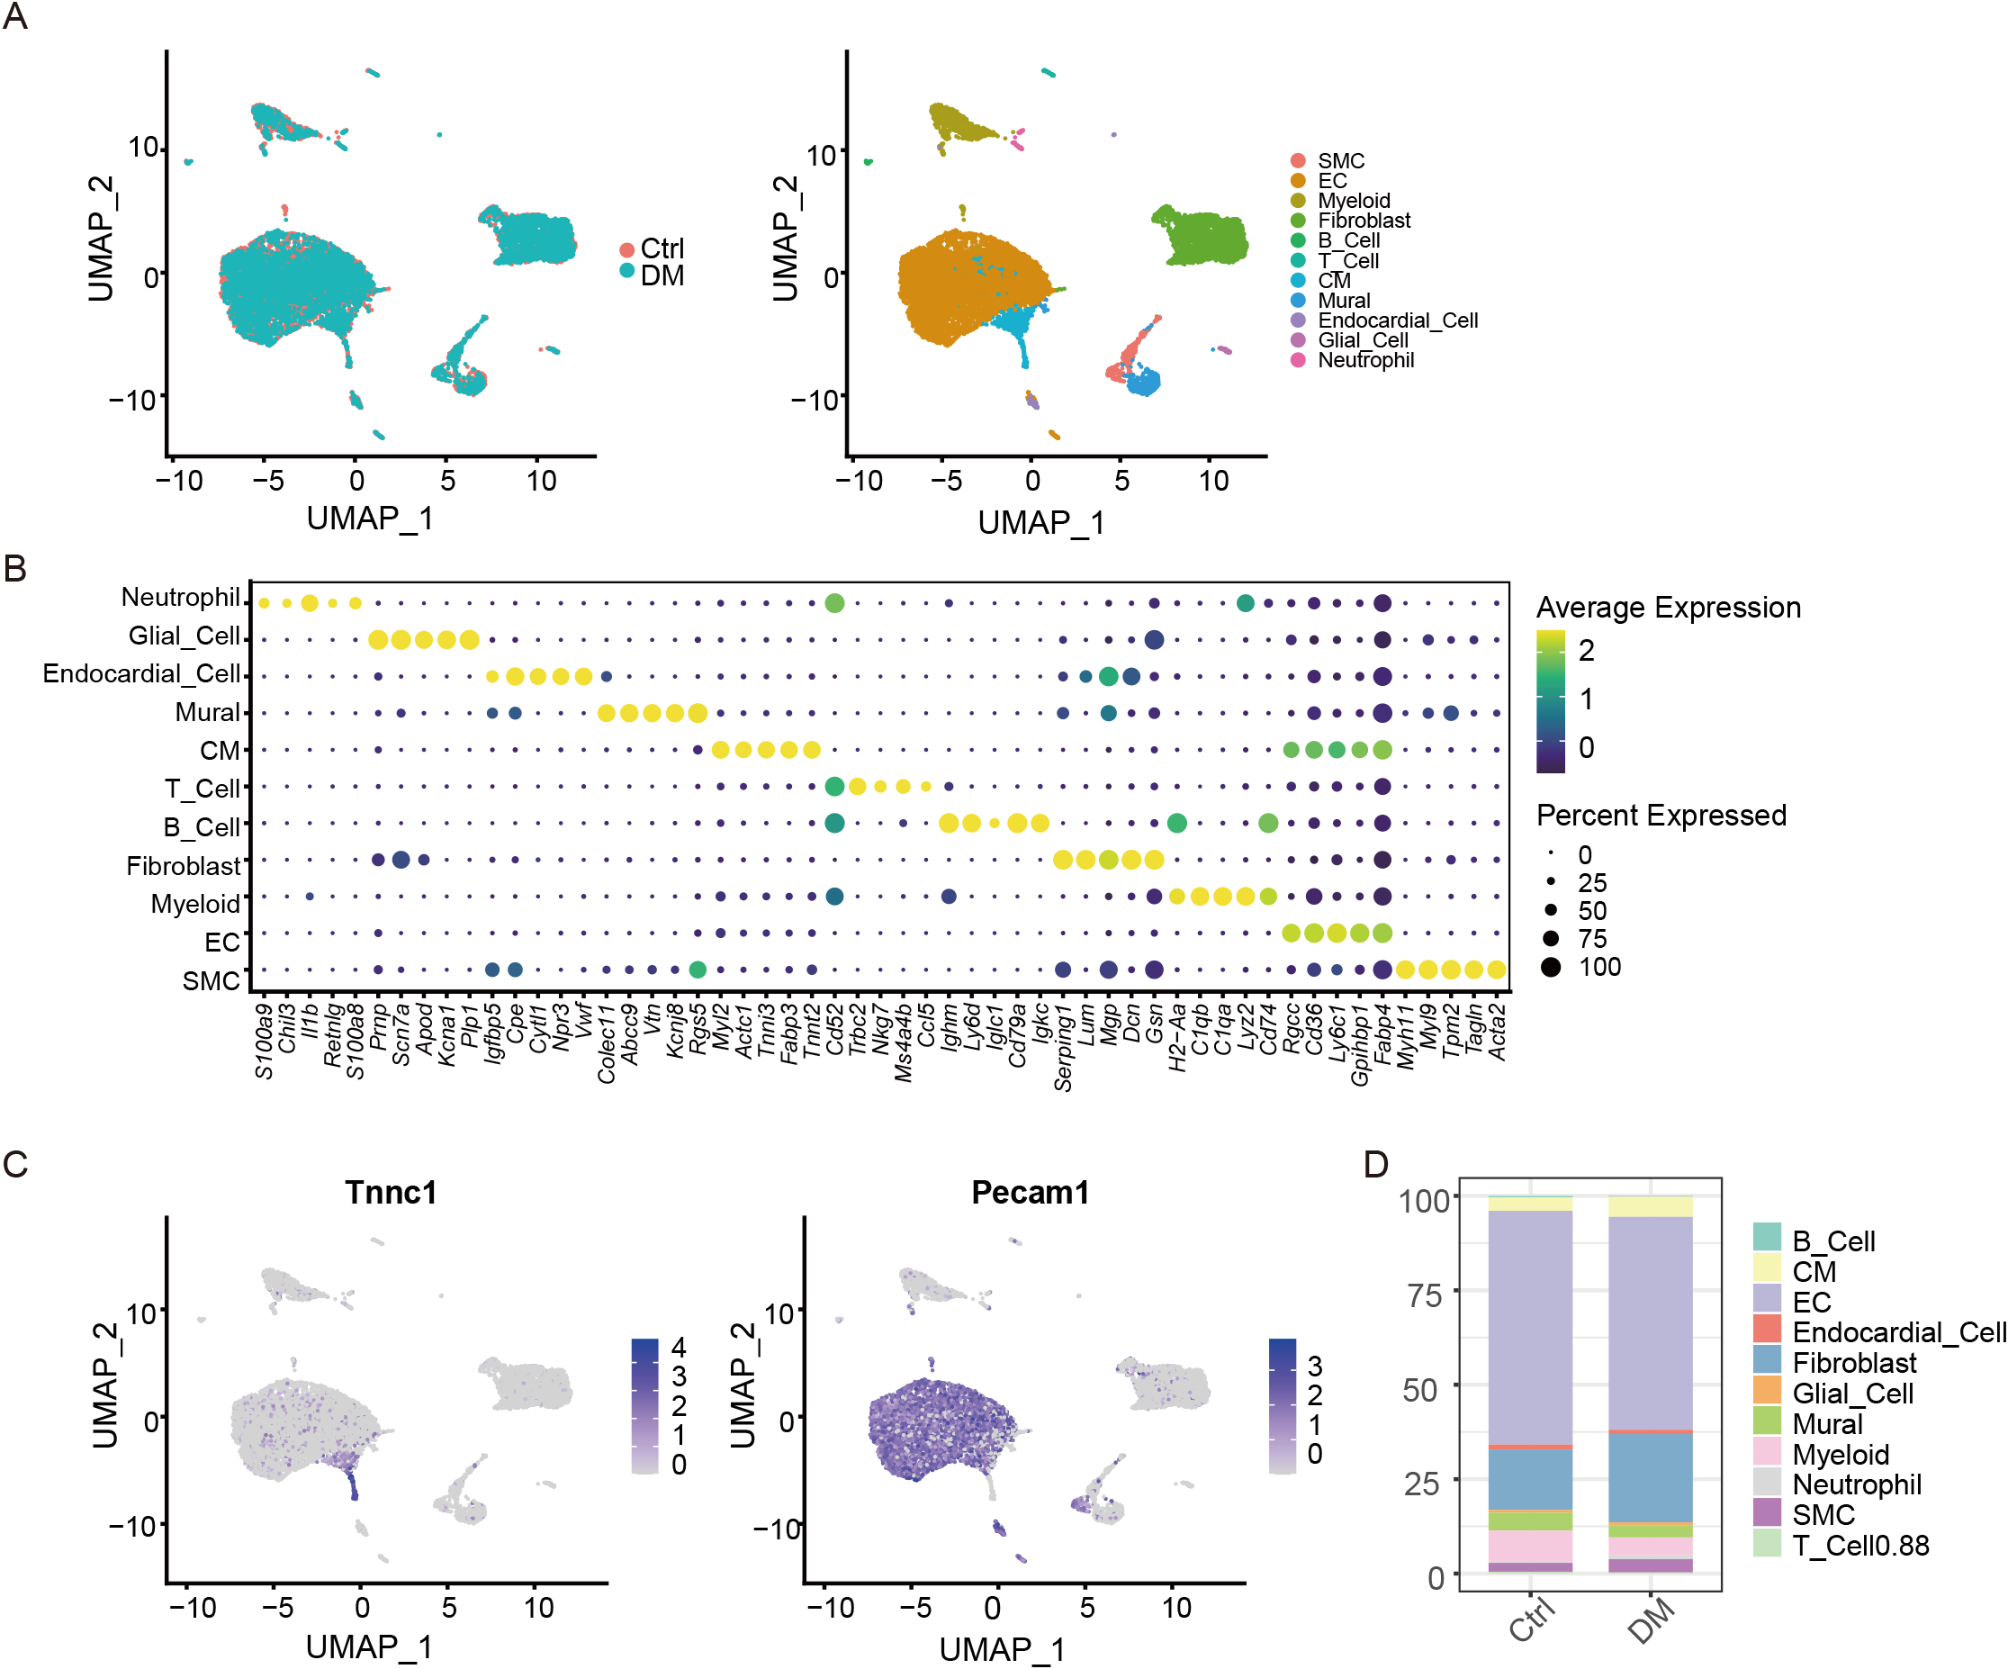
Data were read into the R software (version 4.1.0) using the Seurat package (version 4.1.0) for preprocessing. The cells with > 200 genes and < 30% mitochondrial genes were screened for further analysis. After log-transformation, the top 2000 highly variable genes were calculated using the FindVariableGenes function. The RunPCA function was utilized for linear dimension reduction, and the Harmony package (version 0.1.0) was used to remove the batch effects. The top 30 principal components were used to calculate the nearest-neighbor distance by “FindNeighbors”.
Moreover, UMAP was applied for nonlinear dimension reduction, “DoubletFinder” package (version 2.0.3) to remove double cells. Finally, the data filtering was performed and cells with Nfeature RNA greater than 200 and nCount RNA less than 20,000 were left for analysis.
Cell cluster analysis
The FindClusters function was adopted for cell clustering with a resolution of 0.5. The FindAllMarker function was utilized to calculate the differentially expressed genes among the diverse cell subclusters (min.pct = 0.25, logfc.threshold = 0.25, only.pos = TRUE).
The data of the CMs and ECs were extracted for reclustering and analysis, respectively. The FindClusters function was adopted for cell clustering with a resolution of 0.3. A functional enrichment analysis was performed by using the clusterProfiler package (version 4.2.2). The Monocle2 package (version 2.22.0) was applied for the trajectory analysis.
Use the “newCellDataSet” function to generate an object for trajectory analysis (expressionFamily = negbinomial. size). Only genes with a mean expression value greater than 0.1 and expressed in at least 10 cells were used for the trajectory analysis. The “differentialGeneTest” function was used to identify the differentially expressed genes among the cell subsets, and the genes with q-value < 0.01 were used for dimension reduction. We use the “reduceDimension” function to reduce the dimension, with parameters set to reduction_method= “DDRTree” and max_components = 2. Use “plot_cell_trajectory” to sort and visualize the cells. We used “differentialGeneTest” function parameter set to fullModelFormulaStr= “~sm.ns(Pseudotime)” to calculate genes changed with pseudotime (q-value < 1e-10).
Cell communication analysis
The CellChat package (version 1.1.3) was utilized for cell communication analysis to investigate the significant signaling pathways and ligand-receptor interactions. We used the “createCellChat” function to build CellChat objects and used CellChatDB.mouse as the ligand and receptor database to select the interaction type of “Cell-Cell Contact”. We used “getMaxWeight” to identify the number of cell interactions compared with the network map.
Construction of DM mice model and validation of novel genes
To further validate the novel genes in both the ECs and CMs, the diabetic model was constructed according to the report from Li et al. [6]. Male mice (C57, 22–25 g, 8 weeks old) were purchased from Meixuan Biological Co., Ltd (Shanghai, China). The animal studies obtained the approval from the China-Japan Union Hospital of Jilin University (SY202311022). Subsequently, mice from the control and Diabetes mellitus (DM) groups (n = 6) were sacrificed eight weeks after diabetic conduction. Based on the study by Li et al. [6], all the mice were euthanized and then the hearts were carefully cut off and saved in a tissue storage solution. Moreover, real-time quantitative PCR (qRT-PCR) analysis was performed to investigate the mRNA expression of the novel genes and immunofluorescence for their protein expression in the heart.
Cell culture
ECs and CMs (Procell, Wuhan, China) were purchased and cultured in special medium. ECs were cultured alone as the control group, and ECs and CMs were co-cultured as the experimental group. After the cells reached 90% confluence, both groups of cells were cultured in medium containing 16.7mM glucose (high glucose, HG) at 37 ° C and 5% CO2 for 24 h. The cells were then harvested, and Western blot was used to detect the expression of the ligand receptor.
Quantitative real-time polymerase chain reaction
Cells were lysed using Trizol (Invitrogen, Carlsbad, USA) and RNA was extracted. The extracted, total RNA was reverse transcribed into cDNA using an Ex Script-TM RT kit (Takara, Kusatsu, Japan), mRNA was detected by an CFX96 TOUCH real-time PCR machine (Bio-Rad, Hercules, USA) using 2x SYBR Green qPCR premix, and the degree of mRNA in each sample was normalized to GAPDH RNA levels. The primers were as follows: GAPDH-F: CTTTGGTATCGTGGAAGGACTC, GAPDH-R: GTAGAGGCAGGGATGATGTTCT; Angptl4-F: GGGACGAGATGAATGTCCT, Angptl4-R: CTTGAGTTGTGTCTGCAGG; Cdh5-F: ATTGGATTTGGAACCAGATGC, Cdh5-R: CGCTTGACTTGATCTTGCC; Sdc3-F: GCTCGTAGCTGTGATTGTG, Sdc3-R: CTTCATACGATAGATGAGCAGTG.
Immunofluorescence
The expressions of Angptl4, Cdh5 and Sdc3 in myocardium of mice were detected by immunofluorescence staining. After deparaffinization, rehydration, and antigen repair, blocking treatments were performed for 30 min. The slides were incubated with Angptl4(1:1000, ABconal, Wuhan, China), Cdh5(1:1000, ABconal, Wuhan, China) and Sdc3(1:2000, ABconal, Wuhan, China).at 4 °C overnight, then incubated with horseradish peroxidase (HRP) -conjugated secondary antibody for 1 h. Nuclei were counterstained with DAPI. Pictures were collected using a fluorescence microscope after sealing the slides.
Western blot
Cells were lysed in RIPA buffer (Beyotime, Shanghai, China) and centrifuged at 12,000 rpm for 30 min at 4 °C for protein isolation and collection. Protein concentrations were measured using the BCA Protein Assay kit (Beyotime, Shanghai, China). Samples were subjected to electrophoretic transmembrane and incubated with primary antibodies overnight at 4 °C (Angptl4 1:1000, Cdh5 1:1000, Sdc3 1:2000). After 2 h of membrane with secondary antibody (1:5000), color was developed using DAB color development solution and visualized by Chemidoc xrs gel imaging system (Bio-Rad, Hercules, USA). Quantitative analysis was processed by Image J software.


Comments (0)