
Remember me


It is of paramount importance to gain insight into the early molecular and epigenetic alterations associated with AD in order to elucidate the underlying mechanisms that precede the onset of clinical symptoms. The results of this study indicate that the observed alterations in protein expression in 3-month-old 5×FAD mice are unlikely to be the result of changes in mRNA abundance. It is therefore plausible that these alterations are linked to ac4C modifications, which represent a form of post-transcriptional regulation of mRNA. This emphasizes the functional importance of ac4C mRNA modifications and indicates their potential role in the initial stages of AD pathophysiology, as demonstrated by the 5×FAD mouse model. We focused on ac4C modifications because of their recognized function in stabilizing mRNA and enhancing translation, processes that are critical for neuronal health and synaptic function [6, 12, 17, 34]. Widespread perturbations in RNA homeostasis play a critical role in neuronal dysfunction [35]. The targeting and reversal of aberrant RNA modifications, including those involving ac4C, may represent a promising strategy for modulating the progressive decline observed in neurodegenerative diseases. Correcting these RNA modifications may enable the modulation of disease progression, thereby offering meaningful therapeutic benefits to individuals affected by such conditions.
The results presented in this study provide valuable insights into the role of mRNA acetylation modifications in the 5×FAD model at three months of age, supported by rigorous within-group reproducibility and stringent quality control standards. Although no significant cognitive deficits were observed in 5×FAD mice at this stage, we detecting significant changes in mRNA acetylation. To ensure the reliability of these findings, extensive quality control measures were implemented to maintain the integrity and accuracy of the data analysis. Measures included minimizing rRNA interference and validating RNA integrity and library quality, contributing to highly consistent sequencing results across biological replicates. Our quality control strategy resulted in robust data, allowing confident identification of 4,537 out of 5,373 ac4C peaks in the WT group and 3,904 out of 4,810 peaks in the 5×FAD group, with a high degree of overlap between replicates. This consistency underlines the credibility of our results and highlights the need for stringent quality standards when investigating post-transcriptional modifications such as ac4C. This foundation supports the exploration of the broader implications of ac4C modifications on mRNA stability and translation, contributing to our understanding of their potential involvement in the early pathophysiology of AD.
To validate the identification of ac4C peaks, we ensured corroboration with RNA-seq data, confirming the presence of the associated mRNA and reinforcing our findings’ credibility. By employing this rigorous approach, 4,361 credible peaks were confirmed in the WT group and 3,728 in the 5×FAD group. Notably, the 5×FAD group exhibited 1,464 newly acetylated mRNAs and a loss of acetylation in 1,730 mRNAs, compared to 2,789 acetylated mRNAs in age-matched WT mice. Given the well-established influence of ac4C modifications on mRNA translation and stability, it is plausible that these pronounced changes contribute to the pathophysiological processes observed in 3-month-old 5×FAD mice. Notably, that the RNA-seq data revealed no correlation between the pronounced alterations in mRNA acetylation in the hippocampus and significant changes in overall mRNA expression levels. This indicates that ac4C modifications may modulate translation efficiency or influence the spatial conformation of mRNA molecules. Previous studies have demonstrated that ac4C can impact RNA binding properties, which supports this proposition [11]. This evidence supports to the hypothesis that mRNA acetylation may affect in translational regulation.
Here, the proteomic and transcriptomic data demonstrate that, while overall mRNA expression alterations were minimal in early 5×FAD mice, specific ac4C modifications exerted a pronounced influence on the proteomic landscape. The observed differential ac4C enrichment indicates that even subtle RNA modifications can disrupt protein synthesis pathways, potentially driving downstream effects that contribute to early AD pathogenesis. These findings emphasize the necessity of investigating RNA modifications as potential early modulators of AD, thereby elucidating their role in initiating the molecular changes that precede broader neurodegenerative processes. Our results indicate a reduction in protein in 5×FAD mice, which may be associated with the downregulation of the corresponding ac4C-modified mRNAs. GO analysis revealed that these genes are significantly enriched in BP related to synaptic function, including vesicle-mediated transport in synapses, dendrite development, and regulation of synapse organization, among others. It is noteworthy that synaptic dysfunction and an imbalance in excitatory and inhibitory neurotransmission are believed to emerge decades before the onset of cognitive decline. This is accompanied by the loss of presynaptic terminals, which precedes the formation of amyloid beta plaques [36, 37]. This underscores the potential for identifying the pathological mechanisms underlying synaptic dysfunction, thereby enabling early diagnosis and intervention for individuals at high risk of AD, even prior to cognitive decline or Aβ plaque formation. The present study demonstrates that in the early-stages of AD, the expression of proteins associated with synaptic function is diminished. It is noteworthy that while the levels of corresponding mRNAs show no significant differences, the ac4C modification of these mRNAs is markedly downregulated. This suggests that ac4C modification may contribute to the pathological processes leading to altered protein expression associated with synaptic dysfunction in early-stage AD. These findings may help explain the lack of significant changes in mRNA expression observed in previous studies, underscoring the importance of investigating post-transcriptional modifications in AD pathology.
However, the overlap between the genes identified in our study and those from human sequencing data is limited, which may be explained by several factors. (1) The human sequencing data were obtained from postmortem brain tissues of middle- or late-stage AD patients, whereas the 3-month-old 5×FAD mouse model represents the early stages of the disease. (2) Mice and humans differ in gene expression patterns and disease mechanisms, which can result in discrepancies when comparing data from animal models to human studies [38, 39]. (3) Gene expression changes in AD have been shown to be highly region-specific and cell-type-specific [40]. This study focused on the hippocampus, while human postmortem studies examined a broader range of brain regions, including the entorhinal cortex, hippocampus, parahippocampal gyrus, temporal cortex, frontal cortex, parietal cortex, precuneus, cingulate, and occipital cortex.
Furthermore, an exhaustive examination was undertaken of the genes associated with these pathways, resulting in the identification of representative genes that are intimately connected with synaptic function. It is noteworthy that GRIN1, MAP2, and DNAJC6 play a critical role in maintaining synaptic structure and function. GRIN1, which encodes a subunit of the NMDA receptor, is essential for synaptic plasticity and cognitive function [41]. Memantine, an NMDA receptor antagonist, has been shown to alleviate chronic neurotoxicity and improve learning and memory by inhibiting overactivation mediated by the NR1 subunit [42]. In this regard, the downregulation of NR1 subunit of NMDA receptor (Grin1) may offer neuroprotective benefits for AD. The dysfunction of MAP2 has been demonstrated to be closely associated with the pathology of AD, including the formation of neurofibrillary tangles, synaptic dysfunction, and microtubule disassembly [43]. MAP2 is critical in stabilizing the neuronal microtubule network, which is necessary to maintain synaptic connectivity. It is noteworthy that decreased MAP2 expression at synapses precedes the appearance of AD plaques, suggesting that MAP2 alterations may serve as early markers of synaptic pathology and cognitive impairment [44]. DNAJC6 is involved in synaptic vesicle recycling and efficient neurotransmission, with mutations associated with neurodevelopmental and synaptic defects and early-onset parkinsonism [45]. Clinical studies have linked the HSP family proteins, including Dnajc6, to genetic risks of AD. Members of this family have been shown to regulate Aβ protein aggregation, thereby providing a protective effect for AD [46, 47]. The observed downregulation of DNAJC6 in 5×FAD mice suggest impaired vesicle cycling contributes to early synaptic dysfunction.
The imbalance between excitation and inhibition (E/I) is a key pathological hypothesis of AD [48]. Notably, individuals with abnormal neuronal activity, such as epilepsy patients, exhibit a significantly higher incidence of AD in old age. In 5×FAD mice with epileptic seizures, learning and memory deficits are exacerbated [49]. In our study, we observed that GRIN1 and MAP2 were significantly downregulated in PV-positive interneurons, rather than in excitatory neurons, despite interneurons constituting a small proportion of hippocampal neurons. This downregulation of key neuronal proteins likely results in impaired interneuron function, which in turn may lead to abnormal hyperactivity of excitatory hippocampal neurons. These findings point to an early-stage alteration in AD pathology. Previous studies have suggested that MAP2 expression remains unchanged in hippocampal neurons of early-stage AD model mice [50]. Our results are consistent with previous studies [51, 52], indicating that deficits in PV-positive GABAergic interneurons mediate early dysfunction of key proteins in AD. This highlights the critical value of integrative multi-omics approaches, including epigenomic and transcriptomic analyses, in uncovering early-stage pathological changes that might have been previously neglected. By focusing on these lesser-explored cellular populations, we can gain new insights into AD progression and identify potential therapeutic targets that may otherwise have been missed. This collective evidence underscores the importance of ac4C as a regulatory element in protein synthesis and RNA stability, it suggests that reductions in ac4C modifications may trigger early synaptic dysfunction that sets the stage for broader neurodegenerative processes. Moreover, Investigating the role of ac4C modifications in the hippocampus could be particularly valuable in understanding their impact on the regulation of cognitive function in AD. Disruption of these modifications may contribute to AD pathology, highlighting the potential importance of ac4C in the progression of the disease. Understanding these early transcriptomic and proteomic perturbations provides insights into potential molecular targets for therapeutic intervention in AD.
In conclusion, both proteomic and transcriptomic analyses reveal significant dysregulation of ac4C modifications and protein expression, strongly supporting an early neurodegenerative phenotype in the 5×FAD mouse model of AD. Functional enrichment analyses linked downregulated ac4C-modified mRNAs and proteins to pathways associated with neurodegeneration and AD, findings supported by overlap with human disease studies. This alignment highlights the potential contribution of ac4C modifications to early cellular dysfunctions consistent with human AD pathology. Given the current limitations of effective treatment options for AD, understanding these early pathophysiological mechanisms is essential. The focus of this study on ac4C modifications provides new insights into the early molecular changes associated with AD and suggests that these modifications may serve as critical regulators of RNA stability, protein interactions, and neuronal health. Studying these early changes may pave the way for developing novel biomarkers and targeted therapies that could help detect and intervene in the early-stages of the disease, potentially slowing or preventing its progression. Future research should extend these findings by examining the impact of altered ac4C modifications in different brain regions and in human studies. Addressing these early transcriptomic and proteomic changes may provide new opportunities for interventions that prevent or slow significant neurodegenerative damage and ultimately alter the course of AD.
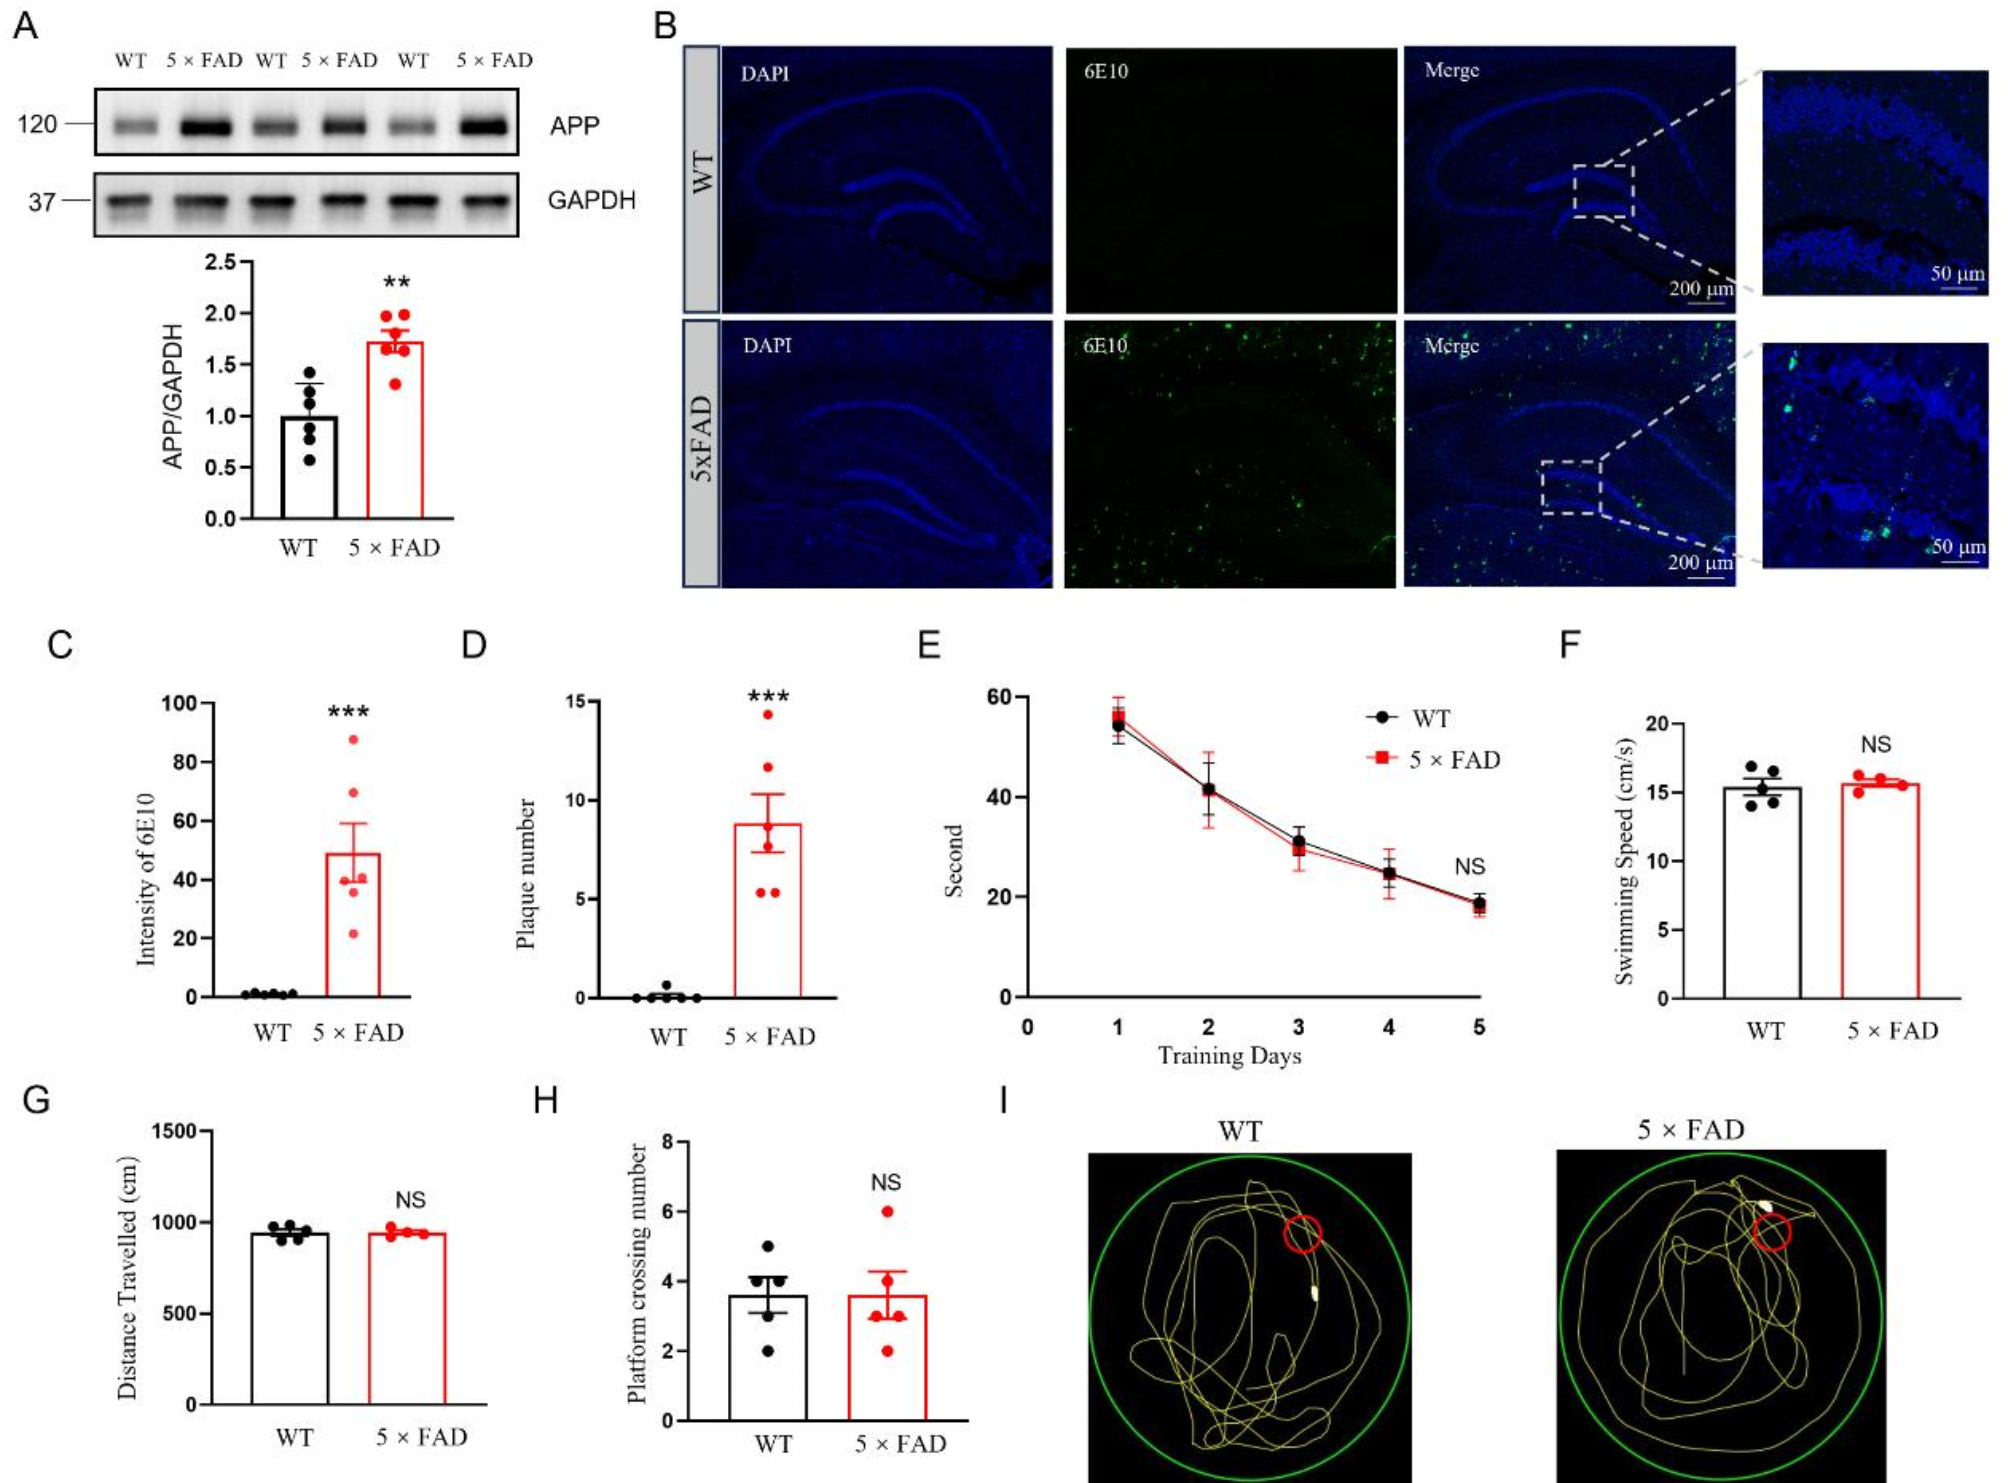
MethodAnimalAll experimental procedures were approved by the Institutional Animal Care and Use Committee of East China Normal University (ethics approval numbers: m20220604 and m20241104). In this study, we used three-month-old female 5×FAD mice (B6.Cg-Tg [APPSwFlLon, PSEN1M146LL286V] 6799Vas/Mmjax) together with three-month-old female wild-type (WT) mice, both obtained from The Jackson Laboratory (MMRRC). All mice were housed under the same conditions: 23 °C temperature, 50% humidity, and a 12-hour light/dark cycle with ad libitum access to food and water. Three-month-old male and female littermates were used in the experiments. Animals were anesthetized with isoflurane and intracardiac perfusion with phosphate-buffered saline (PBS).
Morris water maze (MWM)The Morris Water Maze (MWM) test was used to assess spatial learning and memory. The MWM apparatus consisted of a cylindrical water tank (diameter: 1.5 m, height: 50 cm) filled with water at 23 °C to a depth of 30 cm. A white plastic platform (diameter: 10 cm) was submerged 6–8 mm below the water surface. The tank was surrounded by a black opaque screen with simple graphic markers placed in each cardinal direction to aid spatial orientation. A camera mounted above the tank transmitted real-time images to a computer for recording and analysis. White, opaque, non-toxic paint was added to the water to obscure visibility. The mice were trained for five consecutive days and tested on the sixth day. On the first day, a visible marker was placed on the platform to help the mice identify its location. The tank was divided into four quadrants, with the platform in the first quadrant. Each mouse was trained four times per day, with each trial starting in a different quadrant. On days 2–5, the marker was removed from the platform. Mice were released from a new quadrant each day and trained in four daily trials, each beginning in a different quadrant. The timer for each trial started when the mouse was released. If the mouse found the platform within 60 s and remained on the platform for at least 3 s, the timer stopped and the event was recorded. If the mouse did not locate the platform within 60 s, it was gently guided to the platform and allowed to remain there for 15 s. Training sessions were conducted at the same time each day, and mice were gently dried after each trial. The platform was removed on the sixth day, and the mice were released from the third quadrant. Each mouse was allowed to swim for 60 s, after which it was retrieved. During the training days (days 1–5), the daily average latency for each mouse to reach the platform was recorded. On the sixth day (probe trial), the average swimming speed, total swimming distance, and number of times each mouse crossed the former platform area were recorded.
Chemical and reagentsRNA was isolated using an Automatic nucleic acids instrument (Vazyme, VNP-32P) for RT-qPCR. Methods for extraction and purification of poly(A) RNA for RNA-seq or acRIP-seq are described in the following sections. Chloroform and other common laboratory chemicals were purchased from Merck (109634, Darmstadt, Germany). Hydroxylamine was purchased from Aladdin Bio-Chem Technology Co., Ltd. (H164487). Methylene blue used for nucleic acid visualization was purchased from Abcam (M9140). Nylon membranes were purchased from Beyotime (FFN10). The RNase inhibitor was purchased from New England Biolabs (M0314S, NEB, CA, USA).
Western blotting (WB)After euthanasia, hippocampal tissue from WT and 5×FAD mice were isolated and homogenized in RIPA buffer containing 50 mM Tris-HCl (pH 7.4), 150 mM NaCl, 2 mM EDTA, 1% sodium deoxycholate, 1% SDS, 1 mM PMSF, 50 mM sodium fluoride, 1 mM sodium vanadate, 1 mM DTT, and a protease inhibitor cocktail. SDS-PAGE resolved protein samples (20 µg)and then transferred to PVDF membranes (0.45 μm, PVH000210, Millipore). The membranes were blocked in TBS buffer (0.1% Tween-20 and 5% milk) for 1 h at room temperature and then incubated with primary antibodies overnight at 4 °C. After washing, the membranes were incubated with HRP-conjugated secondary antibody (goat anti-rabbit, G-21234, 1:2000, Thermo Fisher) in the same TBS buffer for 2 h at room temperature. Immunoreactive bands were visualized using the ChemiDoc™ XRS + Imaging System (Bio-Rad) with enhanced chemiluminescence (Pierce) and analyzed using ImageJ software (NIH). Primary antibodies used included anti-APP (1:2000, Merck Millipore, A8717), anti-GRIN1 (1:1000, HUABIO, ET1703-75), anti-MAP2 (1:1000, Merck Millipore, AB5622), anti-DNAJC6 (1:1000, HUABIO, HA722929), and anti-GAPDH (1:4000, HUABIO, ET1601-4).
Immunofluorescence (IF)Immunofluorescence analysis was conducted following established protocols as described in previous studies [53]. Mouse brains were fixed in 4% paraformaldehyde at 4 °C for 24 h, followed by dehydration in 20% sucrose solution in PBS at 4 °C overnight, followed by further dehydration in 30% sucrose solution in PBS. Brains were then embedded in OCT medium in an embedding mold and frozen at 0 °C. Embedded tissues were sectioned at 35 μm using a Leica CM3050S cryostat. Brain slices were permeabilized in PBS containing 0.3% Triton X-100 and 5% BSA and then incubated with primary antibody at 4 °C overnight. After three PBS washes, sections were incubated with secondary antibody for 2 h at room temperature. Antifade Mounting Medium with DAPI (Beyotime. P0131) was used to protect sections. The samples were then mounted with Vectashield mounting medium (Vector Laboratories), and images were captured using a Leica TCS SP8 confocal microscope. Primary antibodies used included anti-6E10 (1:500, BioLegend, #SIG-39320), anti-MAP2 (1:500, Merck Millipore, AB5622), anti-GRIN1 (1:200, HUABIO, ET1703-75), anti-neurogranin (1:500, R&D Systems, MAB7947) and anti-Parvalbumin (1:750, SIGMA, P3088). Secondary antibodies used included anti-p Fluor 488-conjugated (goat anti-mouse, A-11029, 1:500, Thermo Fisher) and anti-p Fluor 594-conjugated (goat anti-rabbit, A-11012, 1:500, Thermo Fisher).
Acetylated RNA Immunoprecipitation (acRIP)To quantify ac4C modification levels of specific genes, acetylated RNA immunoprecipitation (acRIP) was performed following a protocol similar to the m6A RNA immunoprecipitation (MeRIP) assay, with the anti-m6A antibody replaced by an anti-ac4C antibody according to the manufacturer’s instructions (Millipore, USA). Briefly, the anti-ac4C antibody (Abcam) was incubated with magnetic beads overnight to allow binding. The antibody-bead complex was then incubated with RNA samples. After RNA was eluted from the beads, RT-qPCR was performed to assess ac4C levels.
Quantitative reverse transcription polymerase chain reaction (RT-qPCR)cDNA was synthesized by reverse transcription using the HiScript III RT SuperMix for qPCR Kit (Vazyme, R323-01). Amplification was then performed using the ChamQ Universal SYBR qPCR Master Mix Kit (Vazyme, Q711-02). Gene expression levels were normalized to Gapdh as an internal control. The primer sequences used for qPCR in this study were as follows:
Grin1: forward 5’-ctgtctcctacacagctggc-3’; reverse 5’-ttctctgccttggactcacg-3’.
Map2: forward 5’-cgtaaatggggatttggtca-3’; reverse 5’-tcgactttccatcccacttc-3’.
Dnajc6: forward 5’-caggcaggctccaagtctac-3’; reverse 5’-cagtccaattcctggtcgct-3’.
Gapdh: forward 5’-gggtgtgaaccacgagaaat-3’; reverse 5’-actgtggtcatgagcccttc-3’.
ProteomicsSample preparation for proteomic analysisFor each group, hippocampal tissue was collected, washed in PBS, and subjected to global protein extraction using 8 M urea (pH 8.0) with phenylmethanesulfonyl fluoride (PMSF) as a protease inhibitor. The samples were ground using a cryogenic grinder and subjected to sonication for a period of three minutes, with a cycle time of three seconds on and three seconds off, at an amplitude of 25%. The protein concentration was determined using the Bradford assay, and 100 µg of protein was subjected to overnight digestion following the filter-assisted sample preparation (FASP) method with 3.5 µg of trypsin in 50 mM ammonium bicarbonate (pH 8.0) at 37 °C. The resulting peptides were purified by extraction with 50% acetonitrile (ACN) and 0.1% formic acid (FA), desalted using Empore 3 M C18 discs (2 mg, 3 μm, 150 Å, Agela) in pipette tips, and dried using a vacuum concentrator (Thermo Fisher Scientific, USA).
Liquid chromatography-tandem mass spectrometry (LC-MS/MS) analysis of the peptide mixtureProteomic analysis was performed on a nanoElute-HPLC system (Bruker Daltonics) coupled to a hybrid trapped ion mobility spectrometry quadrupole time-of-flight mass spectrometer (TIMS-TOF Pro, Bruker Daltonics, Billerica, MA) using a Captive Spray nano-electrospray ion source. The peptide mixture was reconstituted in solution A (0.1% FA) and loaded onto an analytical column (75 μm i.d. × 25 cm). Peptides were separated over a 60-minute gradient at a flow rate of 600 nL/min: 2–22% solvent B (ACN with 0.1% FA) for 45 min, 22–37% B for 5 min, 37–80% B for 5 min, followed by 80% B for 5 min. Mass spectrometry (MS) analysis was performed in positive electrospray ionization mode over a 100–1700 m/z mass range. Accumulation and ramp times were set to 100 ms each. Full scan MS spectra (m/z 100–1700) were acquired with ion mobility scanning from 0.7 to 1.3 Vs/cm². Each acquisition cycle (1.16 s) consisted of one TIMS MS full scan and 10 parallel accumulation serial fragmentation (PASEF) MS/MS scans. During PASEF, the collision energy was ramped from 59 eV at 1/K0 = 1.6 Vs/cm² to 20 eV at 1/K0 = 0.6 Vs/cm².
Proteome identification and quantification using PEAKS-based database searchingRaw MS files were analyzed using PEAKS Online Xpro software (v1.4) for peptide and protein identification by searching the Swiss-Prot database (downloaded on August 20, 2020, containing 20,375 protein entries) and quantification with a match between run (MBR) algorithm. Trypsin was selected as the proteolytic enzyme, allowing for up to three missed cleavage sites. The mass tolerance was set to 15 ppm for precursor ions and 0.05 Da for fragment ions. Oxidation of methionine and N-terminal acetylation were specified as variable modifications. False discovery rates (FDR) for peptide spectrum matches (PSMs) and proteins were kept below 1%. For proteome quantification, peptide feature area values were converted to a fraction of total (FOT) values, then multiplied by 10^6 for ease of presentation. For proteins detected in both of the 5×FAD and WT groups, differential expression analysis was performed using the limma package in R. A protein was considered differentially expressed if the adjusted p-value (adj. p-value) was less than 0.05 and the fold change was greater than or equal to 2. For proteins detected exclusively in either the 5×FAD or WT group, we assumed that these proteins were differentially expressed.
acRIP -seqA total of 10 to 50 micrograms of RNA was subjected to immunoprecipitation using the GenSeq acRIP Kit (GenSeq Inc.) in accordance with the manufacturer’s instructions. In summary, total RNA was randomly fragmented to a length of approximately 200 nt using RNA fragmentation reagents. The anti-ac4C antibody or control IgG (sc-2027, Santa Cruz) was conjugated to Protein A/G Dynabeads (Share-Bio, SB-PR001) in PBS and incubated for one hour at room temperature. Subsequently, the RNA fragments were incubated with the bead-conjugated antibodies, which were rotated at 4 °C for four hours. Subsequently, the RNA/antibody complexes were subjected to multiple rounds of washing to remove any unbound materials. The captured RNA was subsequently eluted from the complexes and purified to ensure its suitability for subsequent analysis. Ribosomal RNA (rRNA) depletion was performed on the RNA samples using the NEBNext rRNA Depletion Kit (New England Biolabs, Inc.). RNA libraries for immunoprecipitation (IP) and input samples were constructed using the NEBNext Ultra II Directional RNA Library Prep Kit (New England Biolabs, Inc.) in accordance with the standard protocol. The quality of the libraries was evaluated using the Agilent 2100 Bioanalyzer (Agilent), and sequencing was conducted on the NovaSeq platform (Illumina).
Quantification and statistical analysis of the ac4C epitranscriptomeIdentification of ac4C peaks and positional analysis of acetylated sitesAfter RNA integrity assessment, acRIP enrichment control and library quality control, raw reads were quality controlled using Q30 and FastQC. Adapter trimming of 3’ sequences and removal of low-quality reads were performed using Cutadapt software (v1.9.3) to generate clean reads. A post-alignment filter was applied to exclude alignments to mitochondrial DNA (chrM) and mismatched mating pairs. Clean reads were then aligned to the mouse genome (mm10) using Hisat2 software (v2.04).
To identify acetylated sites, we evaluated the enrichment of clean reads in acRIP, input and IgG control samples. MACS software (v1.4.2) was used to detect regions of significant read enrichment in the acRIP samples, with adjustments made to optimize the analysis of transcript-mapped reads (e.g., disabling the shift model and local lambda, and setting the sequencing read length to 150 bp). Input samples were used as controls during peak calling. The enriched regions were identified as acetylated sites and ac4C peaks were generated in bed or bam format for further analysis. These peaks were visualized on the UCSC Genome Browser (https://genome.ucsc.edu/cgi-bin/hgGateway) using IGV (http://www.igv.org/).
Strict filtering criteria were applied during ac4C peak calling to ensure data reliability. First, only peaks located on protein-coding exons were selected for further analysis. Additional filters including an adjusted p-value threshold of < 0.05 and a fold enrichment (FE) greater than 1, were used. Peaks with a false discovery rate (FDR)-adjusted p-value < 0.05 were considered statistically significant. A calibration step was performed for IgG control peaks to exclude non-specific IgG binding peaks, retaining only those with no coordinate overlap. Fold enrichment (FE) was calculated by dividing the difference between the acRIP and IgG peaks by the input peak. This procedure ensured that the acetylated regions identified reflected significant and specific ac4C modification levels.
Analysis of ac4C fold enrichment (FE) for individual mRNAsUpon analyzing the fold enrichment (FE) value of each ac4C peak and its corresponding gene, it was observed that multiple ac4C peaks could occur on the same mRNA, rather than a simple one-to-one correspondence between a peak and an mRNA. Consequently, for mRNAs with multiple ac4C-modified regions, the FE of the mRNA was defined as the aggregate of the FE values of the aforementioned peaks. In the case of mRNAs with a single ac4C peak, the FE value of the peak was employed directly in defining the mRNA’s FE value. The following quantification index was used to calculate the ac4C levels in individual mRNAs:
$$\:FE\:\:of\:\:ac4C\:mRNA=\sum\:\:ac4C\:peak(1+2+3\cdots\:+n)$$
The e ac4C fold change (FC) in individual mRNAs was analyzedThe FC of ac4C-mRNA reflects the degree of change in the overall acetylation level of mRNA in the WT group compared to the 5×FAD group. To circumvent the potential issue of a zero denominator in the FC calculation, we incorporated a value 1 into the fold enrichment (FE) of ac4C. For ac4C-modified mRNA detected in both the 5×FAD and WT groups, differential expression analysis was performed using the limma package in R. An ac4C-modified mRNA was considered differentially expressed if the adjusted p-value (adj.p.val) was less than 0.05 and the fold change was greater than or equal to 2. For ac4C-modified mRNA detected exclusively in either the 5×FAD or WT group was considered differentially expressed if the fold change was greater than or equal to 2, regardless of statistical significance. The FC of ac4C-mRNA was calculated using the following quantification index:
$$\:FC\:\:of\:\:ac4C\:mRNA=\frac$$
RNA-seqIn summary, total RNA was initially subjected to ribosomal RNA (rRNA) depletion through the use of the GenSeq® rRNA Removal Kit (GenSeq, Inc.), per the manufacturer’s instructions. Subsequently, the rRNA-depleted samples were processed for library construction using the GenSeq® Low Input RNA Library Prep Kit (GenSeq, Inc.). The quality and quantity of the library were evaluated using the Agilent Bioanalyzer 2100 system (Agilent Technologies, Inc., USA). The sequencing was conducted on an Illumina NovaSeq platform, generating of 150 bp paired-end reads.
The quality of the sequencing data was evaluated using Q30 metrics. Low-quality reads and 3’ adapter sequences were removed using the Cutadapt software (version 1.9.3). The remaining high-quality reads were then aligned to the reference genome using the HISAT2 software (v2.0.4). The raw counts were generated using HTSeq software (version 0.9.1). Transcripts per kilobase million (TPM) were calculated to assess similarities and differences between samples. The identification of differentially expressed genes (DEGs) was conducted using the edgeR (v3.16.5) software, which involved normalizing raw counts and calculating fold change between the two sample groups. A gene was considered to be differentially expressed if the p-value was less than 0.05 and the fold change was greater than or equal to 2.
Principal component analysis (PCA)The dimensionality of the omics data was reduced using principal component analysis (PCA) to facilitate the assessment of similarities and differences between samples [54, 55]. For instance, in the context of proteomics data, proteins exhibiting a variance of 1 or less across samples were excluded, as they were deemed inconsequential for PCA analysis. Each protein’s median absolute deviation (MAD) was calculated and subsequently ranked in descending order. Only the top 50% of proteins, based on their MAD values, were selected for PCA to minimize the influence of background noise.
Gene ontology and functional category analysisGene Ontology (GO) analysis was performed to identify enriched GO terms among differentially acetylated genes and differentially expressed proteins using the clusterProfiler package in R. The functional roles of these genes were categorized into three major GO domains: Molecular Function (MF), Biological Process (BP), and Cellular Component (CC). GO terms with a false discovery rate (FDR)-adjusted p-value of < 0.05 were considered statistically significant and visualized using custom R scripts. In addition, the clusterProfiler package was used to annotate genes involved in the Kyoto Encyclopedia of Genes and Genomes (KEGG) pathways. A p-value threshold of < 0.05 was used to determine significant pathway enrichment, with results visualized accordingly.
Protein-protein interaction (PPI) network analysisGenes consistently downregulated in proteomic and acRIP-seq analyses of 5×FAD mice, relative to WT controls, were selected for further Gene Ontology (GO) analysis. The top five enriched Biological Processes (BP) were then intersected with genes identified as downregulated in human hippocampal proteomics [33] to enhance translational relevance.
To investigate the functional and physical interactions among these genes, a protein-protein interaction (PPI) network was constructed using the STRING database (version 12.0, https://string-db.org/), applying a minimum confidence score of 0.4 to ensure reliable interactions [56]. The PPI network was visualized in Cytoscape (version 3.10.1), and network clusters were further analyzed using the Molecular Complex Detection (MCODE) algorithm (v2.0.3) to identify densely connected components, highlighting potential core modules within the network.
Statistical analysisCumulative distribution was analyzed using the Kolmogorov-Smirnov test in R, while the percentage of ac4C summits within mRNA regions was assessed by chi-square test in R. The CIBERSORT algorithm in R was utilized to identify the enriched cell types associated with the decreased expression of key protein-related genes in the hippocampus of 5×FAD mice. Unless otherwise specified, all other data are presented as mean ± SEM. Sample sizes were determined based on prior studies and met statistical power requirements. Statistical analysis was conducted using an unpaired, two-tailed Student’s t-test for data with a single experimental variable and normal distribution. Two-way ANOVA was applied for datasets with multiple experimental variables, followed by post hoc multiple comparison tests (Tukey, Dunnett, or Sidak) as appropriate. Correlations between bivariate variables were evaluated using the Phi correlation coefficient, with|phi| < 0.3 considered indicative of low relevance. All statistical analyses were performed using GraphPad Prism (version 9.5). Statistical significance is denoted as follows: ****P < 0.0001, ***P < 0.001, **P < 0.01, and *P < 0.05.
The following software and algorithms were utilized for the quantification and statistical analysis of proteomics and ac4C epitranscriptomic data.
Software and algorithms, application, authors
R v4.4.0
Statistical computing and graphics
R Core Team, R: A Language and Environment for Statistical Computing, 2024.
ggplot2
Creating graphics, based on The Grammar of Graphics.
Hadley W et al., Springer Verlag New York 2016.
limma
Differential expression analysis of Protein or ac4C mRNA.
Matthew E Ritchie et al., Nucleic Acids Res, 2015.
ComplexHeat map
Arrange multiple heatmaps and support annotation graphics.
Gu Z et al. Bioinformatics 2016.
corrplot
Visualization of a Correlation
Matrix
Taiyun Wei and Viliam Simko, 2024.
enrichplot
Visualization of Functional Enrichment Result
Yu G. 2024
circlize
Visualize the location of the target gene in the genome
Gu, Z. 2014
bedtools
Compare large sets of genomic features.
Aaron Q et al. Bioinformatics 2010.
PEAKS Online Xpro Software (v1.4)
peptide and protein identification.
Bioinformatics Solutions Inc., Waterloo, Ontario, Canada
cutadapt v1.9.3
Remove sequencing data adaptor.
Martin M. EMBnet, 2011.
Hisat2 v2.04
Mapping sequencing reads to a single reference genome.
Zhang Y et al. Genome Research 2021.
MACS v1.4.2
Identifying transcript factor binding sites.
Yong Z et al. Genome Biology 2008.
Pandas v2.1.4
Cleaning data.
The pandas development team. Zenodo 2020.
HTSeq (v0.9.1)
Analyzing high-throughput sequencing data.
Simon A et al. Bioinformatics 2014.
edgeR (v3.16.5)
Empirical analysis of digital gene expression data.
McCarthy DJ et al. Nucleic Acids Research 2012.
CIBERSORT
Cell-type identification by estimating relative subsets of RNA transcripts.
Aaron M et al. Nature methods 2015.
Comments (0)