
Remember me


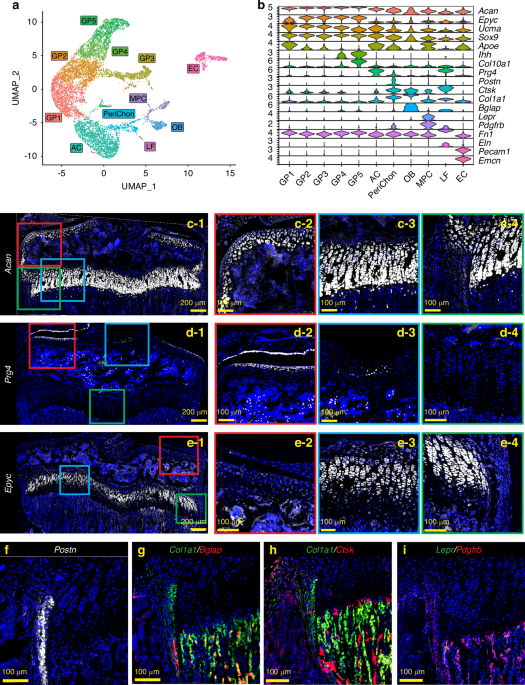
To perform scRNAseq of growth plate chondrocytes, we harvested femora and tibiae from a female C57BL/6J mouse at 4 weeks of age during the growth spurt and removed as much soft tissue as possible under a stereomicroscope. The distal femoral epiphysis and proximal tibial epiphysis were then dislodged from the metaphysis (Fig. S1a). The dislodged epiphysis with the attached growth plate was then digested to isolate growth plate chondrocytes. Hematopoietic cells and red blood cells were removed by magnetic beads for CD45 and Ter119 antibodies, and the resulting single-cell suspension was subjected to scRNAseq on the 10x Genomics platform. Unsupervised data analysis using the Seurat package provided a uniform manifold approximation and projection (UMAP) with 11 distinct cell clusters based on their gene expression profiles (Fig. 1a). Based on the characteristics of the transcriptomes, these 11 clusters appeared to contain not only chondrocytes, but also other cell types such as osteoblasts, endothelial cells, ligamentous fibroblasts, and mesenchymal progenitor cells (Fig. 1b). To annotate the clusters with the goal of distinguishing growth plate chondrocytes from other cell types, we examined gene expression of marker genes that have been reported to be expressed in a specific cell type, followed by histologic validation by FISH on histological sections of 4-week old mice. Aggrecan (Acan) is a pan marker for chondrogenic cells, including articular chondrocytes (Fig. 1c-1, c-2), growth plate chondrocytes (Fig. 1c-1, c-3), and, at a lower expression level, perichondrial cells (Fig. 1c-1, c-4). To distinguish articular chondrocytes from growth plate chondrocytes, we used Prg4 (proteoglycan 4 or lubricin).17,18,19 and Epyc (epiphycan).20,21Prg4 is highly expressed in articular chondrocytes and meniscal cells (Fig. 1d-1, d-2) as well as in ligament cells (Fig. 1d-3), but its expression in growth plate chondrocytes and perichondrial cells is minimal (Figs. 1d-4), consistent with a previous report.22 In contrast, Epyc is robustly expressed in growth plate chondrocytes with the highest expression in the columnar chondrocytes (Fig. 1e-1, e-3), but its expression level is much lower in articular chondrocytes (Fig. 1e-2) and perichondrial cells (Fig. 1e-4). Perichondrial cells specifically express Postn (periostin) (Fig. 1f). They also express relatively low levels of Acan, but higher levels of Col1a1 compared to chondrocytes (Fig.1g). Notably, they can be distinguished from Col1a1-expressing osteoblasts, which are mainly located in the trabecular and endosteal areas, because they do not express Bglap, a marker for mature osteoblasts.23 Consistent with previous reports, a fraction of perichondrial/periosteal cells in the outer layer express Ctsk,24,25,26 although to a lesser extent compared to osteoclasts in the trabecular area (Fig. 1h). We also identified a cluster of cells expressing Lepr and Pdgfrb, two markers of bone marrow mesenchymal progenitor cells (MPCs).27,28,29 FISH confirmed that Lepr+Pdgfrb+ MPCs were mainly located in the trabecular region and not in the growth plate (Fig. 1i). In addition, we observed that these two markers, especially Pdgfrb, are robustly expressed in the perichondrium and periosteum (Fig. 1i), which is consistent with previous observations.28,29 With this scRNAseq analysis and FISH validation approach, we were able to annotate the 11 clusters with 5 clusters of growth plate chondrocytes (GP1-5, AcanhighEpyc+Prg4-), articular chondrocytes (AC, AcanhighPrg4+), perichondrial cells (PeriChon, Postn+AcanlowCol1a1+Bglap-Ctsk+Pdgfrb+), ligamentous fibroblasts (LF, Eln+Fn1+Prg4+), osteoblasts (OB, Col1a1+Bglap+), mesenchymal progenitor cells (MPCs, Pdgfrb+Lepr+), and endothelial cells (EC, Pecam1+Emcn+) (Fig.1b).
Fig. 1
scRNAseq analysis and FISH validation of the single cells isolated from hindlimb growth plates. a UMAP analysis of single cells obtained from the digested hindlimb epiphyseal growth plates of a 4-week-old female C57BL/6 J mouse based on the transcriptomic profiles of each cell. b Violin plots of the gene panel selected for cluster annotation and histological validation. c–i FISH validations for representative genes for cluster annotation. c-2-4, d-2-4 and e-2-4 are magnified images of the corresponding colored boxes indicated in c-1, d-1, and e-1. At least 3 mice were used for each gene and the representative images were shown
Apoe is ubiquitously and specifically expressed in growth plate RCsTo further analyze growth plate chondrocytes, clusters containing growth plate chondrocytes in Fig. 1a (GP1-5) were selected and re-clustered. The transcriptomic profiles of chondrocytes in different zones within the growth plate were analyzed and the clusters were annotated in a similar approach as in Fig. 1 (Fig. 2a, b). FISH confirmed the spatial gene expression of genes representing chondrocytes in each zone. For each gene, we compared the localization in tissue sections with our scRNAseq UMAP side-by-side to validate our annotation (Fig. 2c). Clu (Clusterin).30 and Pthlh (PTHrP),11 two previously reported markers for RCs, were specifically expressed in subsets of RCs in the upper layer of the growth plate (Fig. 2c, RC. Enlarged images for Pthlh are shown in Fig. S2a). Ccnd1 (Cyclin D1), which modulates the transition from G1 to S phase,31 was mainly expressed at the boundary between unorganized RCs and column-forming proliferating chondrocytes (Fig. 2c, Mito-C, top), suggesting that Ccnd1 labels chondrocytes entering the cell cycle from the quiescent state. On the other hand, the mitotic gene Mki67, which is maximally expressed in the G2 and M phases,32 was specifically expressed in a cluster in the UMAP, but these Mki67-expressing chondrocytes were sparsely distributed in the proliferative zone (Fig. 2c, Mito-C, bottom). C1qtnf3 (CTRP3) was previously identified to be expressed in proliferating chondrocytes in the growth plate.33 Consistently, we confirmed that C1qtnf3 was specifically expressed in the columnar chondrocytes such as proliferative and prehypertrophic chondrocytes (Fig. 2c, PC, top). In addition, glucose metabolism is an essential metabolic pathway in growth plate chondrocytes.34,35,36Pgk1, encoding phosphoglycerate kinase 1, an essential glycolytic enzyme, was found to be highly expressed in the columnar chondrocytes compared to the RCs (Fig. 2c, PC, bottom). Finally, Ihh (Indian hedgehog) and Col10a1 (Type X collagen) are robustly expressed in the prehypertrophic and hypertrophic chondrocytes, respectively (Fig. 2c, PHC/HC). Therefore, we annotated the clusters as shown in Fig. 2a. Pseudotime analysis of these five clusters also showed that the pseudotime score increased as chondrocytes shifted from RC to HC in the UMAP, which also supports our cluster annotation (Fig. 2d). After identifying the cluster for RCs, we searched for marker genes that were ubiquitously expressed in RCs (minimum percentage of expressing cells in the cluster > 90%) and specifically expressed in RCs (the minimum fold change compared to the other four clusters; logFC > 1). Among the 41 differentially expressed genes meeting these criteria, apolipoprotein E (Apoe) had the highest fold change (logFC = 3.87) and was expressed in the majority of cells in the RC cluster (>97%) (Fig. 2e). FISH confirmed that Apoe, C1qtnf3, and Col10a1 could distinguish the RZ, PZ/PHZ, and HZ, respectively (Figs. 2f, S2b). Immunofluorescence staining with the APOE antibody revealed that APOE was highly expressed in chondrocytes in the RZ compared to the PZ of the human growth plate, suggesting that apolipoprotein E may be commonly expressed in RCs across species (Fig. 2g).
Fig. 2
Characterization of RCs by scRNAseq and FISH to identify markers for RCs. a Reclustering and UMAP visualization of the GP chondrocytes selected in Fig.1a. b Gene panel used for cluster annotation of GP chondrocytes and FISH validation. c FISH images and the corresponding feature plots of genes representing chondrocytes in different zones. d Pseudotime analysis of the GP chondrocytes. Higher pseudotime scores indicate more mature/differentiated chondrocytes. e Heatmap of the detected genes that are ubiquitously and specifically expressed in the RC cluster. f FISH for Apoe, C1qtnf3, and Col10a1 on a coronal section of a 4-week-old male mouse tibia. Feature plot of the three genes is shown in corresponding colors next to the FISH image. g Hematoxylin & Eosin (H&E) staining and immunofluorescence staining of human APOE on sections of the human radial growth plate. At least 3 mice were used for each gene and the representative images were shown
ApoemCherry labels RCs after the formation of the secondary ossification centerTo further characterize the Apoe-expressing RCs, we generated ApoemCherry reporter mice that express mCherry protein under the control of the endogenous Apoe gene promoter and enhancers (the mCherry-BGHpA cassette was inserted after the endogenous ATG start codon in exon 2 of the mouse Apoe gene) (Fig. 3a). This reporter model allows us to visualize the real-time Apoe expression in cells with mCherry to characterize Apoe+ growth plate chondrocytes in vivo and in vitro. Since this is a knock-in mouse model and there is only one allele of Apoe in the ApoemCherry/+ mice, we first examined whether there is a haploinsufficiency for APOE that causes systemic or skeletal phenotypes. As shown in Fig. 3b, we did not find significant differences in body weight and femur length between Apoe+/+ and ApoemCherry/+ mice. Apoe global knockout mice (Apoe-/- mice) exhibit prominent hyperlipidemia,37 but we did not observe significant upregulation of triglyceride and cholesterol levels in 4-week-old ApoemCherry/+ mice. Plasma APOE levels were decreased but did not reach a statistical significance. Lastly, we examined the growth plate histologically by FISH and found no significant alteration in the proportions of each zone (RZ, PZ, and HZ) in the ApoemCherry/+ mice, although the length of Apoe+ RCs tended to decrease (Fig. 3c), possibly due to decreased Apoe expression. Collectively, these data indicate that the loss of one allele of Apoe in the ApoemCherry/+ mice did not result in abnormal systemic or skeletal phenotypes.
Fig. 3
Systemic and skeletal phenotypes of newly generated ApoemCherry/+ mice. a Gene editing strategy to generate ApoemCherry knock-in mice. b Body weights (Apoe+/+ males = 19, Apoe+/+ females = 11, ApoemCherry/+ males = 12, ApoemCherry/+ females = 13), femur lengths measured by micro-CT scanning (Apoe+/+ males = 11, Apoe+/+ females = 9, ApoemCherry/+ males = 12, ApoemCherry/+ females = 11), plasma APOE levels measured by ELISA (n = 5 for each group), and blood lipid levels measured by colorimetric assays (n = 5 for each group except the total cholesterol level in the ApoemCherry/+ group which is n = 4). Samples were from independent animals. Data were presented as mean ± SD. Two-way ANOVA followed by Tukey’s multiple comparison test. c Tibial sections from 4-week-old male Apoe+/+ and ApoemCherry/+ mice (n = 3 independent animals) were stained by FISH for Apoe, C1qtnf3, and Col10a1 to label the RZ, PZ, and HZ, respectively. Percentage of each zone within the entire growth plate was quantified and compared by Two-way ANOVA followed by Tukey’s multiple comparisons test. Data are presented as mean ± SD. ns: P > 0.05
Next, colocalization of mCherry protein and Apoe mRNA was confirmed by a combination of immunofluorescence and FISH (Fig. S3), indicating that mCherry expression is concomitant with endogenous Apoe expression. During postnatal skeletal development, mCherry expression was not detected in tibial epiphyseal cartilage at postnatal day 5 (P5), before SOC formation (Fig. 4a). At this stage, mCherry expression was primarily observed in the bone marrow, perichondrium, and part of the ligamentous cells. mCherry-expressing chondrocytes began to appear in the tibial RZ after SOC formation at P11 (Fig. 4b). At 4 weeks of age (P28), mCherry+ chondrocytes lined up in the RZ, but were not detected in other zones, while some expression was observed in the outer layer of the perichondrium and a few articular chondrocytes (Fig. 4c. the green, yellow, and blue boxes indicate the growth plate, the articular chondrocytes, and the perichondrium, respectively). These findings are consistent with our scRNAseq data of growth plate cells (Fig. 1a, b) and bone marrow cells (Fig. S4) showing that Apoe is highly expressed in endothelial cells, macrophages, and MPC, and at lower levels in perichondrial and articular chondrocytes. In later stages of life, the percentage of mCherry+ RCs in the growth plate peaks at 9 weeks of age and then decreases over time (Fig. 4d–h), suggesting that RCs in the growth plate are exhausted after skeletal maturity with aging, although a few mCherry+ RCs remain in the growth plate at 1 year of age.
Fig. 4
Histological analysis of ApoemCherry/+ mice. a–c Sagittal sections of the left knees from ApoemCherry/+ mice at postnatal day 5 (P5), day 11 (P11), and day 28 (P28, 4-week-old). d–g Fluorescence images of coronal sections of left tibiae from ApoemCherry/+ mice at different ages as indicated. h Percentages of mCherry+ cells within the growth plate cells (red line) and the total number of growth plate chondrocytes (black line). 3-4 male ApoemCherry/+ mice were used at each time point for quantification. Data are presented as mean ± SD. One-way ANOVA followed by Tukey’s multiple comparison test. *: P < 0.05 compared to the 1-year-old group (percentage of mCherry+ cell). #: P < 0.000 1 compared to the 4-week-old group (total GP cell)
mCherry+ RCs are slow-cycling chondrocytesIn contrast to proliferating columnar chondrocytes, “resting” chondrocytes are quiescent with a longer cell cycle.38 To determine whether mCherry+ chondrocytes are slow-cycling, we performed an EdU pulse-chase assay. Specifically, we injected EdU into 2-week-old ApoemCherry/+ mice for 8 consecutive days and tracked EdU incorporation into growth plate chondrocytes at 1 day, 4 days and 14 days after the last injection (Fig. 5a). At this growing age, chondrocytes can pass through the growth plate within a few days.16 Thus, fast-cycling cells lose the EdU label in a few days after multiple cell divisions, while slow-cycling cells can retain it. One day after the 8-day injections, approximately 60% of proliferative chondrocytes (mCherry-) incorporated EdU, while only 30% of mCherry+ RCs had EdU, suggesting that fewer mCherry+ RCs entered the cell cycle during the 8 days compared to proliferative chondrocytes. Furthermore, as expected, proliferating columnar cells rapidly lost their EdU labeling down to ~30% by day 4 and ~6% by day 14 (Figs. 5b, c, S5a). In contrast, mCherry+ cells took much longer to lose their EdU labeling (~30% at day 1, ~15% at day 4, and ~22% at day 14) (Figs. 5b, c, S5a), indicating that mCherry+ RCs are slow-cycling compared to proliferative chondrocytes. Notably, we often found mCherry+EdU+ cells located in the lower RZ (white arrows in Fig. 5c, +1 d). Given the relatively high EdU incorporation rate (~30%) in the mCherry+ RCs, we reasoned that the mCherry+ RCs consisted of heterogeneous cell populations including the dormant stem cells in the upper RZ and activated progenitors, transitioning into proliferative chondrocytes in the lower RZ. Consistently, FISH analysis for Apoe, Clu, and C1qtnf3, revealed more than 30% overlap between Apoe+ RCs and C1qtnf3+ PCs at the boundary. On the other hand, Clu labeled the upper Apoe+ RCs and had little overlap with the C1qtnf3+ PCs (Fig. S5b), which was also confirmed by the feature plots for Apoe, Clu, and C1qtnf3 in our scRNAseq data (Fig. S5c). Moreover, RCs in the lower RZ express Ccnd1 as shown in Figs. 2b, c, and S5c, d, suggesting that these RCs are entering the cell cycle. The reduction in EdU positivity in the RCs from day 1 to day 4 might have derived from the transition of EdU+ RCs into the proliferative zone. The slight increase in EdU-positive cells in RCs from day 4 to day 14 may be due to cell division of the slow-cycling RCs in the upper RZ within the two-week window, as we observed some EdU-positive nuclei aligned close to each other, suggesting that they had just divided from a single nucleus (Fig.5c, +14 d, white arrowheads). These results suggest that our ApoemCherry reporter mice temporally and spatially label the RZ, which potentially consists of heterogeneous RCs.
Fig. 5
EdU pulse & chase assay in ApoemCherry/+ mice. a Experimental scheme of the EdU injections and sampling. The 8-day EdU injection started at 2 weeks of age and tibiae were harvested 1, 4 and 14 days after the last injection. b Percentage of EdU+ cells in mCherry+ RCs (red) and mCherry- chondrocytes (black) at the indicated time points. Data are from male mice and presented as mean ± SD. n = 3 independent animals for +1 d and +4 d and n = 4 for +14 d. *: P = 0.004, ***: P = 0.000 3, ****: P < 0.000 1. Two-way ANOVA (factor mCherry: P = 0.001 6; factor time: P < 0.000 1) followed by Tukey’s multiple comparison test. c Representative images of EdU detection (green) and mCherry immunofluorescence (red) with DAPI (blue). White arrows at +1 d indicate EdU+mCherry+ cells in the lower part of the RZ. White arrowheads at +14 d indicate two adjacent EdU+ nuclei, presumably divided from a single labeled nucleus
mCherry+ RCs are heterogenous and contain skeletal progenitor cells with high proliferative potential and multipotency in vitroAfter SOC formation, the RZ in the growth plate has been shown to harbor skeletal stem cells that express Pthlh,11Axin2,12,13 or Foxa2.14 These skeletal stem cells supply chondrocytes that form columns in the growth plate during linear bone growth. Our histological evaluation by FISH found that 94% of the Pthlh-expressing stem cells expressed mCherry, but only 27% of the mCherry-expressing cells were Pthlh positive (Fig. 6a). On the other hand, the percentage of Axin2-expressing cells and Foxa2-expressing cells within mCherry+ cells were 4% and 12%, respectively (Fig. 6a), which was much lower than Pthlh+ cells. To gain a holistic understanding of these stem cell populations, we examined the positivity of Apoe, Pthlh, Axin2, and Foxa2 gene expression in the RC cluster of our scRNAseq dataset shown in Fig. 2a. We considered positive cells when the raw count for each gene was greater than 0. Figure 6b shows that most RCs (97%) are Apoe+ (1 324 cells out of 1 359 cells), while Pthlh+, Axin2+ and Foxa2+ cells represent small subsets of RCs, 17% (237 cells out of 1 359 cells), 2% (32 cells out of 1 359 cells), and 4% (57 cells out of 1 359 cells), respectively. These percentages were slightly lower than what we observed in histology (Fig. 6a), possibly due to the different detection sensitivities between RNA sequencing and FISH. However, the proportion of these percentages among Pthlh+, Axin2+ and Foxa2+ cells is similar between scRNAseq analysis and FISH (17%, 2%, 4% in scRNAseq data, 27%, 4% and 12% in FISH, respectively). Based on our scRNAseq data, 77% of Apoe-expressing RCs (1 023 cells out of 1 324 cells) are negative for Pthlh, Axin2, and Foxa2. Interestingly, among the Apoe-expressing RCs that are positive for either Pthlh, Axin2, or Foxa2, over 95% of these cells (286 cells out of 301 cells) express only one of Pthlh, Axin2, or Foxa2, and there were no triple positive (Pthlh+Axin2+Foxa2+) cells in the RCs (Fig. 6c), suggesting that these genes label independent subsets of RCs and that skeletal stem cells in RCs are heterogeneous. Importantly, Apoe positivity in these subsets of Pthlh+, Axin2+ and Foxa2+ RCs is 98% (233 cells out of 237 cells), 100% (32 cells out of 32 cells), and 89% (51 cells out of 57 cells), respectively. These results suggest that Apoe is a common marker that spans the RCs, whereas Pthlh, Axin2 and Foxa2 exclusively label heterogeneous subsets of skeletal stem cells.
Fig. 6
Heterogeneity of the mCherry+ RCs. a RNAscope of Pthlh, Axin2, and Foxa2 on tibial sections from male ApoemCherry/+ mice. The percentage of positive cells for each marker within mCherry+ RCs was quantified. Data are presented as mean ± SD. n = 3 independent animals. One-way ANOVA followed by Tukey’s multiple comparison test. b Colocalization analysis of Apoe+, Pthlh+, Axin2+ and Foxa2+ cells in the RC cluster of the scRNAseq data shown in Fig. 2a. c Colocalization analysis of Pthlh+, Axin2+ and Foxa2+ cells in the Apoe+ RCs of the scRNAseq data shown in Fig. 2a
Previous studies have identified a panel of mouse skeletal stem cell surface markers for flow cytometric analysis.39 We therefore examined the expression of these surface markers on mCherry+ RCs. Following our gating scheme to enrich for singlet cells, we removed dead cells and hematopoietic/endothelial cells labeled with CD45, Tie2, and Ter119. In the mCherry+ cells of the remaining population, we found that approximately half of the mCherry+ RCs had signatures of multipotent cells,39 of which ~18% had signatures of self-renewing mouse skeletal stem cells (SSC, CD45-Tie2-CD51+Thy-6C3-CD105-CD200+), ~ 29.3% had signatures of pre-bone, cartilage and stromal progenitors (pre-BCSP, CD45-Tie2−CD51+Thy-6C3-CD105-CD200-), and ~2.8% had signatures of bone, cartilage and stromal progenitors (BCSP, CD45−Tie2−CD51+Thy−6C3−CD105+) (Fig. 7a). These results demonstrated that mCherry+ RCs may contain skeletal stem cells as well as skeletal progenitor cells, further indicating the heterogeneity of RCs.
Fig. 7
Characterization of mCherry+ RCs for stem cell properties. a Gating scheme for flow cytometric analysis of GP cells isolated from 4-week-old male ApoemCherry/+ mice (n = 3 independent animals). Percentage is within DAPI-Lin-mCherry+ cells. Lin: hematopoietic and endothelial lineage cells (CD45+Tie2+Ter119+). b Lin-CD73+mCherry+ cells were sorted and subjected to in vitro osteogenic/chondrogenic/adipogenic differentiation assays. The upper panels are controls cultured in non-differentiating media. Representative figures from 3 independent experiments are shown. c Colony forming unit (CFU) assay comparing the self-renewal capabilities between Lin-CD73+mCherry- and Lin-CD73+mCherry+ cells. Data are presented as mean ± SD. n = 3 replicates of pooled cells from 2 independent mice. Student’s t-test
To functionally validate that mCherry+ cells have proliferative potential and multipotency as progenitor cells, we sorted mCherry+ cells for in vitro differentiation experiments. In addition to RCs, mCherry+ cells were also detected in the bone marrow (Fig. 4). Our scRNAseq analysis of bone marrow cells showed that Apoe was also expressed in endothelial cells, macrophages, and part of skeletal cells (Fig. S4). Therefore, to remove mCherry+ cells from the bone marrow and enrich mCherry+ RCs, in addition to CD31 and CD45, markers for endothelial cells and hematopoietic cells including macrophages, we utilized CD73, which has been reported as an RC marker.9 Previous studies have also shown that CD73 labels bone marrow cell fractions with high differentiation and proliferative potential, as well as the sinusoidal cells.40,41 To confirm that our sorting strategy can enrich mCherry+ cells from the growth plate but not from the bone marrow, we separately harvested cells from the growth plate and bone marrow of ApoemCherry/+ mice and examined the positivity for CD73 and mCherry. The majority of mCherry+ cells isolated from the growth plate were positive for CD73 (> 90%), whereas only 1% of CD73+ non-hematopoietic cells from the bone marrow were mCherry+ (Fig. S6). Therefore, we sorted mCherry+ RCs as CD31-CD45-Ter119-CD73+mCherry+ cells and cultured them under osteogenic, chondrogenic, and adipogenic differentiation conditions (Fig. 7b). Although the contamination of bone marrow mCherry+CD73+ cells cannot be completely excluded, these cells should be quite minor compared to mCherry+CD73+ RCs because our chondrocyte isolation method contains a very small MPC population as shown in Fig. 1a. Therefore, this rare population is unlikely to affect our downstream in vitro analyses. The sorted mCherry+ RCs were able to differentiate into osteoblasts and chondrocytes as demonstrated by alizarin red and alcian blue staining (Fig. 7b). However, these mCherry+ RCs exhibited limited adipogenic differentiation potential (Fig. 7b), which is consistent with previous findings regarding the non-adipogenic skeletal stem cells.39 Lastly, we performed a colony-forming assay to determine whether mCherry+ RCs have higher proliferative potential than mCherry- cells. When seeded at a low cell density (100 cells/cm2), mCherry+ RCs formed a significantly higher number of colonies with cell numbers > 50 compared to mCherry- cells in vitro (Fig. 7c). These findings suggest that mCherry+ RCs contain skeletal progenitor cells that have high proliferative potential and multipotency toward osteo- and chondrogenesis in vitro.
Comments (0)