Mice
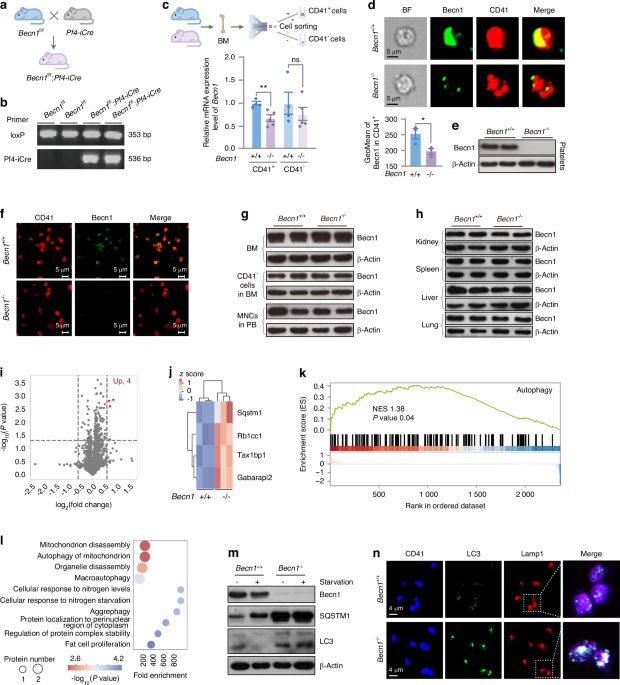
MK and platelet-derived Becn1-deficient mice (Becn1f/f;Pf4-iCre) were generated by crossing Pf4-iCre mice (Jackson Laboratory) with Becn1-flox mice.31 Genotyping was performed by PCR analysis of tail DNA samples with specific primers amplifying the LoxP sites (F1-CGTTGGCTACCCGTGATATT, F2-TTTGTTTTGTGGGGAATTCATTGT, R-TGAGTAGTTATCTGGGCTGGGAGA). The presence of the iCre sequence was confirmed using the primers F-AAGCACATCACCAGCCTGGAG and R- GTTGTTCAGCTTGCACCAGG. The mice were bred and housed in specific-pathogen-free animal facilities at Soochow University. All animal experiments were approved by the institutional animal care and use committee of Soochow University.
Reagents
The reagents used in this study are described in Table S1.
Platelet preparation
The collected whole blood, with anticoagulant plus 1 μmol/L PGE-1 (Enzo Life Sciences, USA), was centrifuged at 800 r/min for 10 min at room temperature (RT) with no brake applied to prevent platelet activation. The supernatant was then gently transferred to a fresh tube using a polypropylene Pasteur pipette and centrifuged at 800 r/min for 10 min to obtain PRP. Washed PRP platelets were collected by centrifugation at 1 300 r/min for 15 min at RT and resuspended in modified Tyrode’s buffer (pH 7.4) containing 137 mmol/L NaCl, 20 mmol/L HEPES, 1 mmol/L MgCl2 ∙ 6H2O, 2.7 mmol/L KCl, 3.3 mmol/L Na2HPO4 ∙ 2H2O, 5.6 mmol/L D-glucose, and 1 g/L BSA.
Flow cytometry
Washed platelets (3 × 10⁸/mL) from the mice were pretreated with ABT737 (5 μmol/L) or vehicle control for 2 h at 37 °C, and then, FITC-Annexin V and binding solution were added to the pretreated platelets at a ratio of 1:100 or 1:10 by volume. The platelet mixtures were mixed evenly and gently, incubated for 20 min at RT in the dark, and then subjected to flow cytometry analysis as described previously. BM cells were collected from femurs and tibiae. Flow cytometry-based cell sorting and analysis were performed using FACSAriaTM III (BD, USA) and Beckman Coulter Gallios (Beckman, USA).
RNA extraction and RT‒qPCR
Total RNA was extracted from MKs using the MicroElute Total RNA Kit (Omega Biotek, USA) according to the manufacturer’s instructions. Reverse transcription (RT) was performed with total RNA using HiScript III RT SuperMix for RT-PCR (Vazyme, China). PCR was carried out using cDNA obtained from RT and 2x SYBR Green qPCR Master Mix (Vazyme, China) according to the manufacturer’s instructions.
Western blotting
BM cells, platelets, and other organs were lysed in 1X cell lysis buffer (CST, USA) supplemented with protease and phosphatase inhibitors (Roche, Switzerland). Proteins were resolved by 12% SDS‒PAGE and transferred to PVDF membranes. The membranes were blocked with 5% skim milk-TBS-0.1% Tween 20 for 1 h at RT. Antibodies against Becn1, Bax (CST, USA), microtubule-associated protein 1A/1B-light chain 3 (Novus Biologicals, USA), Bcl-XL (CST, USA), P62 (MBL, USA), Caspase 3 (CST, USA), SHBG (HuaBio,China) and β-Actin (CST, USA) were used to probe the membranes. The membranes were then washed five times in TBST and incubated with HRP-conjugated secondary antibodies (anti-mouse or anti-rabbit, CST, USA) diluted 1:2 000 in TBST for 1 h. After five washes, the membranes were developed using an enhanced chemiluminescence kit (Biological Industries, Kibbutz Beit-Haemek, Israel).
Immunofluorescence assay
Platelets were fixed in 4% paraformaldehyde for 15 min and permeabilized in 0.5% Triton X-100 for 5 min. The cells were subsequently incubated with an antibody overnight at 4 °C after being blocked with 4% bovine serum albumin for 60 min. The cells were treated with a secondary antibody and DAPI before being photographed under a fluorescence microscope (FV3000, Olympus, Japan).
Caspase-3 assay
Caspase-3 activity was analyzed via a caspase-3 activity kit as described previously. Briefly, washed platelets (3 × 10⁸/mL) from mice were pretreated with ABT737 (5 μmol/L, Selleck, USA) or vehicle control for 2 h at 37 °C. The caspase-3 activity assay was performed on 96-well microtiter plates by adding 50 μL of platelet lysate per sample to 40 μL of assay buffer and 10 μL of caspase-3 substrate (Ac-DEVD-pNA, 2 mmol/L, DDJINDO, Japan). The samples were further incubated at 37 °C for 2 h, after which the absorbance at 405 nm was measured with an ELISA reader.
Platelet life span analysis
The platelet life span assay and adoptive platelet transfer assay were conducted as described previously. Briefly, the mice were injected intravenously with N-hydroxysuccinimide ester (NHS)-biotin (300 mg per 20 g mouse, Sigma, Germany). Whole blood was collected from the orbital vein at various time points (0, 1, 2, 3, and 4 days), and platelets were isolated and prepared. The cells were stained with FITC-conjugated mouse anti-CD41 (BioLegend, USA) and PE-streptavidin (BioLegend, USA), and then flow cytometry was used to analyze the platelet life span.
Bleeding time analysis
The bleeding time assay was performed using a razor blade to transect the mouse tail 3 mm from the tip, with the tail immersed in a 12 mL test tube containing PBS at 37 °C. Bleeding times were determined when the bleeding stopped for more than 10 s. If the bleeding time was longer than 15 min, the assay was stopped, and the bleeding time was 15 min. The control and experimental groups were matched for age, sex, and body weight.
Platelet aggregation
The number of washed platelets was normalized to a final concentration of 2–4 × 10⁸ cells/mL with Tyrode’s buffer. Diluted washed platelets (250 µL) were placed in an aggregometer cuvette, warmed to 37 °C, and measured in a dual-channel platelet aggregation apparatus (Chrono-log, USA). After 1 mmol/L CaCl2 was added, baseline measurements were obtained, and 0.012 U/mL thrombin (Chrono-log, USA) was added to induce aggregation. The percent aggregation was calculated from the amplitude of the tracings at 5 min and normalized to the response of the untreated control within an individual experiment.
Platelet adhesion assay
Platelets (2 × 10⁷ platelets/mL) prepared from the blood of the mice were incubated on Fg (100 µg/mL; Cayman, Hamburg, Germany)-coated coverslips (blocked with 1% BSA) for 60 min at 37 °C. Nonadherent platelets were removed, and the coverslips were washed with PBS before fixation with 4% paraformaldehyde. Platelets were permeabilized with 0.1% (v/v) Triton X-100 prior to staining with 0.1% (v/v) Alexa 594-conjugated phalloidin (Abcam, Cambridge, UK) for 60 min, and the coverslips were washed with PBS. Subsequently, adherent platelets were imaged with a 100× magnification oil immersion lens using a Leica SP5 II laser scanning confocal microscope equipped with a Leica DFC365 FX digital camera (Leica Microsystems, Heidelberg, Germany). Platelet surface areas were quantified via ImageJ software (NIH, USA).
In vivo overexpression
For the in vivo MK lineage-specific Becn1 overexpression model, the mice were anesthetized with tribromoethanol, and their knees were flexed with support behind each knee. The hair around the joint area was shaved, and the region was cleaned with 75% alcohol and iodine. A 1 mL syringe was inserted into the femur‒tibia joint through a puncture at the top of the femur between the condyles, with gentle twisting and pressure applied. After removal, 5 μL of viral solution (BrainVTA, China) was injected into the BM cavity using an insulin needle. Mice were monitored and allowed to recover, with assessments conducted 2 months post-injection. As a control, Becn1f/f male mice were injected with the rLV-GP1ba-EGFP-WPRE virus into the BM cavity. The rLV-GP1ba-Becn1-P2A-EGFP-WPRE virus was injected to specifically overexpress Becn1 in megakaryocytic lineage cells.
For in vivo liver specific SHBG overexpression model, mice were secured in a tail vein injection apparatus with their tails exposed. The tail was cleaned with 75% alcohol, and 200 μL of diluted viral solution was injected via the tail vein using an insulin needle. Assessments were conducted 2 months postinjection. As a control, the rAAV-TBG-EGFP-WPRE-PA virus was injected into the tail vein of both Becn1f/f and Becn1f/f;Pf4-iCre male mice. Conversely, the rAAV-TBG-Shbg-P2A-EGFP-WPRE-PA virus was injected to specifically overexpress SHBG in liver tissue.
Orchiectomy model
At 9 weeks of age, both male Becn1f/f and Becn1f/f;Pf4-iCre mice were subjected to ORX under tribromoethanol (Sigma, Germany) anesthesia followed by carprofen analgesia (50 µg/kg, Sigma, Germany). The sham group underwent anesthesia, suturing, and analgesia, without the removal of the testes. One month after surgery, samples were collected, and micro-CT scans were performed.
Blood clot contraction test
Briefly, platelets (2 × 10⁸ platelets/mL) prepared from the blood were preincubated with various concentrations of CoQ10 or control solvent for 50 min and then added to glass tubes containing 200 µg/mL Fg and 1 mmol/L Ca2+. Clot retraction was initiated by adding 0.1 U/mL thrombin. Clot retraction was monitored every 15 min for 90 min at 37 °C and documented photographically using a Nikon camera.
Micro-CT
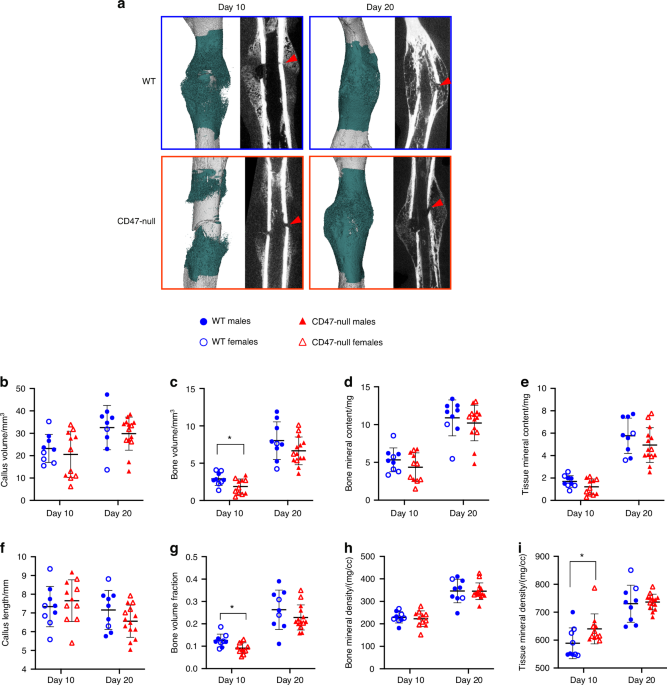
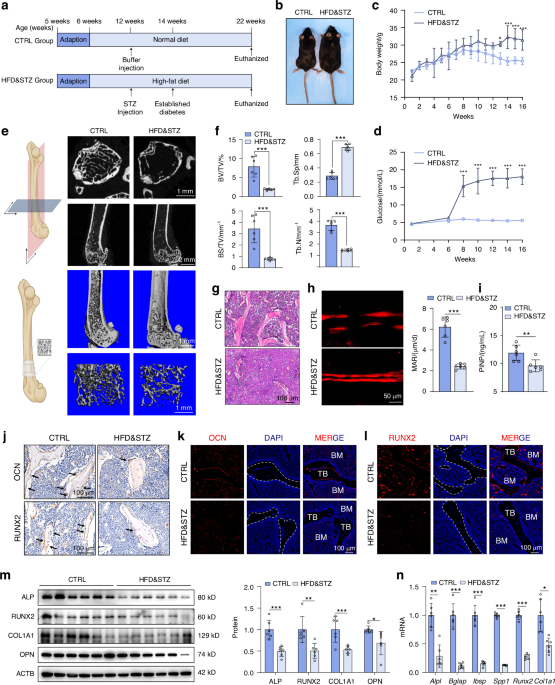
The femurs were scanned and analyzed for trabecular bone by micro-CT (SkyScan 1174, Bruker, Kontich, Belgium). The acquisition parameters were as follows: X-ray voltage = 50 kV, X-ray current = 800 μA, filter = 0.5 mm aluminum, rotation step = 0.7°, and image pixel size = 10.3 μm. After scanning, images were reconstructed using NRecon software (Bruker, Kontich, Belgium). Parameters of trabecular bone were determined using CTAn software (Bruker, Kontich, Belgium), and 3D image reconstruction was performed using CTvOX software (Bruker, Kontich, Belgium). For trabecular bone parameters, the volume of interest (VOI = 100 slices) was selected with reference to the distal growth plate. The trabecular bone regions started ~0.7 mm and 5 mm from the growth plate and extended toward the proximal end of the femur. The cancellous bone parameters of the femoral metaphysis included the trabecular BMD, bone volume-to-total tissue volume ratio (BV/TV), bone surface-to-total tissue volume ratio (BS/TV), SMI, Tb.N, and trabecular spacing (Tb.Sp).
Biomechanical properties
The biomechanical properties of the femur were measured via three-point bending and compression testing. Femur were collected and stored at −20 °C. Femur were tested via three-point bending with the posterior surface on the lower supports (5 mm apart), and the load was applied to the anterior surface centered between the lower supports, as previously described in detail (Akhter, Cullen, Gong, & Recker, 2001). Biomechanical structural strength variables, including the ultimate load and stiffness, were measured.
Calcein labeling
Mice were intraperitoneally injected with 10 mg/kg calcein in a 1% saline solution for 10 or 3 days before they were sacrificed. The femurs were fixed overnight in 4% paraformaldehyde, dehydrated in 30% sucrose for 2 days, and sectioned for calcein labeling.
Image flow analysis
Image flow cytometric analysis of the expression of Becn1 (NOVUS, USA) in MKs, macrophages and MSCs was performed with an image flow cytometer (Amnis, Merck Millipore). BM cells were fixed and permeabilized after staining for cell markers and labeled with antibodies against Becn1. The samples were visualized and analyzed for the expression of marker proteins with IDEAS 6.0 software (Amnis, Merck Millipore).
Bone marrow transplantation assay
A total of 1 × 10⁷ cells were harvested from the BM of Becn1f/f and Becn1f/f;Pf4-iCre male mice. The cells were injected into lethally irradiated (X-ray, 9 Gy) Becn1f/f and Becn1f/f;Pf4-iCre male mice through the tail vein. The BMD of the recipient mice was monitored for up to 2 months after transplantation.
Bone histology and immunohistochemistry
The fixed femoral bones were decalcified in 10% EDTA for 3 weeks, dehydrated in a graded ethanol series (70%–100%), cleared in xylene, and paraffin-embedded with the long axis of the bone parallel to the base plane to preserve anatomical orientation. Longitudinal serial 4 μm thick sections were cut and mounted on polylysine-coated microscope slides and subjected to hematoxylin and eosin, toluidine blue, and TRAP staining following the manufacturer’s instructions (Servicebio Science & Technology).
RNA sequencing analysis
Shenzhen BGI Genomics (BGI, China) conducted RNA extraction and cDNA library construction on mouse MKs from 3-month-old mice, followed by sequencing using the DNBSEQ platform. Reads that were of low quality, contaminated with adapters, or had a high content of unknown base were filtered out. The HISAT program was used for reference genome mapping. Differential gene analysis was performed using DESeq2.66 Genes with fold change ≥ 1.5 and P < 0.05 were considered upregulated, whereas genes with fold change ≤ 1/1.5 and P < 0.05 were considered downregulated. The bioinfokit package was used to calculate the logarithm of the protein’s differential fold change, with a base of 2, as well as the absolute value of the logarithm of the P value, with a base of 10, subsequently resulting in the creation of a volcano plot.67 Furthermore, a cluster heatmap depicting the DEGs was generated. The GO and KEGG databases were utilized for GSEA of the identified genes, and gseaplot2 was used for pathway visualization.68
Proteomic profiling
Beijing Novogene Corporation (Novogene, China) extracted mouse platelet proteins and performed TMT-based quantitative proteomics. Proteome Discoverer software was utilized for database retrieval, spectrum peptide analysis, and protein quantification. A further refinement process was subsequently executed through Proteome Discoverer software: peptide spectrum matches (PSMs) with a confidence level above 99% were considered reliable, and proteins containing at least one unique peptide were deemed reliable as well. Only trustworthy PSMs and proteins were retained, and false discovery rate (FDR) verification was implemented to eliminate peptides and proteins with an FDR greater than 1%. A comprehensive set of quality controls was then conducted, encompassing the distribution of peptide length, parent ion mass tolerance, unique peptide counts, protein coverage, and protein molecular weight. As an initial step, Proteome Discoverer utilized the original spectrum peak area to calculate the relative quantification values of each PSM in every sample. Next, the quantification information from all PSMs contained within the identified unique peptides was used to calibrate the relative quantification values of these peptides. The relative quantification values of each protein were subsequently calibrated by considering the quantification information of all unique peptides within that protein. The relative quantification values of proteins from the two groups were subjected to a t test to compute the corresponding P values. Proteins exhibiting fold change ≥ 1.5 and a P < 0.05 were considered upregulated, whereas proteins displaying fold change ≤1/1.5 and a P < 0.05 were considered downregulated. To visualize these findings, the bioinfokit package was used to calculate the logarithm of the protein fold change using a base of 2, as well as the absolute value of the logarithm of the P value using a base of 10, resulting in the creation of a volcano plot. Furthermore, a cluster heatmap was generated to visualize the differentially expressed proteins. For the analysis of measured proteins, GSEA via ClusterProfiler was performed based on the GO and Kyoto Encyclopedia of Genes and Genomes (KEGG) databases,69 whereas gseaplot2 was used for visualization of the autophagy pathway. Additionally, functional enrichment analysis of the differentially expressed proteins was conducted via the GO database, and a bubble plot was generated via matplotlib. Moreover, by utilizing pathview and matplotlib in conjunction with the KEGG database, the fold change and P value of all measured proteins within specific pathways were represented visually.
Statistical analysis
Statistical analyses were performed using SPSS version 22.0. An unpaired t test was used to compare two sets of data between different groups, whereas one-way analysis of variance (ANOVA) was used when comparing three or more sets of data among different groups. Compare the mean of each column with the mean of a control column (Dunnett’s multiple comparisons test was used adjust P value). Compare the mean of each column with the mean of every other column (Tukey’s multiple comparisons test was used adjust P value). The data are expressed as the mean ± standard error of the mean (SEM). P < 0.05 was considered to indicate a statistically significant difference.


Comments (0)