
Remember me
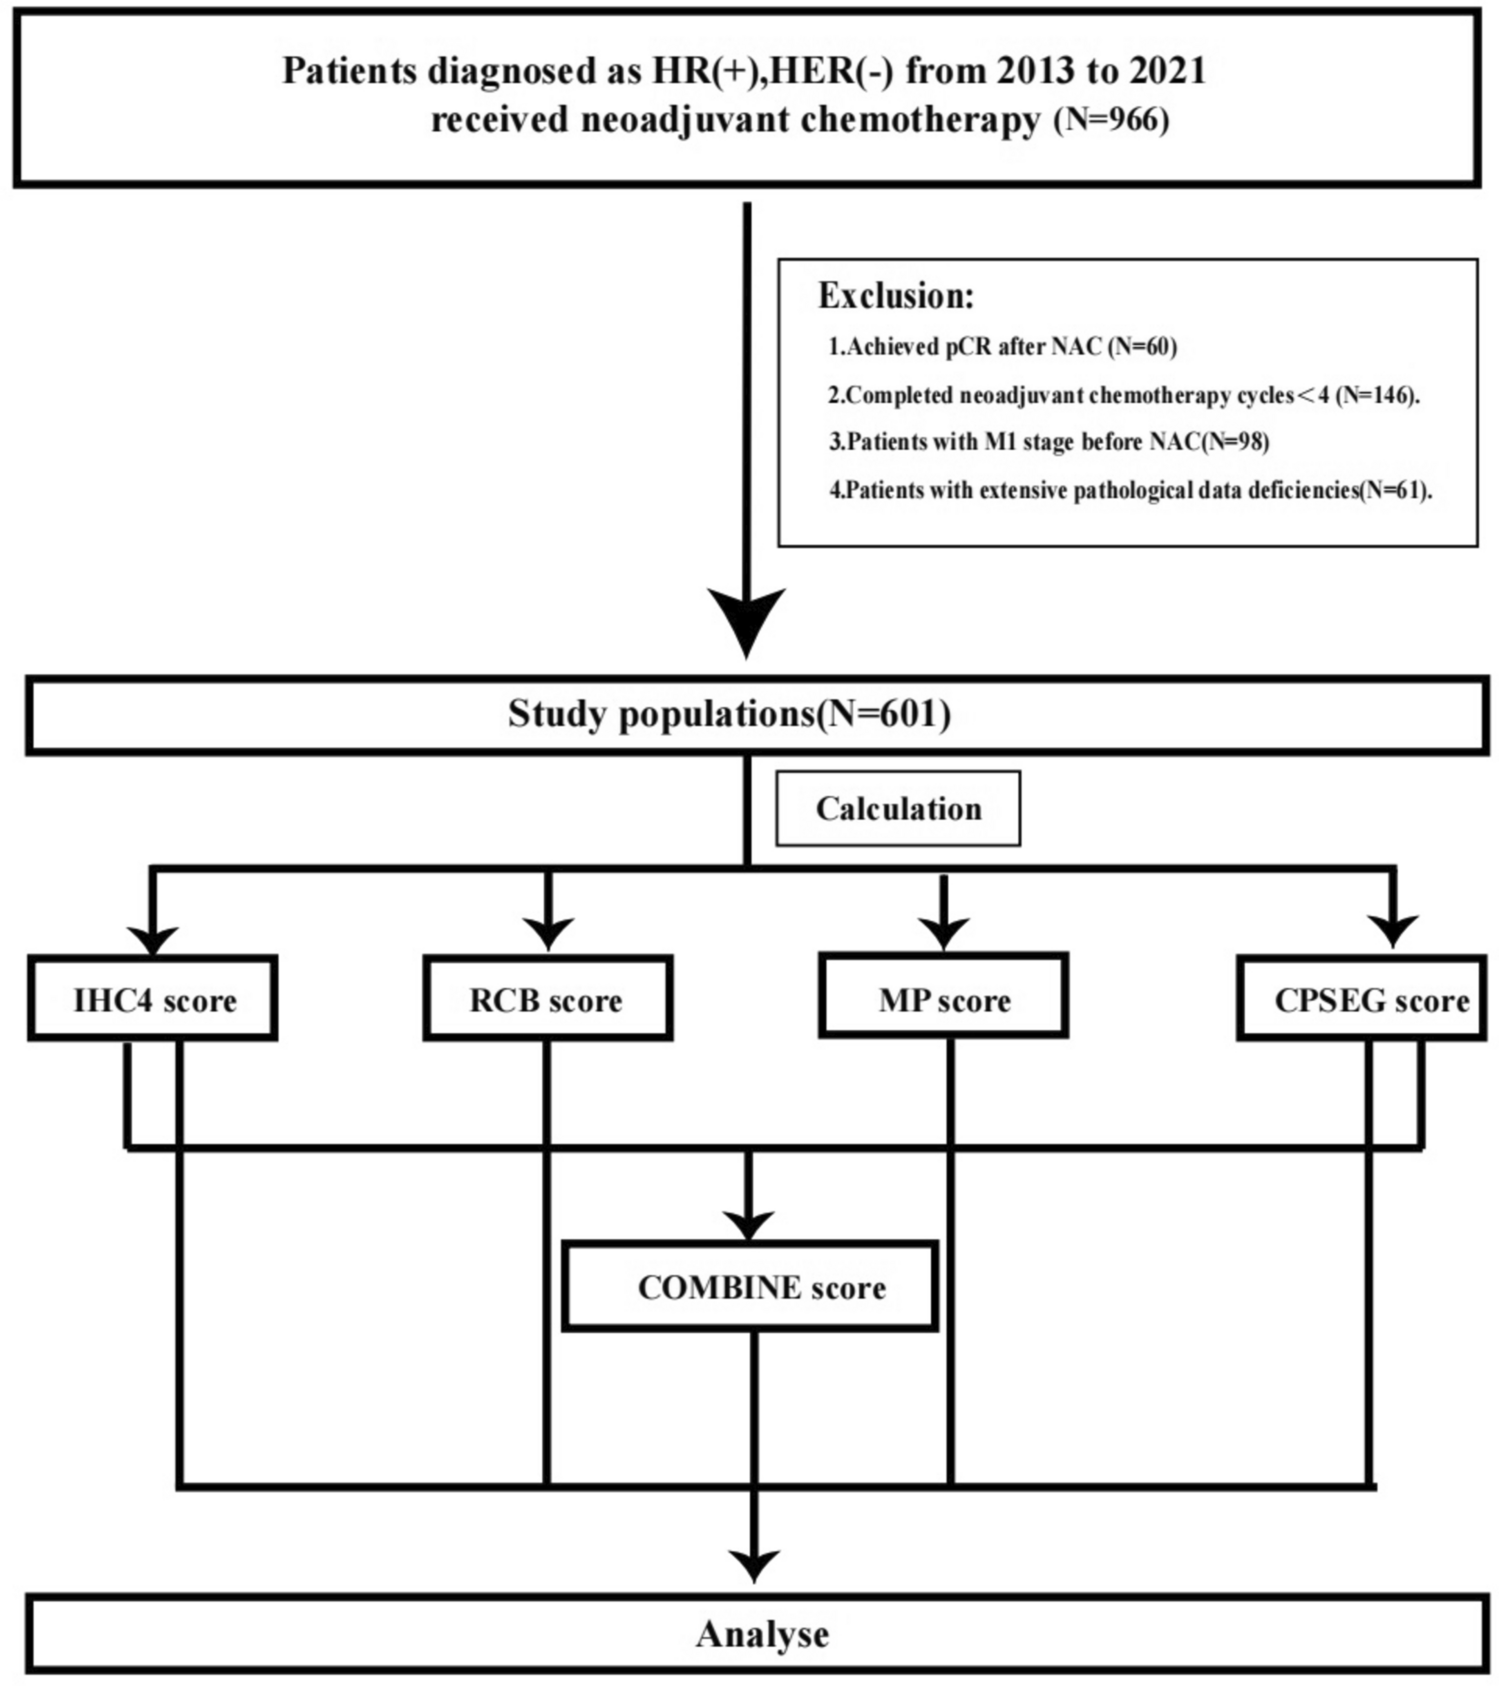
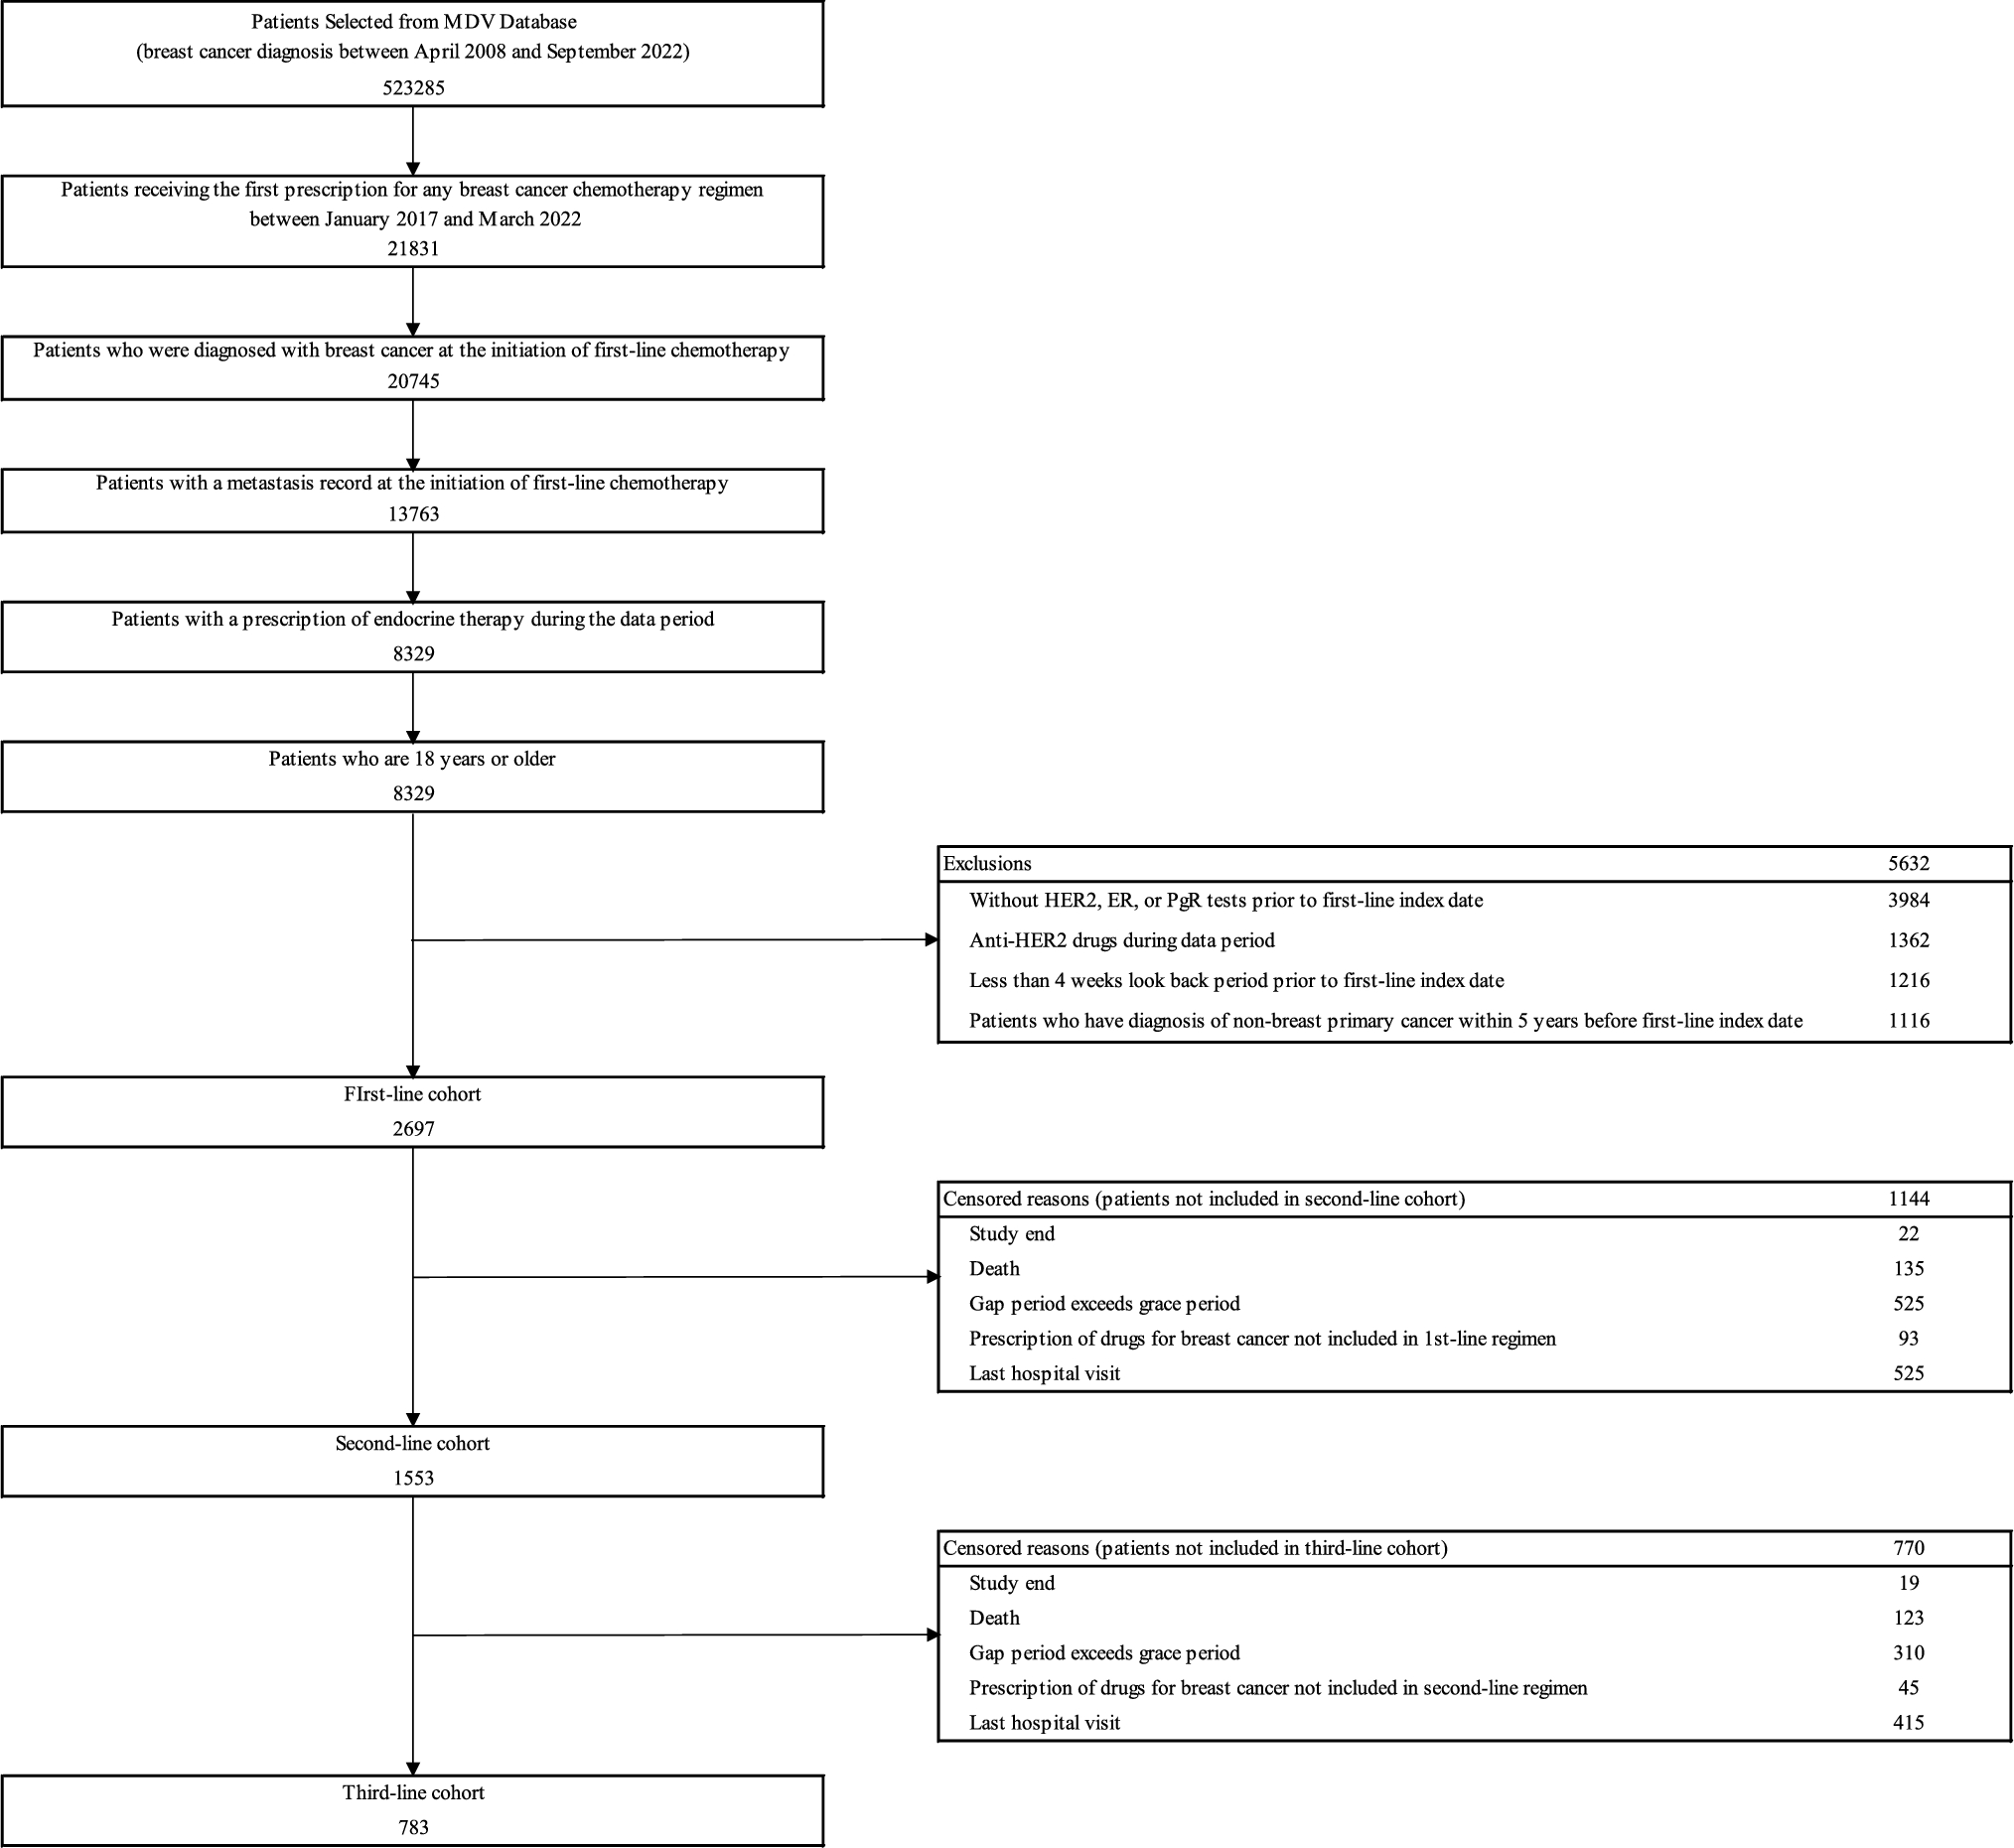
Data from 523,285 patients diagnosed with breast cancer between April 2008 and September 2022 were extracted from the MDV database. Of these, 2697 met the eligibility criteria and were included in the first-line cohort of HR+/HER2− mBC. Among them, 1553 (57.6%) and 783 (29.0%) were subsequently treated with second- and third-line chemotherapies, respectively, and were included in the second- and third-line cohorts (Fig. 1).
Fig. 1
Patient selection. Data from patients diagnosed with breast cancer between April 2008 and September 2022 were extracted from the MDV database. Patients were eligible if they received a new prescription for any breast cancer chemotherapy regimen (excluding adjuvant and neoadjuvant chemotherapy) between January 2017 and March 2022. First-line chemotherapy was defined as the first chemotherapy regimen administered after the HR+/HER2− mBC diagnosis. The index date of first-line chemotherapy was established as the start date of the first chemotherapy regimen in the metastatic setting, while the first-line cohort was defined as the patient population followed from the index date of first-line chemotherapy. Similar definitions were applied to the second- and third-line chemotherapies, index dates, and cohorts. Chemotherapy regimens were categorized as anthracycline-containing, taxane-containing, or other regimens for certain analyses. Details of these classifications are provided in Online Resource 1. The end date of exposure was defined as the earliest of the following: the study end date (September 30, 2022, the last date of available data), date of death, date of the last prescription for first-line chemotherapy (or second/third-line chemotherapy, considering the grace period), date when a different breast cancer treatment was initiated, or date of the last hospital visit. Notably, the grace period was set at 3 months, regardless of the chemotherapy used, and the gap period was defined as the interval between prescription dates for each chemotherapy. If the gap period exceeded the grace period, the last prescription date was defined as the previous prescription date plus the elapsed grace period. Meanwhile, the follow-up period was defined as the time from the index date of each line until the end of exposure. For the analysis of first-line chemotherapy, a minimum follow-up period of 180 days was required for inclusion. If the first regimen was prescribed within 6 months after surgery, it was defined as adjuvant chemotherapy. Conversely, if the date of the last prescription of the regimen was within 3 months before surgery, it was defined as neoadjuvant chemotherapy. If an anthracycline (doxorubicin + cyclophosphamide, epirubicin + cyclophosphamide, or epirubicin + 5-FU + cyclophosphamide) and a taxane (docetaxel + cyclophosphamide, paclitaxel, docetaxel, nab-paclitaxel, or bevacizumab + paclitaxel) were prescribed sequentially with an interval of ≤ 6 weeks, these regimens were classified as a series of neoadjuvant or adjuvant therapies. MDV medical data vision, HER2 human epidermal growth factor receptor 2, ER estrogen receptor, PgR progesterone receptor
Patient baseline characteristicsPatient baseline characteristics in the first-line cohort are shown in Table 1. Overall, the median age was 61.0 years. Before the first-line chemotherapy, 20.1% and 12.7% of patients received adjuvant and neoadjuvant chemotherapy, respectively, while 85.5% and 34.2% received ET and CDK4/6i treatment, respectively. Of the 2697 patients included in the first-line cohort, 520 (19.3%), 900 (33.4%), and 1277 (47.3%) received anthracycline-containing, taxane-containing, and other regimens, respectively, as their first chemotherapy. The percentages of patients with a medical history of adjuvant and neoadjuvant chemotherapy were 9.0% and 2.3% among those who received anthracycline-containing regimens, compared to 21.3% and 13.8% among those who received taxane-containing regimens, and 23.8% and 16.1% among those who received other regimens, respectively. Patients treated with anthracycline-containing, taxane-containing, and other regimens received prior ET in 63.5%, 80.9%, and 97.7%, and prior CDK4/6 inhibitors in 12.9%, 32.2%, and 44.2%, respectively (Online Resource 3).
Table 1 Demographics and disease characteristicsThe percentage of patients who received adjuvant therapy was lower in those aged ≥ 65 years (15.9%) compared to those aged < 65 years (23.3%). A similar trend was observed for patients aged ≥ 55 years and < 55 years. Furthermore, the percentage of neoadjuvant therapy was also similar between the age groups (Online Resource 4). Adjuvant and neoadjuvant chemotherapies were more frequent in patients with a history of ET (22.2%, 14.1%) than in those without a history of ET (8.2%, 4.6%) (Online Resource 4). Among patients treated with olaparib at any time during the follow-up period, the median age was 51.0 years, and 32.8% and 21.3% received adjuvant and neoadjuvant chemotherapy, respectively, while 26.2% received PARP inhibitor treatment before the first-line index date (Online Resource 5).
Treatment patternsFor the 2697 patients eligible for this study, the two most frequently used chemotherapy regimens were S-1 (20.1%) and paclitaxel + bevacizumab (20.0%) as the first-line chemotherapy; eribulin (12.2%) and paclitaxel + bevacizumab (11.4%) as the second-line chemotherapy; and paclitaxel + bevacizumab (6.9%) and eribulin (6.8%) as the third-line chemotherapy (Fig. 2). Among patients in the first-line cohort, S-1 (24.8%) and capecitabine (14.9%) were more frequently used in patients aged ≥ 65 years, whereas paclitaxel + bevacizumab (15.2%) and epirubicin + cyclophosphamide (7.1%) were used less frequently than those aged < 65 years (Online Resources 6, 7).
Fig. 2
Treatment patterns across the lines of chemotherapies (first/second/third-line cohorts). Changes in regimens from first- to third-line chemotherapies are illustrated in a Sankey diagram. Patients without a recorded chemotherapy regimen for HR+/HER2− mBC (Online Resource 1) who received another regimen in the second- or third-line cohort are classified as “others,” while those with no record of treatment for HR+/HER2− mBC are labeled as “none.” S-1 is a combination of three pharmacological compounds: tegafur, gimeracil, and oteracil
Treatment choices in patients aged ≥ 55 years, considered postmenopausal women, were similar to those in patients aged ≥ 65 years (Online Resources 6–9). Specifically, anthracycline-containing regimens were used more frequently in patients without prior ET than in those with prior ET in the first-line setting: epirubicin + cyclophosphamide (23.0% vs. 7.7%), epirubicin + 5-FU + cyclophosphamide (15.8% vs. 3.3%), and doxorubicin + cyclophosphamide (9.7% vs. 3.4%) (Online Resources 10, 11). In the treatment sequence from first- to second-line chemotherapy, the percentage of anthracycline-containing regimens followed by taxane-containing regimens was 30.1% (118 of 392) in patients without prior ET and 8.8% (203 of 2305) in patients with prior ET (Online Resource 12). In patients with prior CDK4/6 inhibitor treatment, S-1 (27.8%) and capecitabine (16.0%) were used more frequently, while anthracycline-containing regimens were used less frequently in the first-line setting than in patients without prior CDK4/6 inhibitor treatment (Online Resources 13, 14). Among patients treated with olaparib at any time during the follow-up period, 18% (11 of 61) received eribulin as their first-line chemotherapy (Online Resource 15).
TTNTD/TTDThe median (95% CI) TTNTD was 8.2 (7.7–8.8), 7.3 (6.7–7.9), and 6.0 (5.6–6.4) months in the first-, second-, and third-line cohorts, respectively (Fig. 3). The median (95% CI) TTD was 4.2 (4.0–4.5), 4.0 (3.7–4.3), and 4.2 (3.9–4.7) months in the first-, second-, and third-line cohorts (Online Resource 16). Regarding the TTNTD and TTD in the commonly used first-line chemotherapies, the median (95% CI) TTNTD and TTD for S-1 were 13.2 (11.2–16.8) and 5.7 (4.7–6.4) months, respectively, resulting in a difference of 7.5 months. The median (95% CI) TTNTD and TTD for eribulin were 7.3 (6.6–8.7) and 5.6 (5.2–6.6) months, respectively, leading to a difference of 1.6 months (Table 2).
Fig. 3
Time to next treatment or death. For each line of therapy, the TTNTD was defined as the duration from the index date to the next treatment or death, whichever occurred first. The TTNTD includes both the index date and event date, calculated as follows: TTNTD = (event date − index date) + 1. If no event was observed during the follow-up period, TTNTD was calculated as (end of the follow-up period − index date) + 1. The results are graphically depicted using Kaplan–Meier curves, which plot the event-free survival rate against time. Kaplan–Meier estimates and two-sided 95% CIs are presented. TTNTD shortens and diminishes in effectiveness as therapy progresses. CI confidence interval, CT chemotherapy, MST median survival time
Table 2 TTNTD and TTD values of the five most frequently used first-line chemotherapiesMedical costThe median monthly costs increased across chemotherapy lines, with total costs of 277.1, 340.9, and 378.4 thousand yen for the first-, second-, and third-line treatments, respectively. Drug costs also rose, reaching 146.0, 188.1, and 223.1 thousand yen for each line. Outpatient costs followed a similar trend, rising from 152.2 to 231.9 thousand yen from the first to third line. Hospitalization costs at the third quartile (Q3) increased from 111.9 to 150.2 thousand yen across the treatment lines (Table 3).
AEs of interestOverall, nausea/vomiting, neutropenia/leukopenia, febrile neutropenia, and diarrhea occurred in 62.6% 20.5%, 4.9%, and 11.9% of patients, respectively. In patients treated with doxorubicin + cyclophosphamide, epirubicin + cyclophosphamide, epirubicin + 5-FU + cyclophosphamide, capecitabine, and S-1, the incidence of nausea/vomiting was 88.0% (146 of 166), 87.8% (346 of 394), 81.2% (138 of 170), 29.0% (141 of 486), and 38.9% (320 of 823), respectively. The incidence of neutropenia/leukopenia was 41.0% (68 of 166), 47.7% (188 of 394), 60.6% (103 of 170), 3.1% (15 of 486), and 5.0% (41 of 823), respectively. The incidence of febrile neutropenia was 9.0% (15 of 166), 15.5% (61 of 394), 15.9% (27 of 170), 0.6% (3 of 486), and 1.6% (13 of 823), respectively. For S-1, the incidence of diarrhea was 18.8% (155 of 823) (Table 4).
Comments (0)