
Remember me
A total cohort of 368 patients was initially considered for the study. Of these, 343 patients were analyzed, while 25 were lost to follow-up. Median follow-up was 77 months (range: 8–175). Patients and tumor characteristics are showed in Table 1
Table 1 Patients and Tumor CharacteristicsTumor characteristics and surgical treatmentMost tumors were located on the right side (176 cases, 51.3%), with the rest on the left (167 cases, 48.7%). Breast-conserving surgery was performed in 185 cases (53.9%). The remaining 158 patients (46.1%) underwent mastectomy. The median number of lymph nodes removed was 19 (range: 6–43). Histological analysis revealed that 287 tumors (83.7%) were ductal, 52 (15.1%) were lobular, and 4 (1.2%) were classified as other types. Tumor subtypes were distributed as follows: Luminal A (122 cases, 35.6%), Luminal B (126 cases, 36.7%), HER2 positive (66 cases, 19.2%), and triple-negative breast cancer (TNBC) (27 cases, 7.9%), with 2 cases (0.6%) having unknown subtypes. The tumor grade was predominantly Grade II (180 cases, 52.5%), followed by Grade III (143 cases, 41.7%), and Grade I (9 cases, 2.6%), with grade unknown in 11 cases (3.2%).
The majority of tumors had negative surgical margins (297 case, 86.6%), 13 cases (3.8%) classified as close, 5 cases (1.5%) as positive and 28 cases (8.1%) unknown. The T-stage distribution was as follows: 114 (33.2%) T1, 194 (56.6%) T2, 21 (6.1%) T3, 6 cases (1.8%) T4, and 8 (2.3%) T unknown. The median lesion diameter was 23 mm (range: 5–90). The N-stage was predominantly N2 (193 cases, 56.3%), followed by N3 (103 cases, 30.0%), and N1 (47 cases, 13.7%). All patients (100%) underwent complete ALND. The median number of positive lymph nodes was 7 (range: 1–28), with a median lymph node ratio (number of metastatic lymph nodes/total removed lymph nodes) of 41.7% (range: 4.8–100%).
Adjuvant therapyTreatment characteristics are depicted in Table 2. Chemotherapy was administered to 301 patients (87.8%), while 42 patients (12.2%) did not receive chemotherapy, primarily due to their advanced age (median 79 years, range: 46–89). The most common chemotherapy regimen was a combination of taxanes and anthracyclines (267 patients, 77.8%). Anti-HER2 therapy was administered to 62 patients (18.1%). Hormonal therapy was given to 297 patients (86.6%), predominantly aromatase inhibitors (206 patients, 60.1%).
Table 2 Treatment CharacteristicsRadiation therapy was administered to the total amount of 343 patients. Of these, 185 (53.9%) received breast-targeted RT, while 158 (46.1%) were treated to the chest wall. The median dose for both the breast and chest wall was 50 Gy (range: 45–60) in 25 fractions (range: 23–30). All patients (100%) received regional node irradiation with a consistent dose of 45 Gy in 25 fractions. The median overall treatment duration was 43 days (range: 30–72).
ToxicityAcute toxicity was observed in 342 (99.7%) patients, with radiodermatitis reported in all of these patients. The severity of radiodermatitis was predominantly Grade 1 (244 cases, 71.1%), with 39 (11.4%) cases of Grade 2 and 59 (17.2%) cases of Grade 3. Just one patient did not develop any grade of toxicities. Acute edema occurred in 27 cases (7.8%), with the majority being Grade 1 (23 cases, 6.7%), followed by Grade 2 (3 cases, 0.9%) and Grade 3 (1 case, 0.3%). No cases of acute pneumonitis or pericarditis were recorded.
Late pulmonary fibrosis occurred in 3 (0.9%) patients, and late cardiotoxicity was observed in 6 (1.8%) patients, including valvular dysfunction, heart failure, and vascular complications. Of these, 4 were left-sided BC. Lymphedema in the ipsilateral arm was reported in 32 (9.3%) patients, primarily Grade 1 or 2. Second malignancies developed in 17 (5.0%) patients, with lung cancer and hematologic malignancies being the most common.
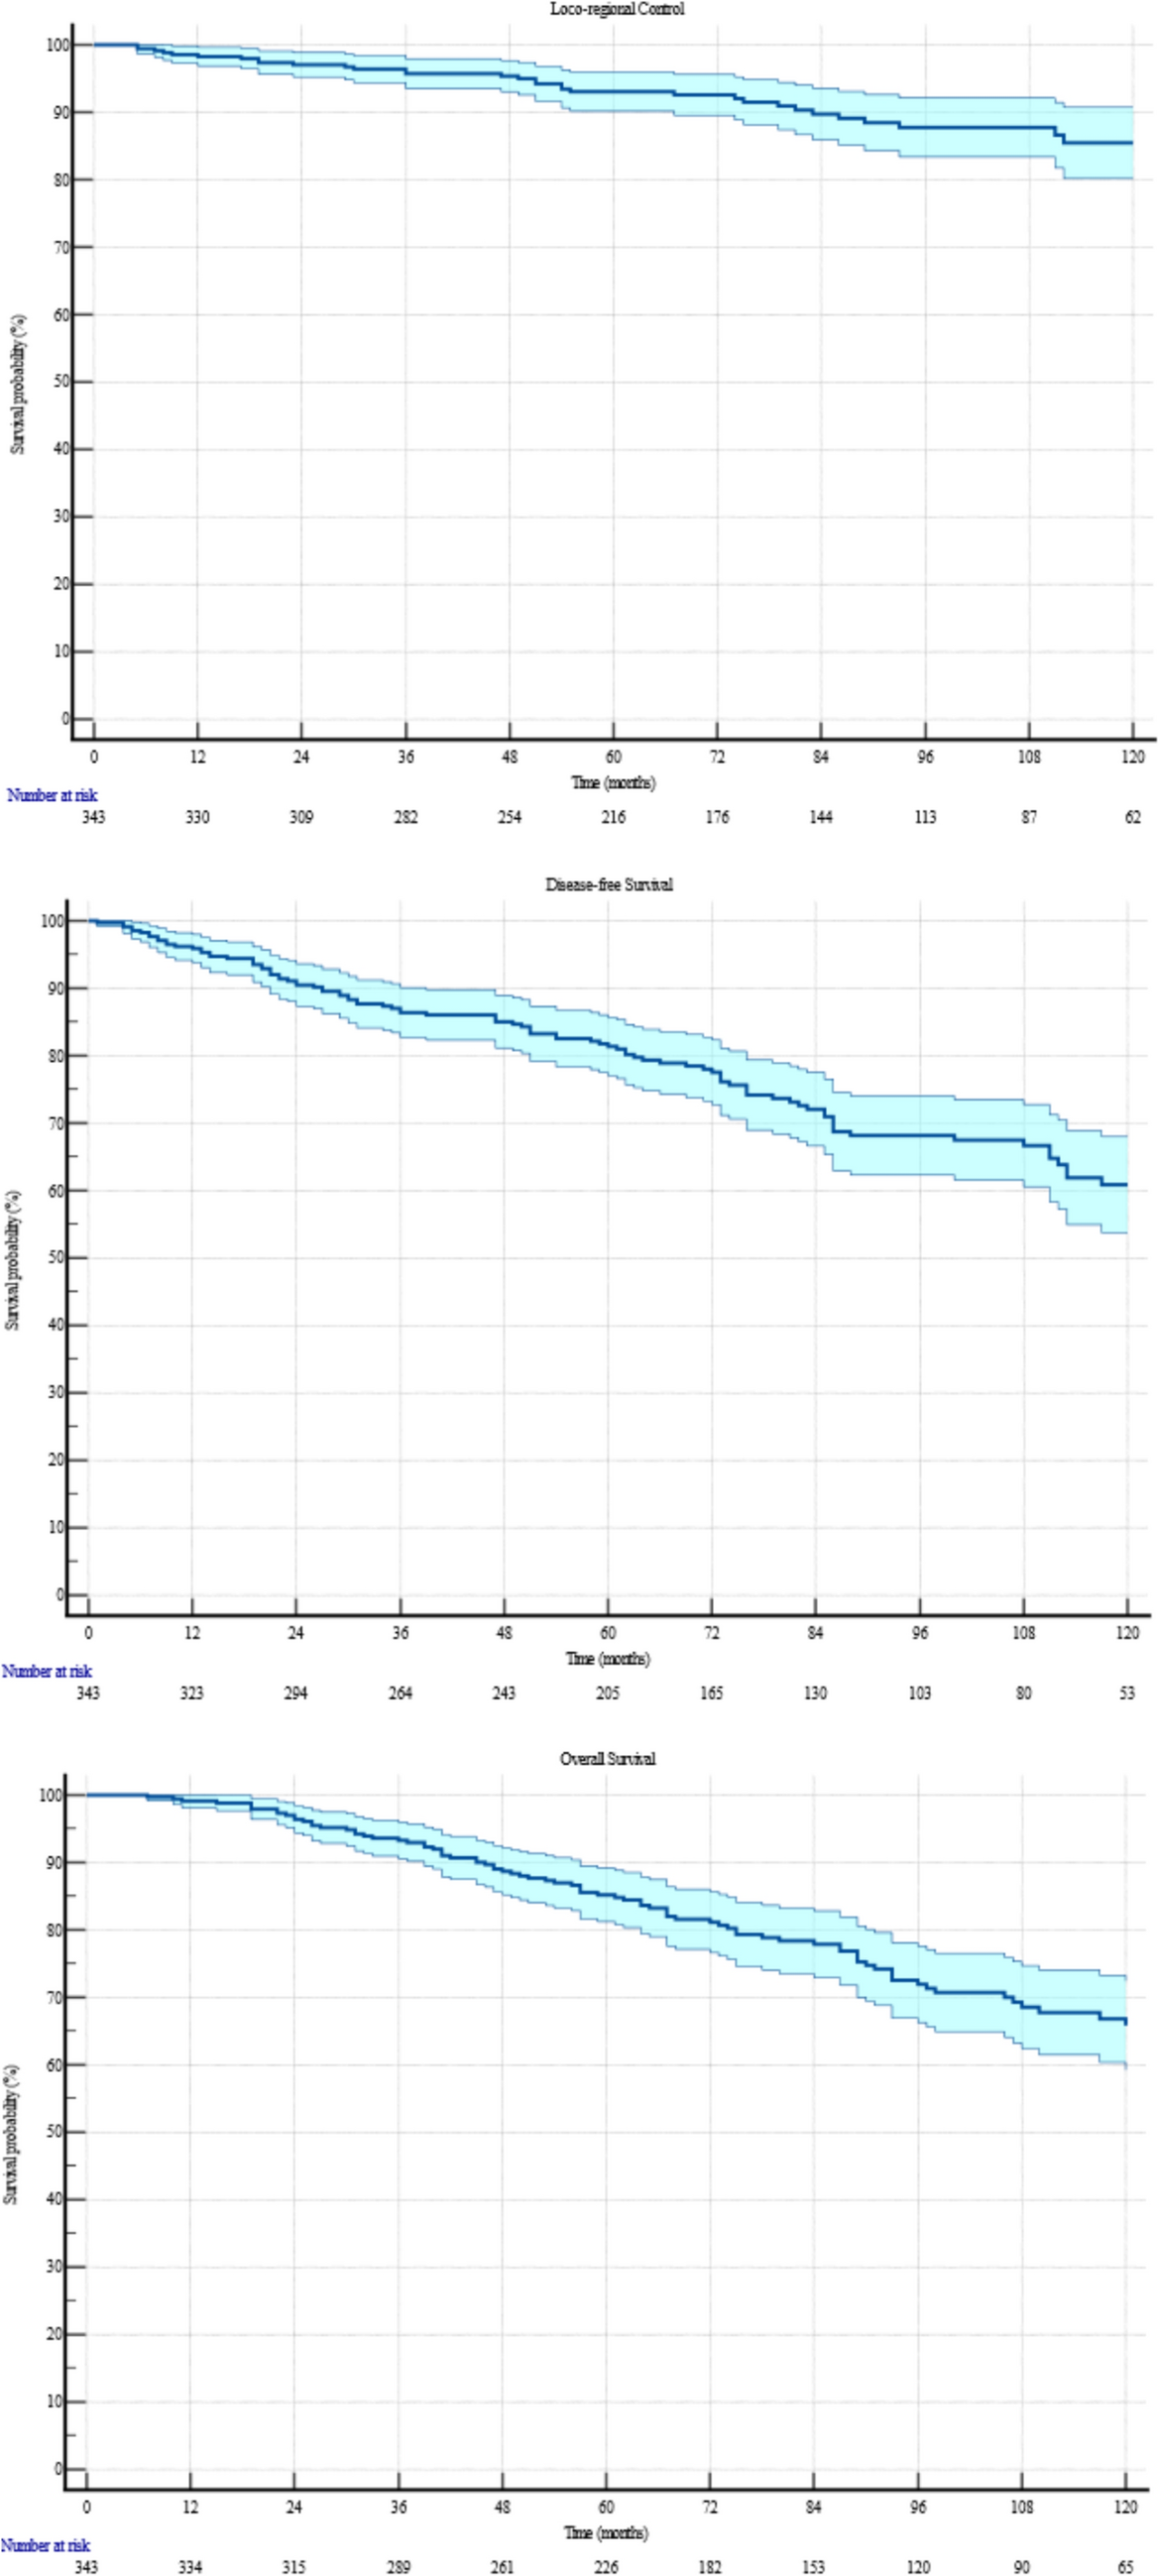
Clinical outcomesLoco-regional recurrence occurred in 39 (11.4%) patients, with a median control duration of 74 months (range: 5–173). Specifically, 8 (2.3%) patients had local recurrences, 20 (5.8%) had regional recurrences, and 11 (3.2%) experienced both. The 5- and 10-year Kaplan–Meier estimates for loco-regional control were 93.0% (95% CI: 91.5%–94.5%) and 85.4% (95% CI: 81.7%–88.1%), respectively. Figure 1 depicts the Kaplan-Meyer for LRC, DFS and OS. Univariate Cox analysis identified a strong correlation between the Luminal B subtype and an increased risk of loco-regional recurrence (HR = 3.01, 95% CI: 1.34–6.76; p = 0.0078). This correlation was further confirmed in multivariate Cox analysis, where being Luminal B remained a significant factor (HR = 2.84, 95% CI: 1.25–6.47; p = 0.0127). Table 3 synthetize all correlation analysis.
Fig. 1.
10-years Kaplan-Meyer for LRC, DFS and OS
Table 3 Factors Related to Survival OutcomesDisease recurrence occurred in 100 (29.2%) patients, with a median onset time of 70 months (range: 1–173). The 5- and 10-year actuarial rates for DFS were 81.4% (95% CI: 79.3%–83.5%) and 60.9% (95% CI: 57.6%–64.5%), respectively. Univariate Cox analysis identified significant associations between DFS and the absolute number of positive lymph nodes (HR = 1.04, 95% CI: 1.02–1.07, p = 0.0005) and lymph node ratio (HR = 6.00, 95% CI: 2.92–12.31, p < 0.0001). Patients with 1–3 positive lymph nodes had a median DFS of 70 months, with 5- and 10-year rates of 84.7% (95% CI: 79.0%–91.4%) and 74.4% (95% CI: 65.6%–83.2%), respectively. Those with more than 4 positive nodes also had a median DFS of 70 months, but their 5- and 10-year rates were lower, at 80.9% (95% CI: 78.6%–83.2%) and 58.9% (95% CI: 55.0%–62.8%), respectively. Additionally, T2-stage tumors (HR = 1.63, 95% CI: 1.02–2.58; p = 0.04), N3 classification (HR = 3.14, 95% CI: 1.53–6.42; p = 0.002), Luminal B subtype (HR = 1.81, 95% CI: 1.14–2.87; p = 0.01), and TNBC subtype (HR = 2.34, 95% CI: 1.14–4.83; p = 0.02) were also associated with worse DFS outcomes. Multivariate Cox analysis confirmed that lymph node ratio (HR = 9.76, 95% CI: 3.12–30.53, p = 0.0001), Luminal B subtype (HR = 2.03, 95% CI: 1.26–3.29, p = 0.004), and TNBC subtype (HR = 2.70, 95% CI: 1.22–5.99, p = 0.01) were significant predictors of poor DFS.
A total of 98 (28.6%) deaths were recorded, with a median OS of 76 months (range: 6–173). The 5- and 10-year actuarial rates for OS were 85.2% (95% CI: 83.2%–87.2%) and 65.8% (95% CI: 62.4%–69.2%), respectively. In the Cox univariate analysis, significant associations with OS were observed across multiple factors: older age (HR = 1.04, 95% CI: 1.02–1.06; p < 0.0001) and anticoagulants use (HR = 4.42, 95% CI: 2.52–7.75; p < 0.0001) showed strong correlations as risk factors. Hypertension (HR = 2.03, 95% CI: 1.36–3.05; p = 0.0006), diabetes (HR = 2.56, 95% CI: 1.51–4.33; p = 0.0005), dyslipidemia (HR = 2.26, 95% CI: 1.37–3.71; p = 0.0013), and the number of positive lymph nodes (HR = 1.05, 95% CI: 1.02–1.07; p = 0.0001) were also significantly associated with worse OS outcomes. For patients with 1 to 3 positive lymph nodes, the 5- and 10-year actuarial OS rates were 92.3% (95% CI: 88.0%–96.6%) and 76.5% (95% CI: 67.4%–85.6%), respectively, while for those with more than 4 positive nodes, these rates were 84.1% (95% CI: 81.9%–86.3%) and 64.4% (95% CI: 60.8%–68.0%), respectively. Lymph node ratio (HR = 4.04, 95% CI: 1.95–8.35; p = 0.0002), nodal stages N2 (HR = 3.38, 95% CI: 1.34–8.55; p = 0.01) and N3 (HR = 5.51, 95% CI: 2.17–14.01; p = 0.0003), as well as the Luminal B subtype (HR = 1.64, 95% CI: 1.02–2.63; p = 0.042) and TNBC subtype (HR = 2.49, 95% CI: 1.17–5.28; p = 0.017), were significant risk factors for OS. Conversely, undergoing hormonal therapy was associated with a protective effect (HR = 0.57, 95% CI: 0.34–0.95; p = 0.033), and chemotherapy demonstrated a strong protective association (HR = 0.28, 95% CI: 0.17–0.45; p < 0.0001). In the Cox multivariate analysis, anticoagulants use (HR = 2.56, 95% CI: 1.22–5.36; p = 0.013) and higher number of positive lymph nodes (HR = 1.05, 95% CI: 1.03–1.08; p = 0.0001) remained significant predictors of poor OS. The Luminal B subtype (HR = 1.78, 95% CI: 1.07–2.95; p = 0.025) continued to show a significant correlation with reduced OS, while chemotherapy maintained its protective role (HR = 0.42, 95% CI: 0.22–0.80; p = 0.008).
Comments (0)