
Remember me
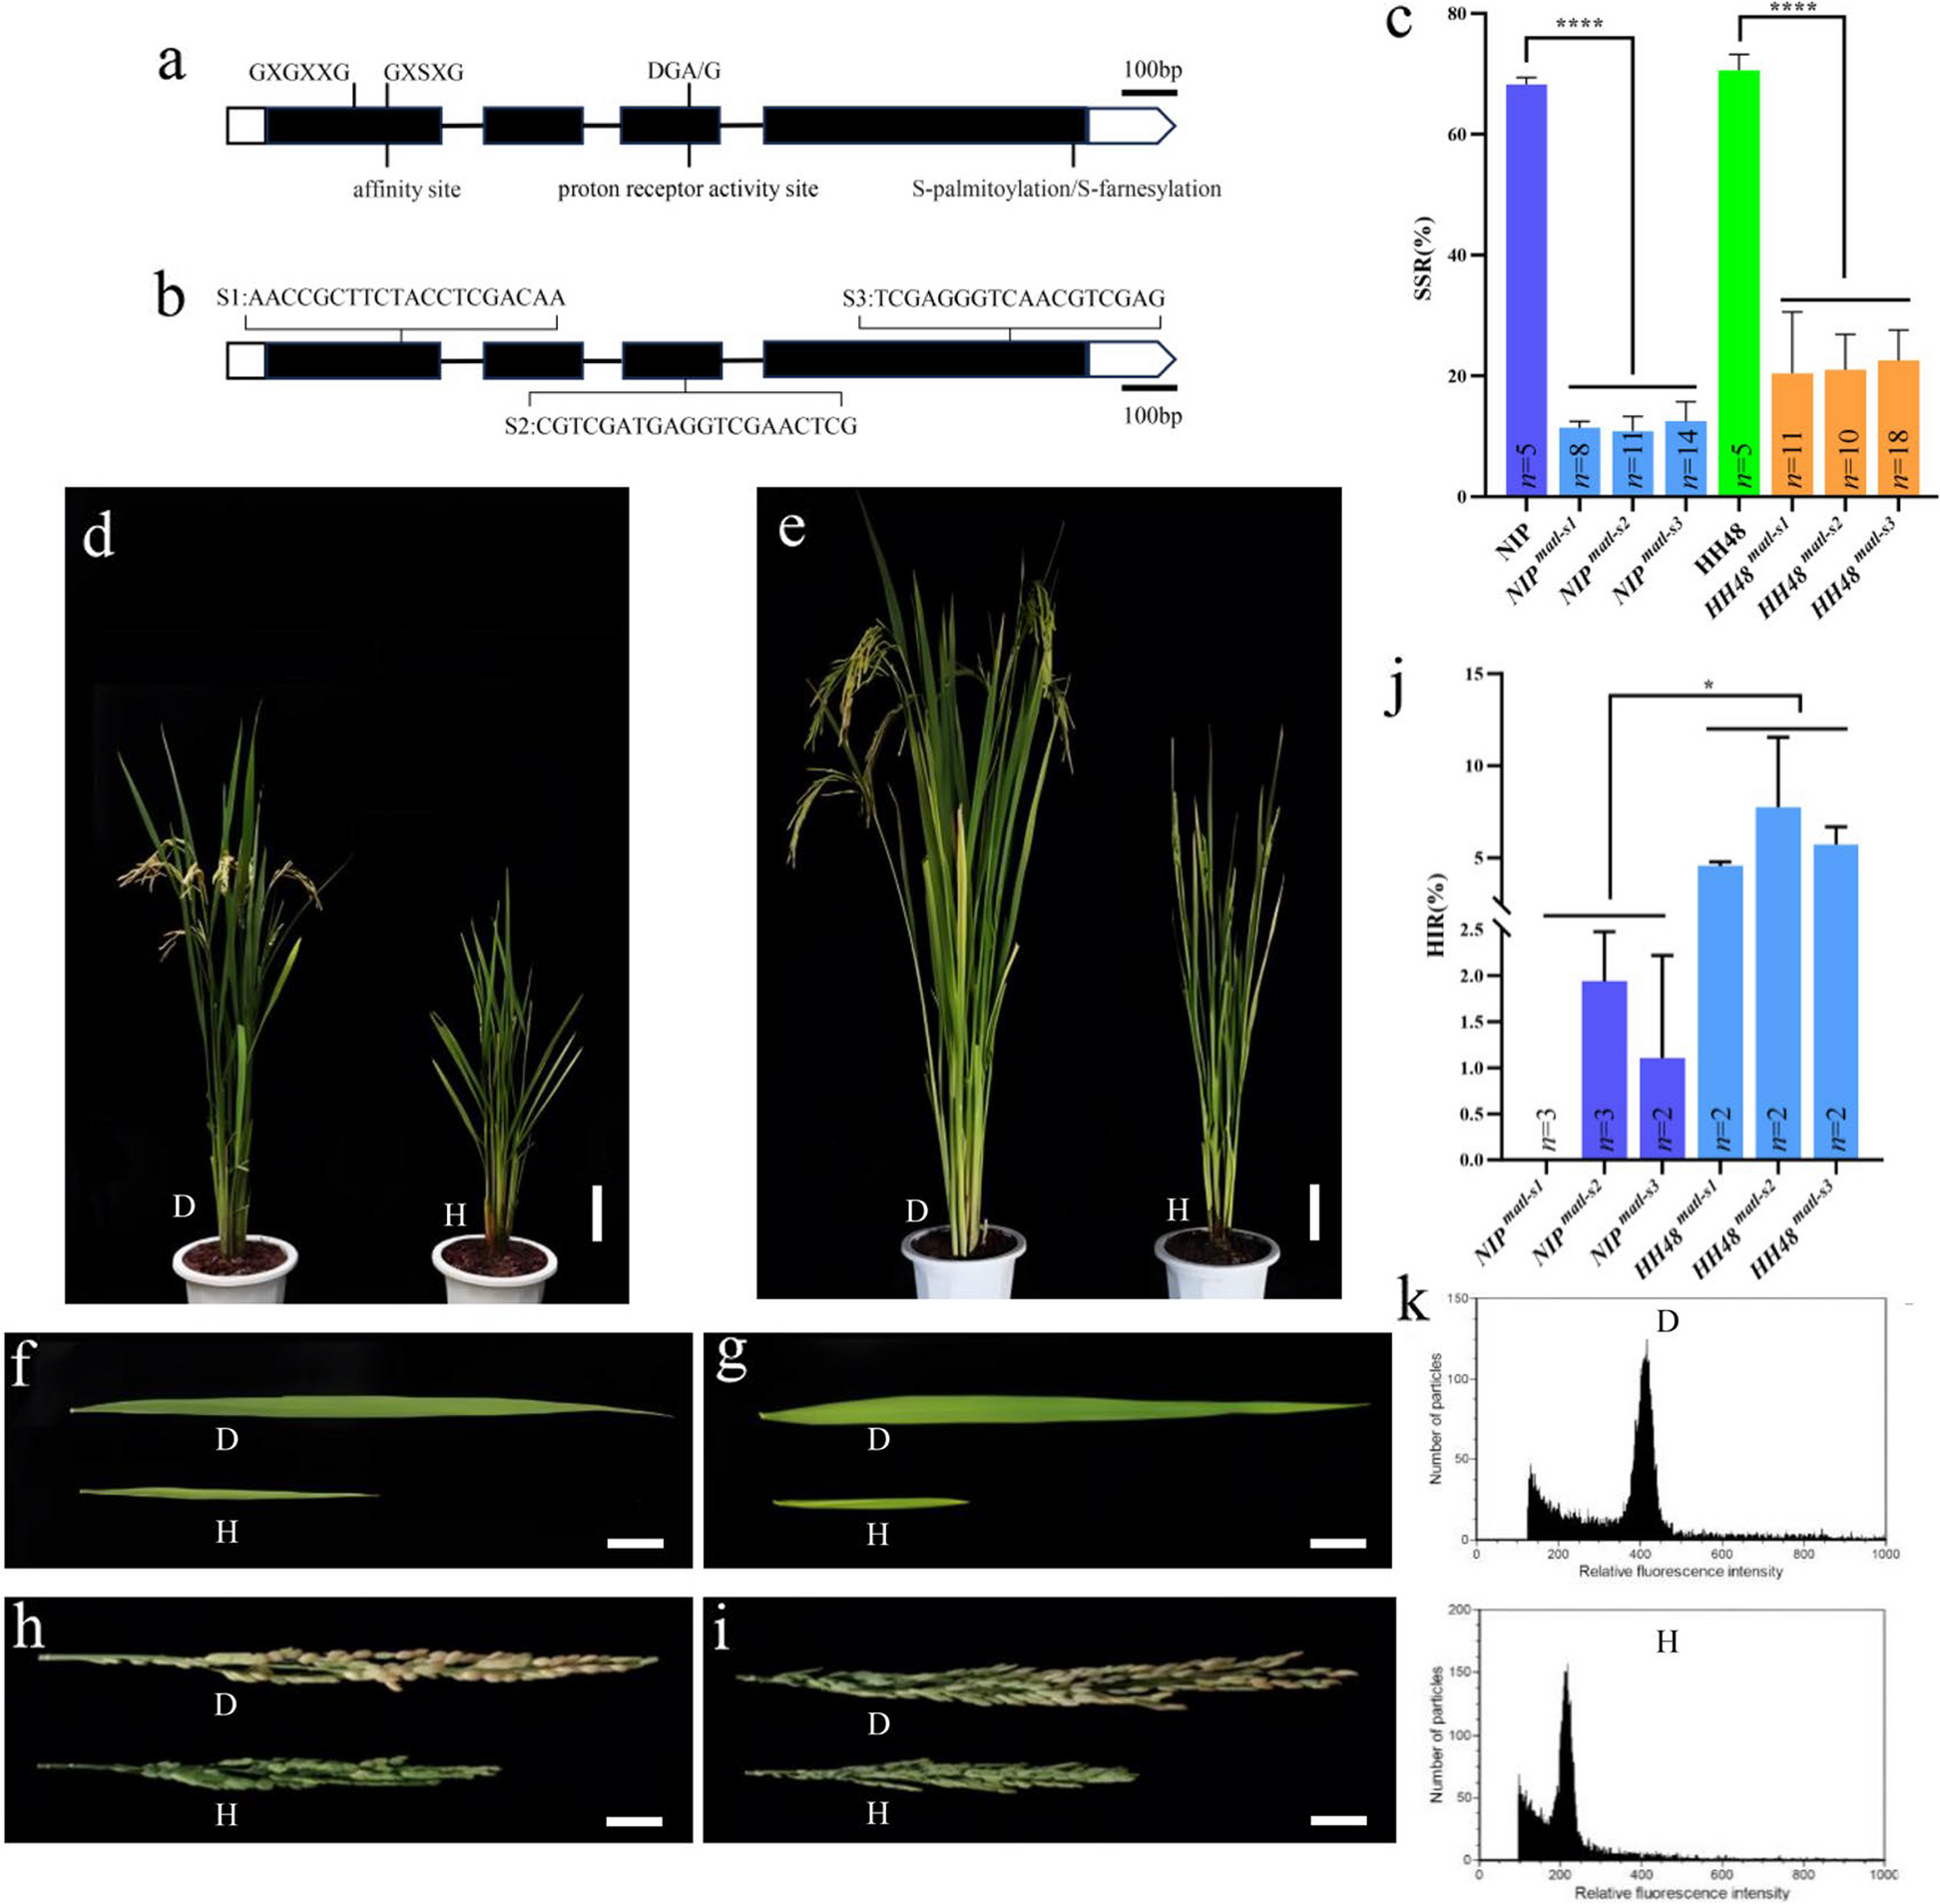


Protein domain prediction of OsMATL (LOC_Os03g27610) using Pfam (Pfam.xfam.org) and UniProt (UniProt.org) revealed that the gene contains three motifs (GXGXXG, GXSXG, and DGA/G) including one affinity base activity site, one proton receptor activity site, and an S-palmitoylation or S-farnesylation site (Fig. 1a). Three target sites were designed in the OsMATL coding region: S1 was designed in the first exon, which can effectively disrupt the MATL protein’s function; S2 was designed in the third exon at the DGA/G motif and proton receptor activity site; S3 was designed in the fourth exon, 8 bp upstream of the natural mutation site in maize (Fig. 1b). Mutants with different site-shifted mutations were generated in both indica variety HH48 and japonica variety NIP [24].
Fig. 1
Mutation site of OsMATL affects HI efficiency in rice. a Gene structure diagram of OsMATL. Each part represents an exon; white boxes represent non-coding regions, and black boxes represent coding regions. From left to right, the exons are the first to fourth exons. b Knockout target sequences of OsMATL. S1 represents the knockout target in the first exon, S2 represents the knockout target in the third exon, and S3 represents the knockout target in the fourth exon. c SSRs of different mutation sites in self-crossed NIP and HH48. Values are presented as mean ± standard deviation. ****, P < 0.0001. A two-tailed t-test was used (NIP vs NIP matl−s1, P = 2.61065E − 17; NIP vs NIP matl−s2, P = 3.87876E − 17; NIP vs NIP matl−s3, P = 8.73929E − 18; HH48 vs HH48 matl−s1, P = 4.10078E − 08; HH48 vs HH48 matl−s2, P = 1.631E − 10; HH48 vs HH48 matl−s3, P = 3.18875E − 15). “n” indicates the number of rice plants used for SSR statistics. d Plant morphology of NIP selfed diploid and haploid. Bars = 7 cm. e Plant morphology of HH48 selfed diploid and haploid. Bars = 7 cm. f Leaf morphology of NIP selfed diploid and haploid. Bars = 3 cm. g Leaf morphology of HH48 selfed diploid and haploid. Bars = 3 cm. h Panicle morphology of NIP selfed diploid and haploid. Bars = 15 mm. i Panicle morphology of HH48 selfed diploid and haploid. Bars = 25 mm. j HIR of OsMATL different mutation sites in self-crossed plants. Values are presented as mean ± standard deviation. *, P < 0.05. A two-tailed t-test was used (P = 0.00624). “n” represents the HIR statistics for different mutation types at various OsMATL mutation sites. k Determination of cell ploidy level using flow cytometry. D, diploid; H, haploid
In the T2 generation, three homozygous mutants with 1 bp insertion, 1 bp deletion, and 10 bp deletion were identified in S1 (NIP matl−s1−1, NIP matl−s1−2, NIP matl−s1−3). Additionally, three homozygous mutants with 5 bp, 1 bp, and 9 bp deletions were found in S2 (NIP matl−s2−1, NIP matl−s2−2, NIP matl−s2−3), and two homozygous mutants with 1 bp insertion and 4 bp deletion were identified in S3 (NIP matl−s3−1, NIP matl−s3−2) in the NIP background. In the HH48 background, two homozygous mutants with 1 bp insertion and 4 bp deletions in S1 (HH48 matl−s1−1, HH48 matl−s1−2), two homozygous mutants with 5 bp deletion and 1 bp deletion in S2 (HH48 matl−s2−1, HH48 matl−s2−2), and two homozygous mutants with 1 bp insertion and 4 bp deletions in S3 (HH48 matl−s3−1, HH48 matl−s3−2) were screened for SSR and HIR studies.
All mutants, except for NIP matl−s3−1 and HH48 matl−s3−1, resulted pre-termination of the MATL protein (Additional file 1: Fig. S1). The results showed that the frameshift mutation at the S1 locus led to a truncation of over 300 amino acids, resulting in a simpler protein structure. The frameshift mutation at the S2 locus caused the loss of the DGA/G motif and the proton receptor active site, leading to premature translation termination to varying extents; the protein structure was more complex than that of the S1 mutation. The mutation at the S3 locus resulted in only minor changes to the C-terminal amino acids, and the protein structure remained similar to that of the wild type (WT).
No obvious morphological differences were observed between the mutants and their corresponding WT (Additional file 1: Fig. S2). The range of SSRs of OsMATL coding region mutants in NIP and HH48 were 10.9–12.4% and 20.3–22.9%, respectively, both significantly lower than those of the WT. However, no significant differences in SSRs were observed among the mutants originating from the three different mutation sites (Fig. 1c). All mutants, except for NIP matl−s1, exhibited the ability to induce haploids through self-pollination. Haploid plants derived from NIP and HH48 exhibited typical haploid characteristics, such as reduced size and male sterility (Fig. 1d–i). Flow cytometry confirmed the presumed ploidy level of these haploids (Fig. 1k).
Further analysis revealed that the self-pollination HIRs for NIP matl ranged from 0 to 2.61%, while for HH48 matl, the range was 3.94 to 11.54%. Among the mutants, those with the highest HIR at the S2 site were 1.84% in NIP and 7.78% in HH48, with the 5 bp deletion mutant at the S2 site in HH48 (HH48 matl−s2−1) reaching 11.54%. This was followed by mutants, which showed HIRs of 0.76% in NIP and 5.78% in HH48, respectively; mutants at the S1 site, with HIRs of 0% in NIP and 4.7% in HH48, respectively (Fig. 1j; Additional file 2: Table S1-S2).
These results suggest that the loss of function of OsMATL can induce haploids in both indica and japonica background. Furthermore, the HI capability of the OsMATL coding region mutants was significantly higher in the indica background than in the japonica background, and the HIR for mutants at the S2 site was higher than that for mutants at other sites.
Phylogenetic analysis of homologous genes in the DMP gene familyPrevious study has suggested that sequence similarity greater than 40% may indicate potential functional similarity [25]. We identified ZmDMP protein sequences in the rice genome and selected five ZmDMP homologous proteins with sequence identities exceeding 40% through BLAST searches on NCBI (Additional file 2: Table S3). Based on decreasing sequence similarity to ZmDMP, the orthologs were named OsDMP1 (LOC_Os08g01530), OsDMP2 (LOC_Os05g48840), OsDMP3 (LOC_Os01g29240), OsDMP4 (LOC_Os02g27800), and OsDMP5 (LOC_Os12g22270).
Using the MEGA 7.0 software, we constructed evolutionary trees for these five homologous proteins, along with the ZmDMP protein, and homologs from Zea mays, Arabidopsis thaliana, Medicago truncatula, Solanum lycopersicon, and Brassica napus. DMP genes in Zea mays, Arabidopsis thaliana, Medicago truncatula, Solanum lycopersicon, and Brassica napus have validated HI capacity. Phylogenetic analysis revealed close relationships between OsDMP1, OsDMP2, OsDMP3, OsDMP4, OsDMP5, and their ZmDMP orthologs (Fig. 2a), suggesting the potential HI capacity of these five DMP homologous genes.
Fig. 2
Phylogenetic tree and tissue expression patterns of OsDMPs. a Phylogenetic tree of OsDMPs. The phylogenetic tree was constructed using the neighbor-joining method with MEGA7 software. Numbers beside branches represent bootstrap values from 1,000 replicates. b Tissue expression patterns of OsDMPs and OsMATL. Tissue samples including root, stem, leaf blade, leaf sheath, leaf ligule, young spike, mature anther, and seed were analyzed. Three biological and technical replicates were performed. Values are presented as mean ± standard error (SE). Different letters indicate significant differences based on the LSD test (P < 0.05). “n” represents the number of biological replicates
Tissue expression patterns and subcellular localization of OsMATL, OsDMP1, OsDMP3, OsDMP4, and OsDMP5Based on the phylogenetic tree, we selected OsDMP1, OsDMP3, OsDMP4, OsDMP5, and OsMATL for tissue expression pattern and subcellular localization studies. Previous studies have shown that MATL and DMP are highly expressed in mature anthers. qRT-PCR were used to explore the tissue expression patterns of OsMATL, OsDMP1, OsDMP3, OsDMP4, and OsDMP5 genes. The results showed that OsMATL, OsDMP1, OsDMP3, and OsDMP4 are abundantly expressed in mature anthers, with very low expression in other tissues (Fig. 2b). In contrast, OsDMP5 exhibited the highest expression level in panicles, with moderate expression in leaves and mature anthers.
Subcellular localization experiments revealed that OsMATL localizes to the cell membrane, OsDMP1 to the endoplasmic reticulum, OsDMP3 to vesicles, OsDMP4 to the endoplasmic reticulum, and OsDMP5 to both the endoplasmic reticulum and nucleus (Fig. 3). The expression patterns and subcellular localization of OsMATL, OsDMP1, OsDMP3, OsDMP4, and OsDMP5 are consistent with, or related to, those of ZmPLA1/MATL/NLD and ZmDMP [16, 17, 26, 27]. Therefore, these results imply that OsMATL, OsDMP1, OsDMP3, OsDMP4, and OsDMP5 may play roles in HI in rice.
Fig. 3
Subcellular localization of OsMATL and OsDMPs. Scale bars = 2 μm. The endoplasmic reticulum, vesicles, and nucleus were visualized with corresponding mCherry fusion proteins. FM4-64 was used as the dye for the cell membrane dye
Synergistic effect on HI in OsMATL and OsDMPs double knockout mutantsTo explore the effects of different combinations of OsMATL and OsDMPs double knockout mutants on HI, double knockout lines were generated in the indica rice variety HH48, with the fourth exon of OsMATL individually targeted along with OsDMP1, OsDMP3, OsDMP4, and OsDMP5. In the T2 generation, we identified 11 double mutant combinations involving OsMATL and OsDMP1, OsDMP3, OsDMP4, and OsDMP5, along with OsMATL single mutants (HH48 matl4−1, HH48 matl4−1dmp1−1, HH48 matl4−1dmp1−2, HH48 matl4−2dmp1−2, HH48 matl4−3dmp1−1, HH48 matl4−4dmp3−1, HH48 matl4−4dmp3−2, HH48 matl4−1dmp4−1, HH48 matl4−5dmp5−1, HH48 matl4−3dmp5−1 and HH48 matl4−5dmp5−2).
Sequence analysis revealed insertions or deletions resulting in amino acid frameshifts. The results showed that three mutation types of OsMATL combined with OsDMP1 resulted in premature termination of protein translation, while the two mutation types of OsDMP1 caused either premature termination or a 25 aa extension of translation. For OsMATL combined with OsDMP3, the OsMATL mutation extended protein translation by 8 aa, and the two OsDMP3 mutation types exhibited translation patterns similar to those of OsDMP1. When OsMATL was combined with OsDMP4, the OsMATL mutation caused premature translation termination, while the OsDMP4 mutation extended translation by 18 aa. Similarly, for OsMATL combined with OsDMP5, three mutation types of OsMATL resulted in either premature termination or a 7 aa extension of translation, while both mutation types of OsDMP5 caused premature translation termination (Additional file 1: Fig. S3).
No significant morphological differences were observed between most mutants and their corresponding WT plants (Additional file 1: Fig. S4). Investigation of SSR and HIR in the self-progeny of the 11 mutants revealed that the average SSR of HH48 was 92.46%. However, for mutants with the fourth exon knockout of MATL, the average SSR dropped to 49.8%. Significant differences in SSR were observed between the OsMATL single mutants and their corresponding double mutants, suggesting that mutations in OsDMP1, OsDMP3 and OsDMP5 reduced SSR (Fig. 4a, c).
Fig. 4
HI effects of OsMATL and OsDMPs double knockout mutants. a Combinations of HH48 and various knockout mutant strains. Bars = 4 cm. b Self-pollinated HIR in OsMATL combined with OsDMP1 or OsDMP3 mutants. Values are presented as mean ± standard deviation. *, P < 0.05. A two-tailed t-test was used (HH48matl4−1 vs HH48matl4dmp1, P = 0.04421; HH48matl4−1 vs HH48matl4dmp1, P = 0.03217). “n” represents the HIR statistics for different mutation types of OsMATL combined with OsDMP1 and OsDMP3. c SSR in self-pollinated HH48 and various knockout mutant strains. Values are presented as mean ± standard deviation. **, P < 0.01; ***, P < 0.001; ****, P < 0.0001; ns, not significant. A two-tailed t-test was used (HH48 vs HH48matl4−1, P = 5.50351E − 05; HH48 vs HH48matl4−1dmp1−1, P = 1.46799E − 05; HH48 vs HH48matl4−1dmp1−2, P = 5.5932E − 07; HH48 vs HH48matl4−2dmp1−2, P = 2.20578E − 05; HH48 vs HH48matl4−3dmp1−1, P = 1.81381E − 06; HH48 vs HH48matl4−4dmp3−1, P = 3.70733E − 05; HH48 vs HH48matl4−4dmp3−2, P = 8.60814E − 06; HH48 vs HH48matl4−1dmp4−1, P = 8.80295E − 06; HH48 vs HH48matl4−5dmp5−1, P = 1.99915E − 05; HH48 vs HH48matl4−3dmp5−1, P = 2.86412E − 06; HH48 vs HH48matl4−5dmp5−2, P = 2.51489E − 06; HH48matl4−1 vs HH48matl4−1dmp1−1, P = 3.12917E − 01; HH48matl4−1 vs HH48matl4−1dmp1−2, P = 9.11697E − 05; HH48matl4−1 vs HH48matl4−2dmp1−2, P = 9.25989E − 04; HH48matl4−1 vs HH48matl4−3dmp1−1, P = 1.53088E − 04; HH48matl4−1 vs HH48matl4−4dmp3−1, P = 1.80635E − 03; HH48matl4−1 vs HH48matl4−4dmp3−2, P = 4.94300E-04; HH48matl4−1 vs HH48matl4−1dmp4−1, P = 3.08523E-01; HH48matl4−1 vs HH48matl4−5dmp5−1, P = 1.4528E − 03; HH48matl4−1 vs HH48matl4−3dmp5−1, P = 2.30704E − 04; HH48matl4−1 vs HH48matl4−5dmp5−2, P = 3.20225E − 04). “n” represents the number of rice plants used for SSR statistics. d Determination of cell ploidy level using flow cytometry. e Grain morphology of self-pollinated diploid and haploid plants. Bars = 5 mm. f Morphology of self-pollinated diploid and haploid plants. Bars = 10 cm. g Panicle morphology of self-pollinated diploid and haploid plants. Bars = 16 mm. h Morphology of hybrid diploid and haploid plants. Bars = 9 cm. D, diploid; H, haploid
Further analysis showed that all mutants of HH48 matl4dmp1 and HH48 matl4dmp3 (except for HH48 matl4−1dmp1−2, which had insufficient seed quantity) were capable of inducing haploids through self-pollination, which haploids were not observed for HH48 matl4dmp4 and HH48 matl4dmp5 mutants due to limited plant numbers. Overall, we identified haploids in the self-progeny of HH48 matl4−1, HH48 matl4−1dmp1−1, HH48 matl4−1dmp1−2, HH48 matl4−2dmp1−2, HH48 matl4−3dmp1−1, HH48 matl4−4dmp3−1, and HH48 matl4−4dmp3−2, with average HIRs of 1.97%, 3.34%, 2.63%, 3.55%, 2.28%, 3.76%, and 3.21%, respectively (Additional file 2: Table S4). These haploid plants exhibited typical characteristics, such as reduced size and male sterility (Fig. 4e–g), with ploidy levels confirmed by flow cytometry (Fig. 4d). Mutants of HH48 matl4dmp1 and HH48 matl4dmp3 displayed higher average HIRs compared to HH48 matl4−1 (Fig. 4b), indicating that mutations in OsDMP1 and OsDMP3 can influence HIR in the presence of OsMATL in indica rice.
In cross-pollination experiments, all types of mutants, when used as pollen donors with Hang 93S, successfully induced haploids, except for HH48 matl4−2dmp1−2 (Fig. 4h, Additional file 2: Table S5). No haploid individuals were detected from HH48 pollination. All haploids were confirmed by flow cytometry. Interestingly, the HIR from hybridization experiments was consistent with the results from self-pollination experiments. Double mutants of HH48 matl4dmp1 and HH48 matl4dmp3 exhibited significantly higher HIRs compared to HH48 matl4−1 mutant (Additional file 2: Table S5). In summary, these results indicate that mutations in OsDMP1 and OsDMP3 can increase HIR in the presence of OsMATL in indica rice.
Comments (0)