
Remember me

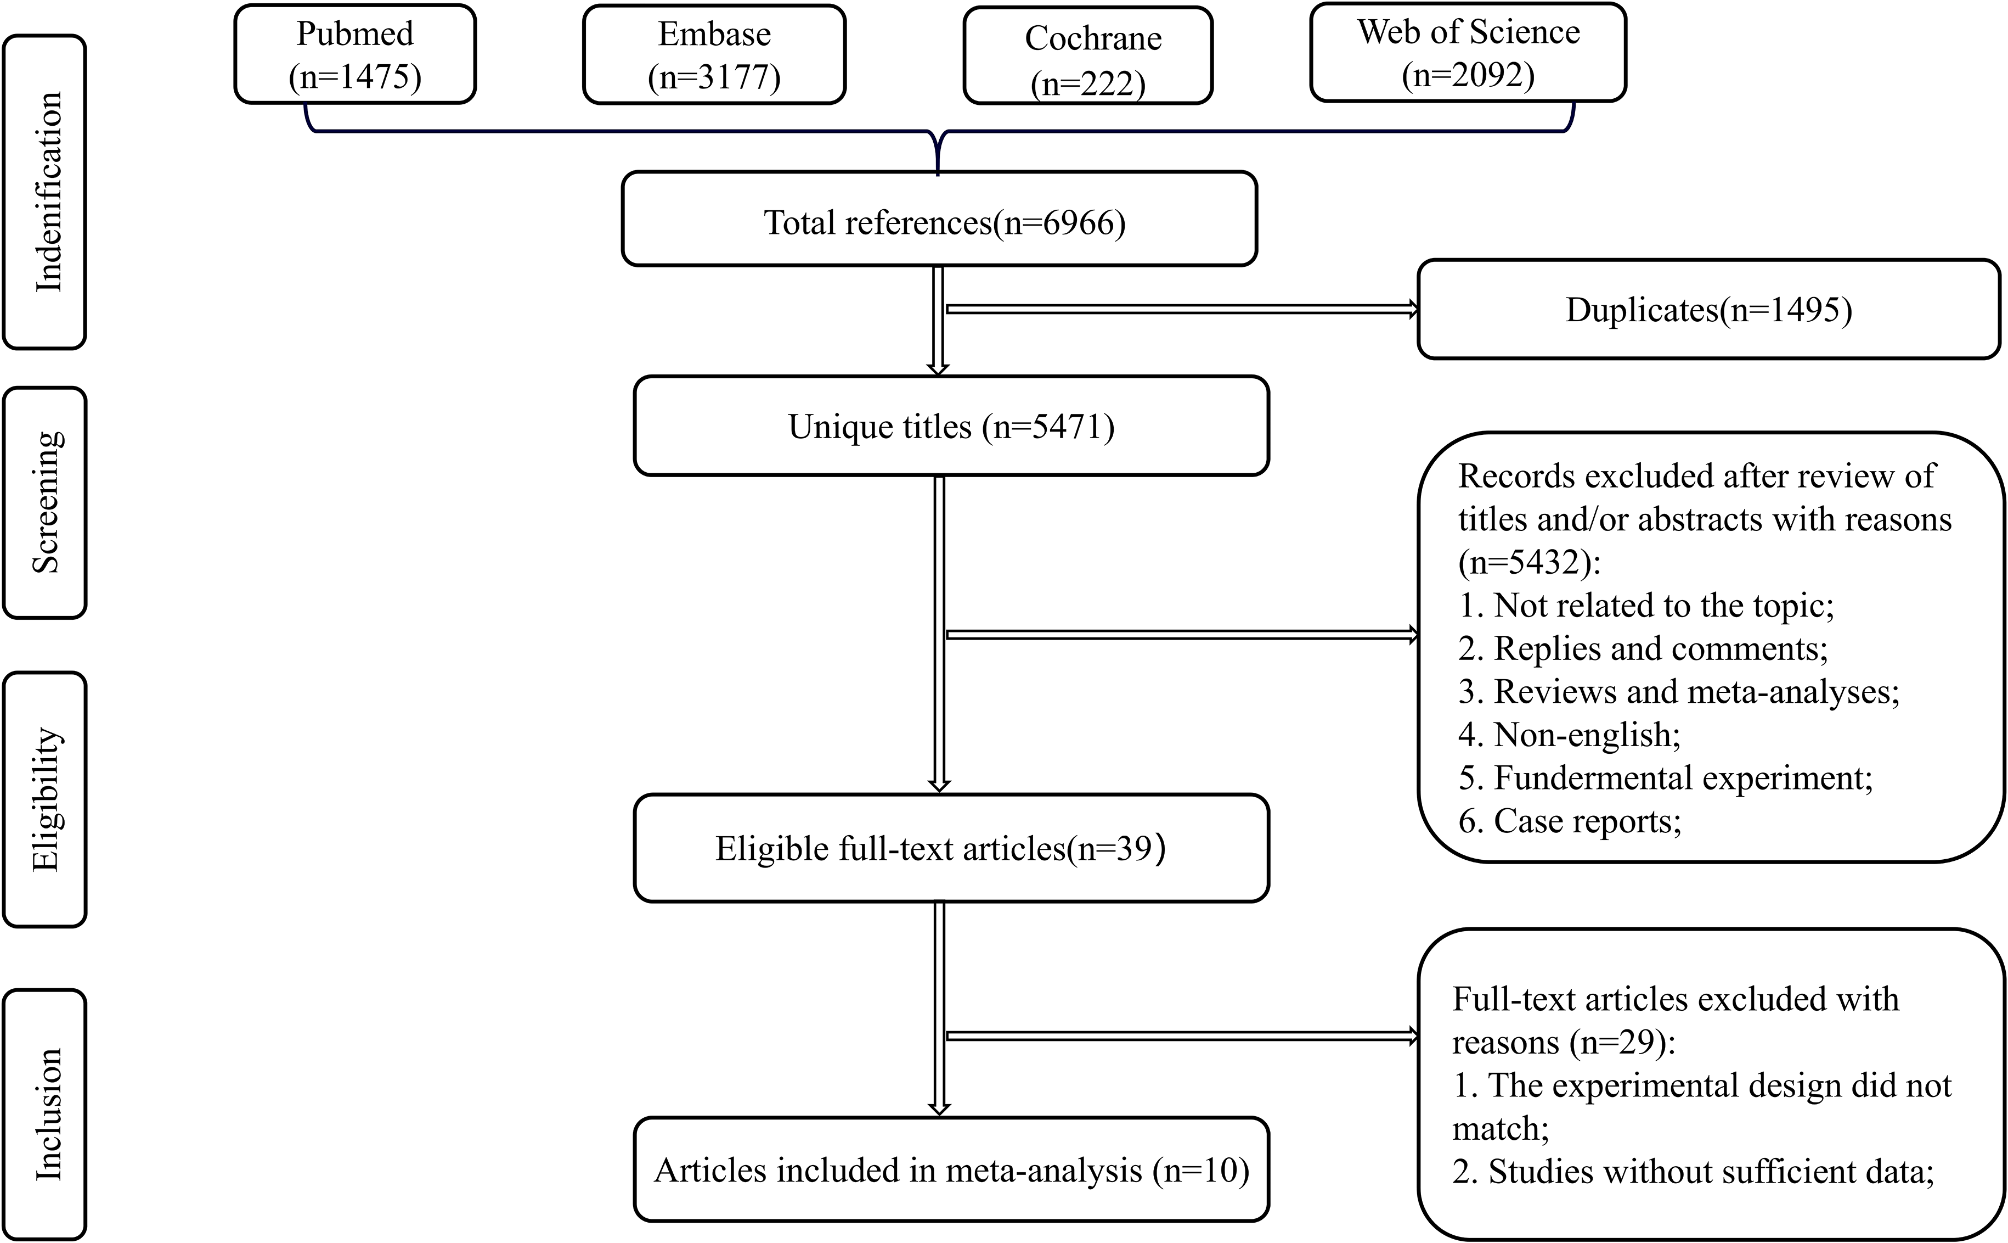


The literature selection process is illustrated in Fig. 1. The initial literature search yielded 80 potentially eligible studies. In total, 38 studies were excluded due to duplication. The remaining 42 studies were screened for titles and abstracts, and 7 studies were excluded for the following reasons: not an RCT or a cadaveric and animal study. A total of 35 studies that had potential for inclusion were reviewed by their full texts. In total, 29 articles were excluded subsequently due to the following reasons: missing outcomes, no control group, or irrelevant outcomes. Finally, 6 RCTs [8, 9, 12,13,14,15] were included for further analysis.
Fig. 1
PRISMA flow chart of the literature search and selection process
Main characteristics of included studiesThe 6 included RCTs comprised 507 feet: 261 in the chevron osteotomy group and 246 in the scarf osteotomy group. The patient characteristics and results of these RCTs are listed in Table 1. All RCTs were published between 2007 and 2018. Of the 6 included RCTs, 3 RCTs were conducted in the Netherlands [8, 12, 14] and one each in Egypt, [15] the United Kingdom, [9] and Australia [13]. Additional Akin osteotomies were performed in 4 cases in both groups in the study of Elshazly et al. [15]. Lee et al. [13] compared percutaneous modified chevron/akin osteotomies and open scarf/akin osteotomies of all groups for the correction of hallux valgus. Akin osteotomies were not reported in the other 4 RCTs [8, 9, 12, 14].
Table 1 Characteristics of included trialsQuality of the studiesRisks of all types of bias are plotted in Figs. 2 and 3. All RCTs claimed randomization, but 4 RCTs [8, 9, 13, 14] did not report the random sequence generation method. Moreover, 2 RCTs [12, 15] reported details of random sequence generation, 2 RCTs [8, 9] reported allocation concealment and 2 studies [9, 13] reported blinding of participants and personnel. Finally, only 1 study [13] indicated blinding of outcome assessors and thus indicated the use of double-blinding.
Fig. 2 Fig. 3
 Meta-analysis results
Postoperative HVAs were compared between the chevron and scarf osteotomy groups (Fig. 4) in all 6 included RCTs [8, 9, 12,13,14,, 15]. A fixed-effects model was used because heterogeneity among the included trials was mild (I2 = 38%, P = .16). Meta-analysis revealed that the chevron osteotomy group had significantly smaller postoperative HVAs than did the scarf osteotomy group (WMD = − 1.94, 95% CI = − 2.65 to − 1.29, P < .00001). In the fixed effect model, because heterogeneity is not assumed, the weights are primarily determined by sample size and precision. Consequently, studies with higher precision carry more weight in the overall analysis. In the study of Lee et al. [13], the standard deviations in both groups are the smallest among all the studies, resulting in this study receiving the greatest weight.
Fig. 4
Forest plot analysis of postoperative HVAs for the chevron and scarf osteotomy groups
Next, postoperative IMAs were compared between the chevron and scarf osteotomy groups in all 6 RCTs [8, 9, 12,13,14,, 15] (Fig. 5). The heterogeneity of the results was high (I2 = 72%, P = .004); hence, we used the random-effects model. However, the differences in postoperative IMAs existed between the chevron and scarf osteotomy groups were nonsignificant (τ2 = 0.44, χ2 = 17.59, df = 5, WMD = − 0.44, 95% CI = − 1.10 to 0.22, P = .19).
Fig. 5
Forest plot analysis of postoperative IMAs for the chevron and scarf osteotomy groups
The postoperative AOFAS scores were compared between the chevron osteotomy and scarf osteotomy groups, with 3 RCTs [8, 12, 13] included (Fig. 6). Because the heterogeneity of the results was high (I2 = 91%, P < .0001), we employed the random-effects model. Meta-analysis revealed nonsignificant differences in postoperative AOFAS scores between the chevron and scarf osteotomy groups (τ2 = 25.58, χ2 = 21.57, df = 2, WMD = 0.75, 95% CI = − 5.32 to 6.82, P = .81). The postoperative AOFAS scores were also compared between the chevron osteotomy and scarf osteotomy groups in the study Jeuken et al. [14]. However, the standard deviations were not given in the study, the RCT is excluded in the forest plot (Fig. 6).
Fig. 6
Forest plot analyses of postoperative AOFAS scores for the chevron and scarf osteotomy groups
Postoperative complications between the chevron and scarf osteotomy groups were analyzed, with 5 RCTs [8, 9, 12, 13, 15] included (Fig. 7). The heterogeneity between studies was homogenous (I2 = 0%, P = .48); thus, the fixed-effects model was applied for the calculation of RRs and 95% CIs. Meta-analysis revealed that no significant differences in postoperative complication rates existed between chevron osteotomy and scarf osteotomy groups (RR = 1.22, 95% CI = 0.65–2.27, P = .53). Postoperative complications between the chevron and scarf osteotomy groups were not compared in the study of Jeuken et al. [14].
Fig. 7
Forest plot analysis of postoperative complication rates for the chevron and scarf osteotomy groups
Comments (0)