
Remember me


Computed tomography (CT) and magnetic resonance imaging (MRI) are the primary imaging modalities for the diagnosis and follow-up of RBNSTs.
RBNSTs are usually located in the paravertebral region, close to the inferior vena cava and aorta, and less commonly, adjacent to the kidney, pre-sacral space, around the porta hepatis, and/or abdominal wall [12]. Within the retroperitoneal region, the presence of a mass characterized by a smooth expansion, that originates in proximity to the spine, in the context of the psoas muscle, or that affects the neural foramina devoid of evident bony destruction, indicates a potential benign neural origin; however, these findings are not specific.
When a RBNST is localized in proximity to the duodenum or pancreas, identifying the precise organ of origin on CSI can be challenging. Indicative signs such as the “beak sign”, wherein a mass distorts the edge of an adjacent organ into a distinctive “beak” shape, the “phantom organ sign”, which occurs when a mass emerges from a smaller organ causing the latter to appear indistinct, and the “embedded organ sign”, where segments of an organ seem embedded within the tumor, may be indicative of a duodenal or pancreatic origin [13].
Schwannomas and solitary neurofibromas are often indistinguishable on CSIs. Typically, RBNSTs manifest as round or oval lesions, different from BNSTs located in the extremities that usually acquire a spindle shape; this disparity arises since RBNSTs affect smaller peripheral nerves or nerve plexuses while those located in the extremities are contiguous with a specific nerve [13].
In general, on CT they appear as hypodense lesions (20–40 Hounsfield Units), minimally enhancing in the dynamic phases [1]. MRI characteristics are also non-specific: intermediate signal on T1-weighted images, hyperintensity on T2-weighted images, and variable contrast enhancement [3, 14].
On imaging, Schwannomas may show two distinct components that reflect their histology: the myxoid-rich Antoni B areas appear hypodense on CT, hyperintense on T2-weighted, and hypointense on T1-weighted MRI, with poor contrast enhancement; the Antoni A areas with compact cells display relatively high density on CT, hypointense signal on T2-weighted MRI, and gradually progressive enhancement. These features result in a heterogeneous pattern on post-contrast CT or MRI (Figs. 1–5) [15].
Fig. 1
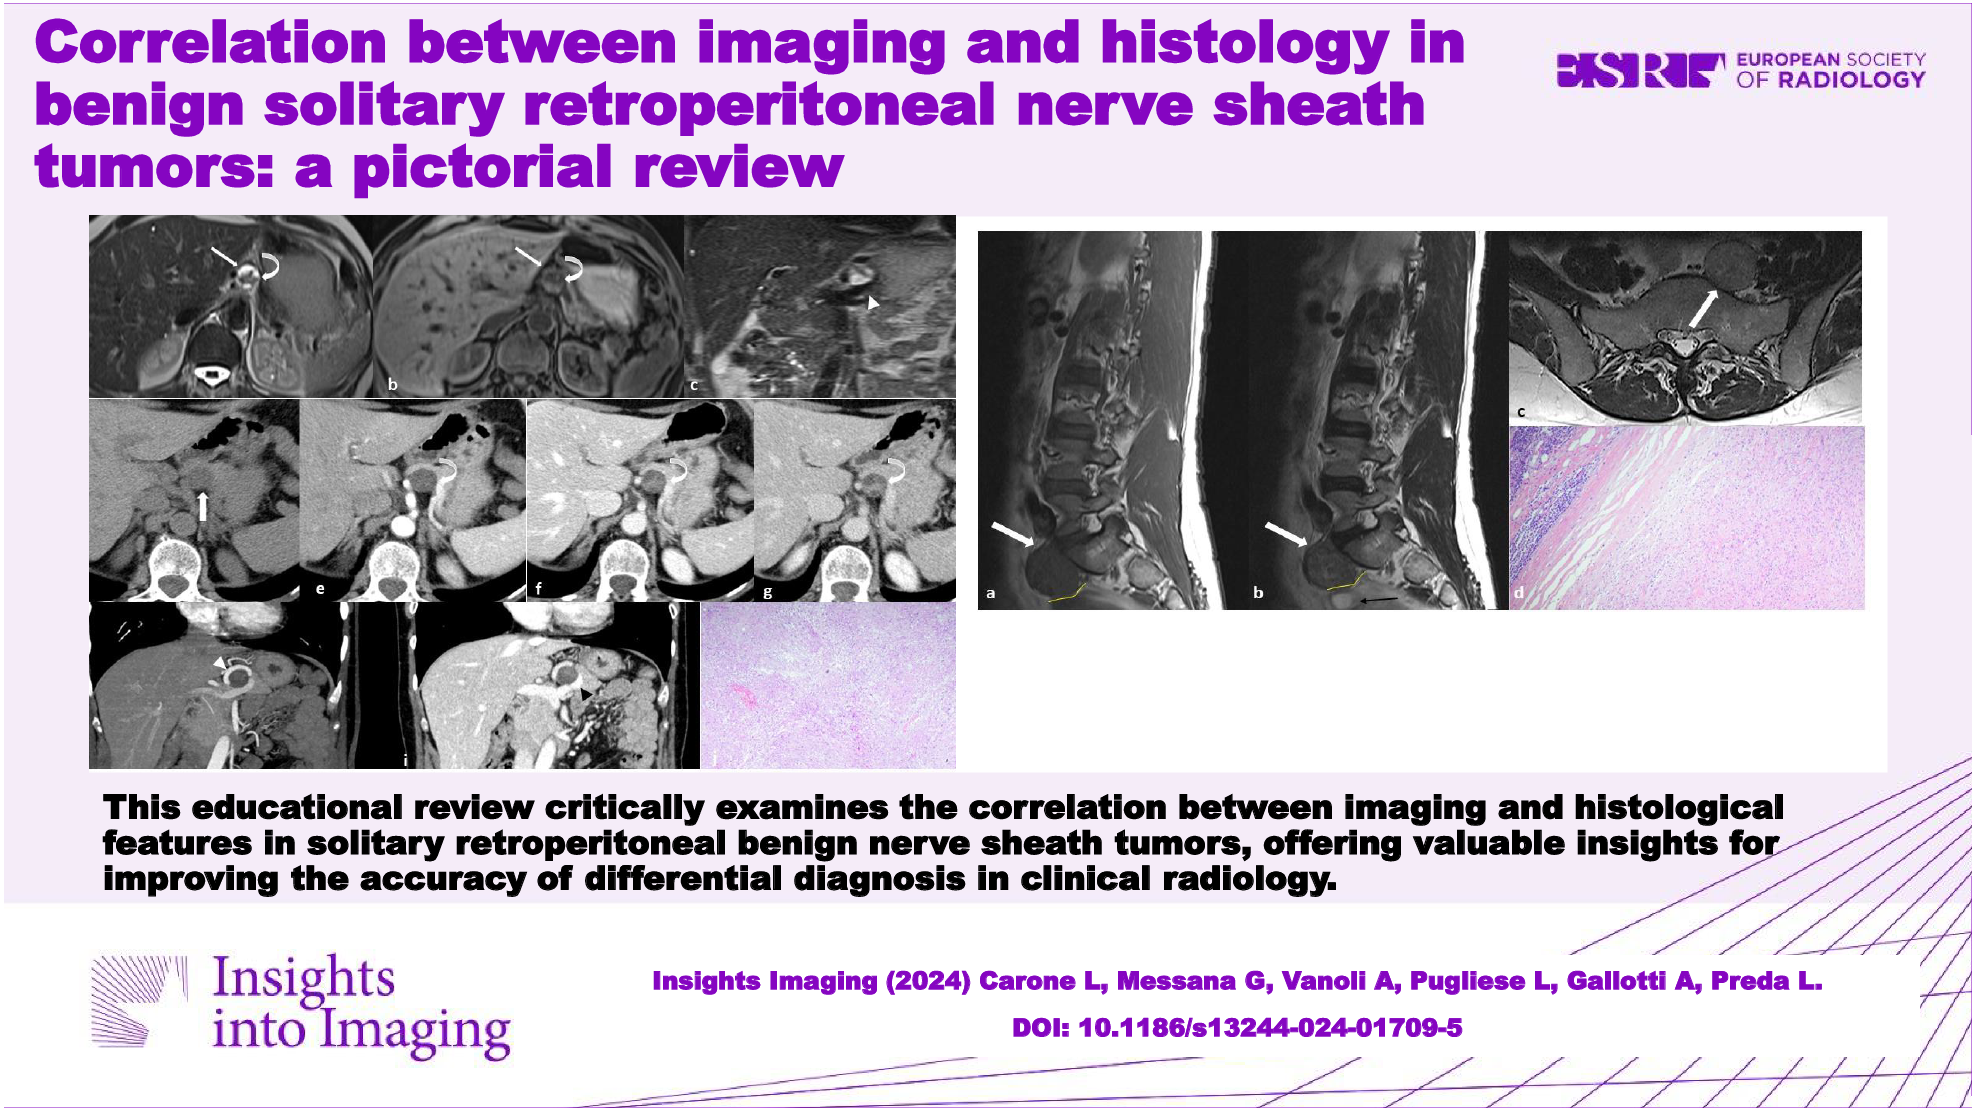
a–d MR images in a 46-year-old woman with a peripancreatic round mass determining slight compression of the inferior vena cava. The lesion has a heterogenous signal on both T2-weighted (a) and T1-weighted (b) images due to the presence of cystic (white arrows) and solid (black arrows) components. The solid component has progressive contrast enhancement (white arrowheads in c and d). These findings were suspicious for mucinous cystadenomas of the pancreatic head. e Final histology reveals intermixed “Antoni A” (on the left, black arrow) and “Antoni B” (on the right, black arrowhead) areas (Hematoxylin-eosin stain; original magnification, × 40), compatible with Schwannoma
Fig. 2
a, b Axial MR images of a patient with incidentally discovered small peripancreatic round mass: T2-weighted (a) and T1-weighted fat-sat (b) sequences show mixed intralesional solid (curved arrows) and cystic (straight arrows) components. c Coronal T2w image demonstrates the close relationship with the splenic vein (white arrowhead). d, e Axial CT images of the same patient: before contrast medium administration the lesion (arrow) is hypo-isodense (d); contrast enhancement appears progressive and inhomogeneous providing the lesion a pseudocystic appearance due to the presence of a solid inner component (curved arrow, e–g). h, i Coronal maximum intensity projection (MIP) (h) and multiplanar reconstructed (MPR) (i) CT images better show the close relationship with the splenic artery (white arrowhead, (h) and vein (black arrowhead, i), both encircling the lesion. j At microscopic examination, the mass exhibits an encapsulated proliferation of spindle cells in a storiform pattern (black arrow) with focal nuclear palisades (Verocay bodies in an Antoni A area) and areas of cystic degeneration (Antoni B, black arrowhead), compatible with Schwannoma (Hematoxylin-eosin stain; original magnification, × 40); S-100 was strongly and diffusely expressed by tumor cells (not shown)
Fig. 3
a Axial contrast-enhanced CT image in a 28-year-old man shows a retrocaval, round, solid mass (white arrow) with heterogeneous enhancement due to the presence of intralesional necrosis; the mass compresses the inferior vena cava (blue line) without evidence of thrombosis. b Axial delayed-phase CT image shows ureteral opacification, with the right ureter running close to the mass without encasement or obstruction (black arrow). c On microscopic examination, proliferating spindle tumor cells arranged in a fascicular fashion and accompanied by collagenous fibers (black arrowhead) are observed (Hematoxylin-eosin stain; original magnification, × 40); immunohistochemically, the tumor cells were strongly positive for S-100 protein and the Ki67-index was about 3% (not shown)
Fig. 4
a–d CT images in a 64-year-old woman with a history of breast cancer incidentally reveal a round, paracaval solitary mass (white arrows); in the non-contrast-enhanced image (a) the mass appears solid and isodense with small, focal, inner calcification; after contrast medium administration, progressive enhancement is visible (b–d)
Fig. 5
Same patient as in Fig. 4. a–h) MR images show a round mass (white arrows) with slightly hyperintense signal on T2-weighted images due to focal cystic degeneration (a), intermediate signal on T1-weighted images (b), high signal on diffusion-weighted images with the highest b value (c) associated with elevated apparent diffusion coefficient (ADC) signal (d). The mass is characterized by progressive contrast enhancement (f–h). i On 18F-FDG PET/CT, the lesion shows a central area of hypercaptation (white arrow). j After surgical removal, the final histology was a hypercellular Schwannoma (Antoni A): tumor cells are spindle and wavy (black arrowheads) with tapered ends and show ill-defined cytoplasm (Hematoxylin-eosin stain; original magnification, × 40)
Similarly, the enhancement pattern in neurofibromas reflects their underlying histological features. Tumors characterized pathologically by a hypocellular proliferation of interlacing bundles of elongated bland cells often display heterogeneous contrast enhancement (Figs. 6–7). Conversely, tumors characterized by a highly cellular proliferation of spindle cells typically exhibit homogeneous contrast enhancement (Fig. 8) [1].
Fig. 6
a–d Axial non-contrast (a) and contrast-enhanced (b, c, d) CT images show a left pre-sacral, oval mass (black arrows), with progressive and heterogeneous contrast enhancement due to intralesional necrosis (white arrows in c and d). Sagittal MIP reconstruction (e) shows the left ovarian artery (black curved arrow) displaced by the mass
Fig. 7
Same patient as in Fig. 6. a–c Sagittal T1-weighted (a) and T2-weighted (b) MR images and axial T2-weighted (c) image show a well-defined pre-sacral solid mass (white arrows), encased by a thin fibrous pseudocapsule; fatty cleavage (yellow line in a and b) separates the mass from the left ovary (black arrow in b). d Low-power photomicrograph shows representative histological features of neurofibroma: a hypocellular proliferation (black arrow) composed of interlacing bundles of elongated bland cells with wavy nuclei and interspersed collagen fibrils. No Verocay bodies or nuclear palisading are seen (Hematoxylin-eosin stain; original magnification, × 40)
Fig. 8
a–c Axial CT images (a non-contrast, b and c contrast-enhanced) show a well-defined, oval, right-sided pelvic mass (white arrows); this hypodense mass appears well circumscribed, with slight peripheral contrast enhancement on the ventral portion; no compression on surrounding structures is visible. d Ultrasound shows a well-defined, round, homogeneously hypoechoic pelvic mass (white arrow) adjacent to the right external iliac artery (white asterisk) (courtesy of Dr. Ravetta). e Intraoperative image of laparoscopic excision of the mass. f Photograph of gross pathologic specimen confirms that the mass seen in (a–c) is well-circumscribed with a solid and homogeneous cut surface. g Low-power photomicrograph demonstrates a proliferation of spindle cells with tapered and wavy nuclei (black arrowheads), indistinct cytoplasmic borders arranged in fascicles (Hematoxylin-eosin stain; original magnification, × 40), compatible with neurofibroma
Neurofibromas and, less frequently, Schwannomas may show the “target sign”, characterized by a central area of hyperdensity surrounded by a peripheral hypodensity on CT scans, while on MRI it consists of a central area of hypointensity and peripheral hyperintensity on T2-weighted images or a central focal area of contrast enhancement and peripheral hypointensity on gadolinium-enhanced T1-weighted images (Fig. 9) [16].
Fig. 9
Retroperitoneal Schwannoma in a 52-year-old woman. a–f MR images show a round encapsulated mass (white arrows) with a central area of hypointense signal and peripheral hyperintensity on T2-weighted images (target sign) (a–b), intermediate signal on T1-weighted images (c), inhomogeneous contrast enhancement on fat-suppressed gadolinium-enhanced T1-weighted images, with a central focal area of contrast enhancement surrounded by peripheral hypointensity and an outer area of enhancement (d); moderate signal on diffusion-weighted images with the highest b value (e) associated with a peripheral hypointensity on apparent diffusion coefficient (ADC) map (f). g On non-enhanced CT, the lesion appears homogeneously isodense to the muscles. h On 18F-FDG PET/CT, it shows a focal area of hypercaptation (black arrow)
RBNSTs may also demonstrate the “fascicular sign”, i.e., numerous small ring-like structures with peripheral hyperintensity at T2-weighted MRI, that most likely represent the fascicular bundles within the nerves, however, this sign has been described also in the case of well-differentiated malignant nerve sheath tumors [1, 17].
In addition, RBNSTs’ density and intensity depend on spontaneous intralesional rearrangements [18, 19], such as cystic degeneration, hemorrhage, necrosis, and calcifications [16, 17] (Figs. 1, 2, 4, 5, 10). While cystic degeneration is present in a significant proportion of Schwannomas, it cannot be considered a distinctive hallmark due to its occurrence in retroperitoneal sarcomas as well [17, 20].
Fig. 10
a–e Magnetic resonance (MR) images of a 63-year-old man with a voluminous pre-sacral mass: on T2-weighted (a) and T1-weighted (b) images the lesion appears grossly inhomogeneous with signs of internal cystic degeneration (white arrows) and septa (red dotted lines); heterogenous enhancement is seen after contrast medium administration (c); no hyperintense signal is seen in diffusion-weighted imaging (DWI) (d) nor pathological signal restriction on apparent diffusion coefficient (ADC) sequence (e). f, g Contrast-enhanced computed tomography (CT) images of the same lesion showing rare, focal inner calcifications (f, white arrows) and similar features of cystic degeneration and septa seen on MRI (g). The mass has clear, regular boundaries and no infiltration of the surrounding structures is detectable at any level suggesting its expansive behavior. h Histology reveals the proliferation of predominantly spindle cells, with no significant cytologic atypia or increased mitotic activity. Hypercellular (Antoni A, lower part, black arrow) and hypocellular (Antoni B, upper part, black arrowhead) areas are seen. Immunohistochemistry revealed diffuse positivity for S-100 and a low Ki67 proliferation index (not shown) consistent with Schwannoma
The cystic areas appear hypodense on unenhanced CT images, hyperintense on T2-weighted MR images, and without enhancement after contrast administration. Hemorrhagic foci should be suspected based on intralesional hyperintense areas on T1-weighted MR images. Calcifications may be punctate, mottled, or curvilinear and, when present, are usually localized on the peripheral region of the tumor [3].
When performed, 18F-fluorodeoxyglucose-positron emission tomography/CT (FDG-PET/CT) reveals FDG accumulation in the solid components of RBNSTs (Figs. 5, 9).
Comments (0)